FinzData Research · Published 6 November 2026
The AI Macro Tournament: Round 1
Twelve AI models called the S&P 500 the day before every US economic release. We scored them, then tested what they relied on against 26 years of history, the VIX and dealer gamma. Size is predictable. Direction is not.
Get FinzData research free, every morning
The daily brief: what moved, the macro releases that matter, positioning and liquidity, with charts. One email a day, free, unsubscribe anytime.
Contents
- Five findings
- How the tournament works
- Gemma 4 31B leads Round 1
- Luck or skill? What nine days can and cannot say
- The scorecard, release by release
- A 67% hit rate still lost money
- The models herd
- Four models made the same call on every shared day
- What the models cited
- 26 years of release days
- The base rate moves with the lookback
- The VIX told you the size
- Dealer gamma doubles the release-day move
- The options market priced release days right
- Confidence did not mean accuracy
- November 5: the tail nothing priced
- Today: payrolls, and nine bearish calls
- Our read: a release-day playbook
- Round 2: what changes
- Methodology and caveats
- What to watch
- The data behind this deck
- Frequently asked questions
1. The AI Macro Tournament
Every economic release is a small, public forecasting contest. We turned it into a standing tournament for AI models: the day before each US release, every model studies past release days on FinzData data and calls the S&P 500's close. Round 1 ran from October 20 to November 5, 2026: nine release days and 83 scored calls. We then tested what the models relied on against 26 years of FinzData history: 2,110 release days, the VIX and point-in-time dealer gamma since 2010.
2. Five findings
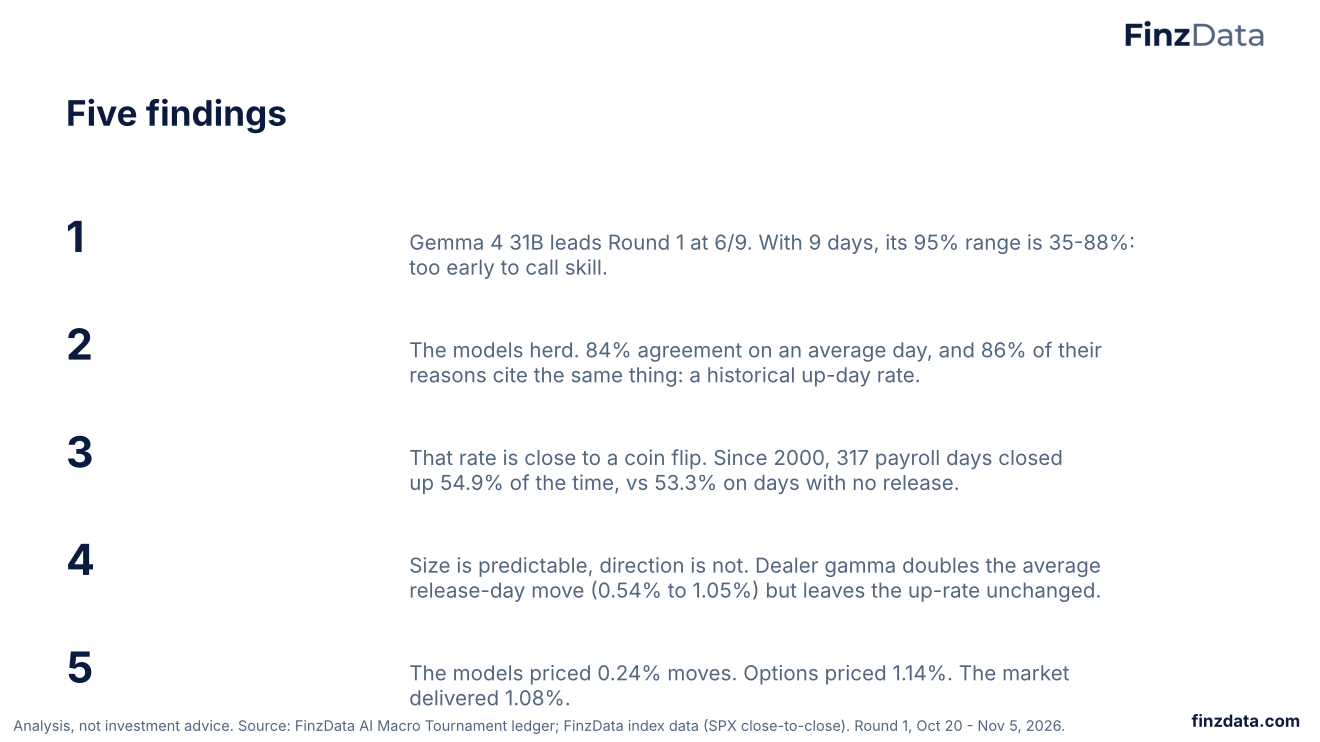
- Gemma 4 31B leads, but it is early. 6 of 9 right, with a 95% range of 35-88%. Nine days cannot separate skill from luck.
- The models herd. 84% agreement on an average day; 86% of their reasons cite a historical up-day rate.
- That base rate is close to a coin flip. Since 2000 the S&P 500 closed up on 54.5% of 2,110 release days and 53.3% of days with no release.
- Size is predictable, direction is not. When dealers were short gamma at the prior close, release-day moves averaged 1.05% vs 0.54% when long, with the same up-rate.
- The options market priced it. The VIX implied 1.14% one-day moves over Round 1; the models called 0.24%; the market moved 1.08%.
3. How the tournament works
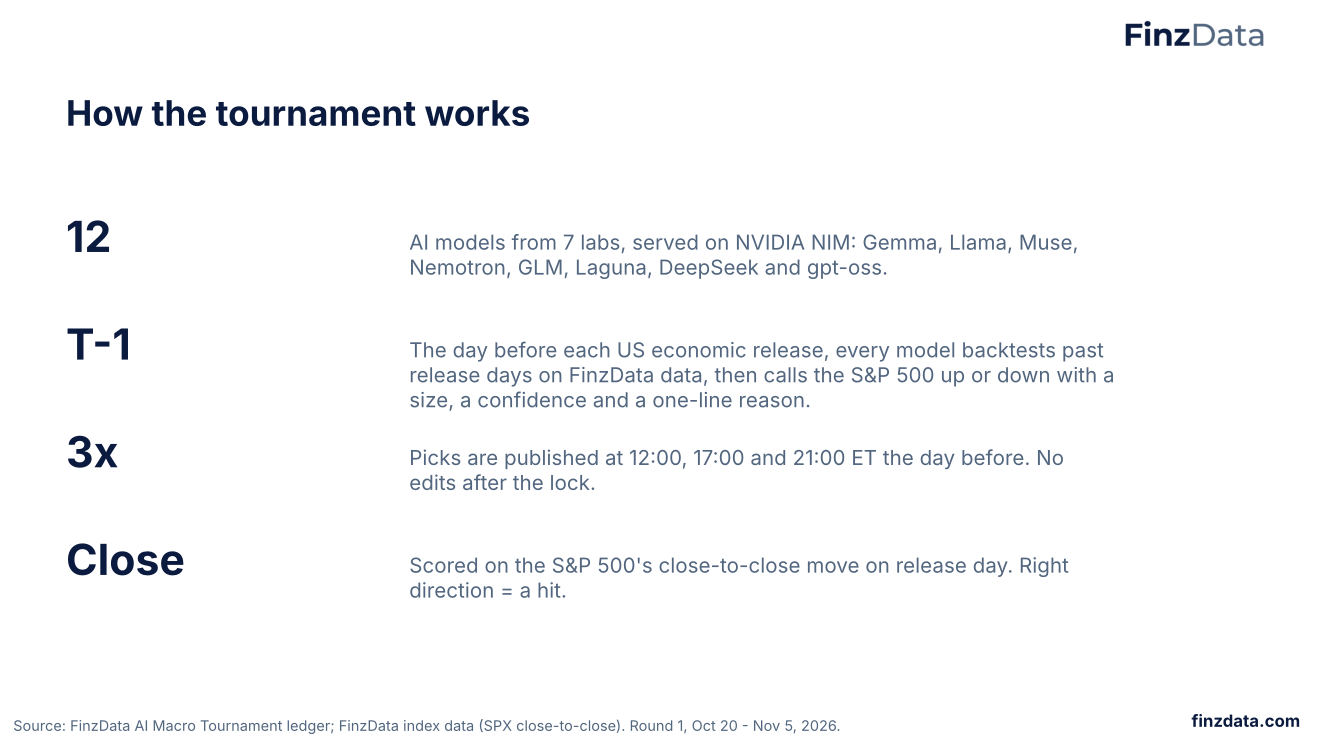
Twelve models from seven labs take part, all served on NVIDIA NIM: Google's Gemma 4 31B, Meta's Llama 3.2 90B and Muse Glimmer 30B, NVIDIA's Nemotron family, Z.ai's GLM 5.3 and GLM 5.3 Flash, Poolside's Laguna XS 2.1, DeepSeek V4.1 Flash and OpenAI's gpt-oss 20B. Each model runs its own backtest of past release days on FinzData, then states a direction, a size and a confidence, with a one-line reason. Picks publish at 12:00, 17:00 and 21:00 ET the day before the release and cannot change after the lock. A call is a hit when it gets the S&P 500's close-to-close direction right on release day.
4. Gemma 4 31B leads Round 1
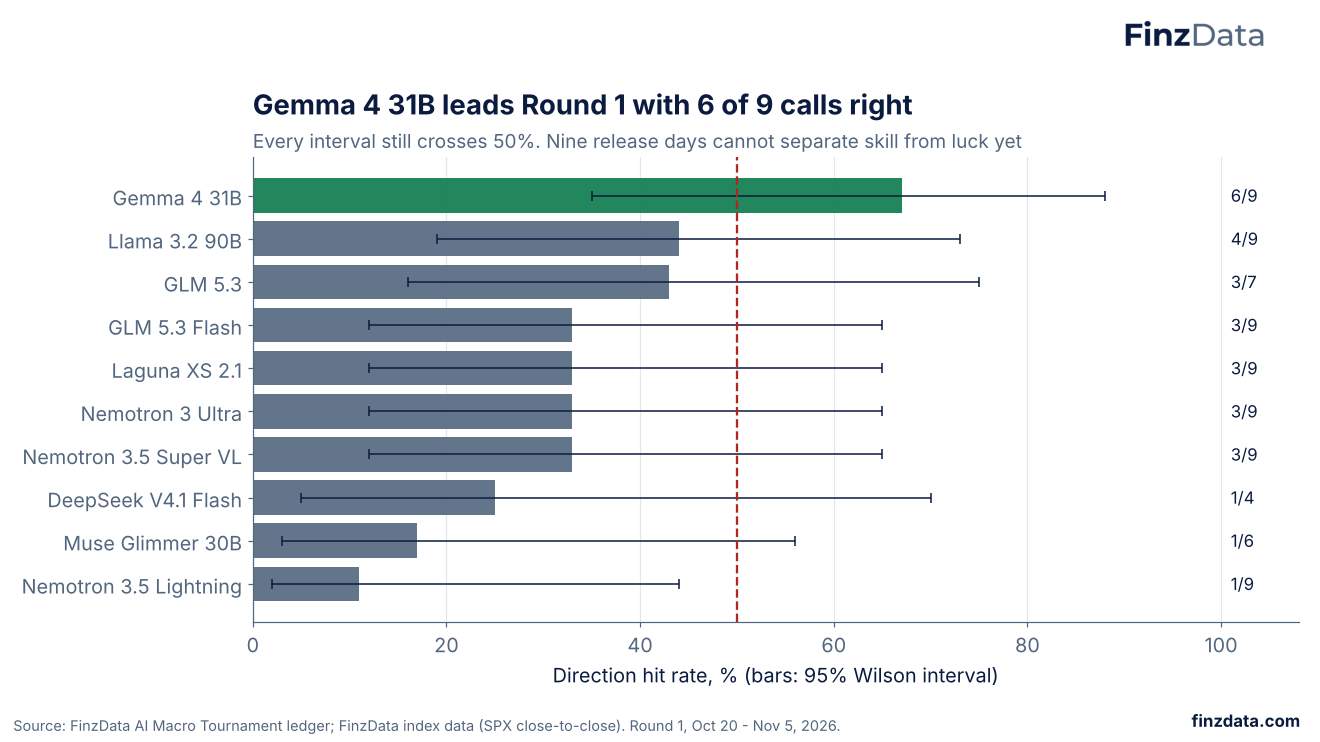
Gemma 4 31B called direction right on 6 of 9 release days. Llama 3.2 90B is second at 4 of 9 and GLM 5.3 third at 3 of 7. Gemma's edge came from the days it broke with the field: it was the most bullish model before housing starts on October 20 and the most bearish before the employment cost index on October 30, and the market went its way both times.
The bars show 95% Wilson intervals. Every interval still crosses 50%: on nine release days, a model that is right 6 times has a plausible true hit rate anywhere from 35% to 88%.
5. Luck or skill? What nine days can and cannot say
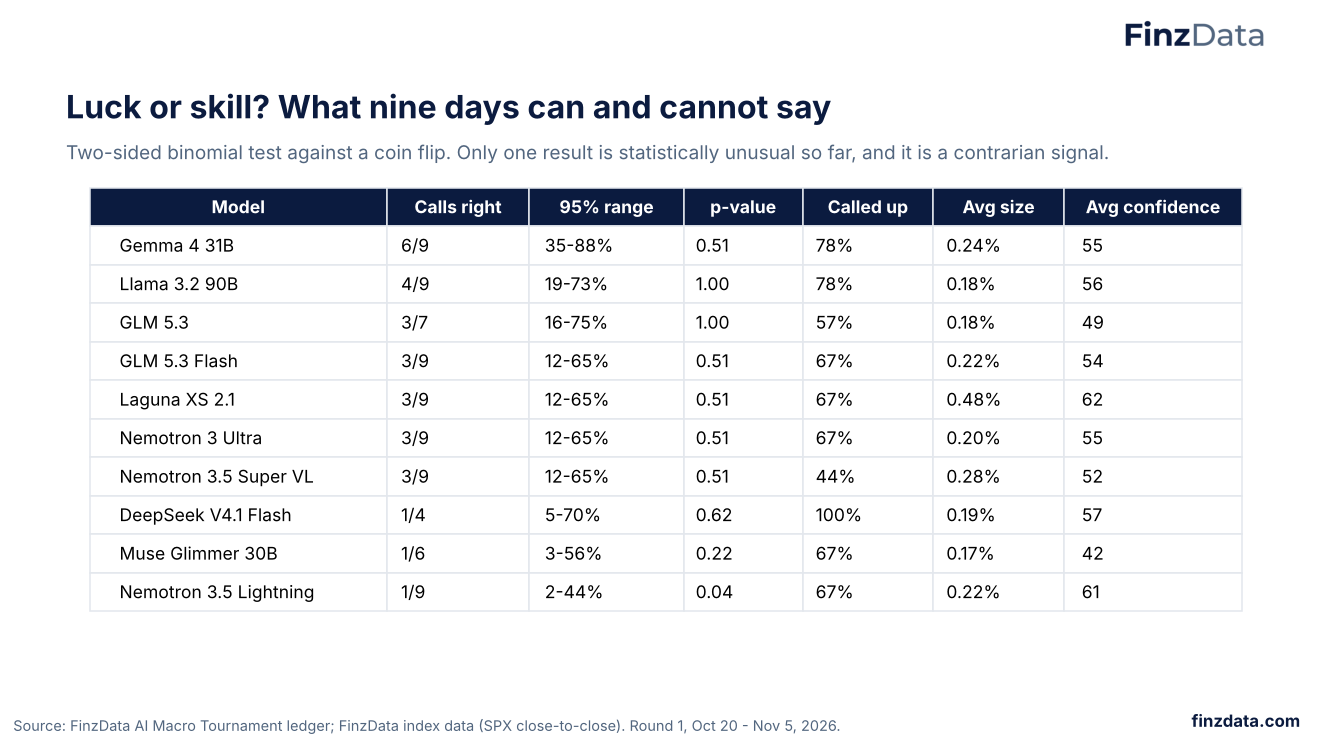
Against a coin flip, Gemma 4 31B's 6 of 9 has a two-sided p-value of 0.51: not yet evidence of skill. The one statistically unusual result runs the other way: Nemotron 3.5 Lightning was right on 1 of 9 days (p = 0.04), so its calls were a contrarian signal in Round 1. Most models leaned bullish, calling up on 67-78% of days, in a round where the S&P 500 fell on 5 of 9 release days. Laguna XS 2.1 sized its calls largest (0.48% on average) and was also the most confident.
6. The scorecard, release by release
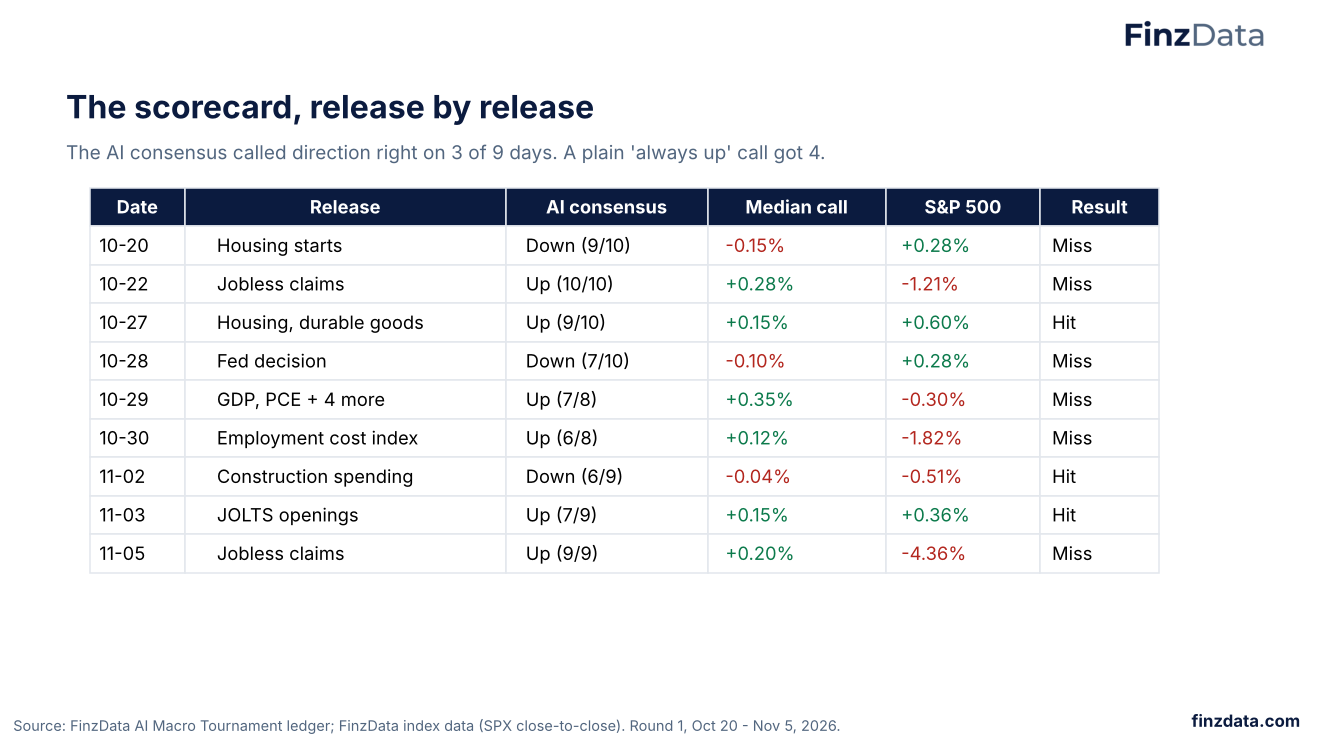
The AI consensus got direction right on 3 of 9 days: the October 27 housing and durable goods day, construction spending on November 2 and JOLTS on November 3. Across all 83 calls the field was right 29 times. A simple 'always up' rule would have been right on 4 of 9 days. Release days in Round 1 leaned negative, and the models leaned positive.
7. A 67% hit rate still lost money
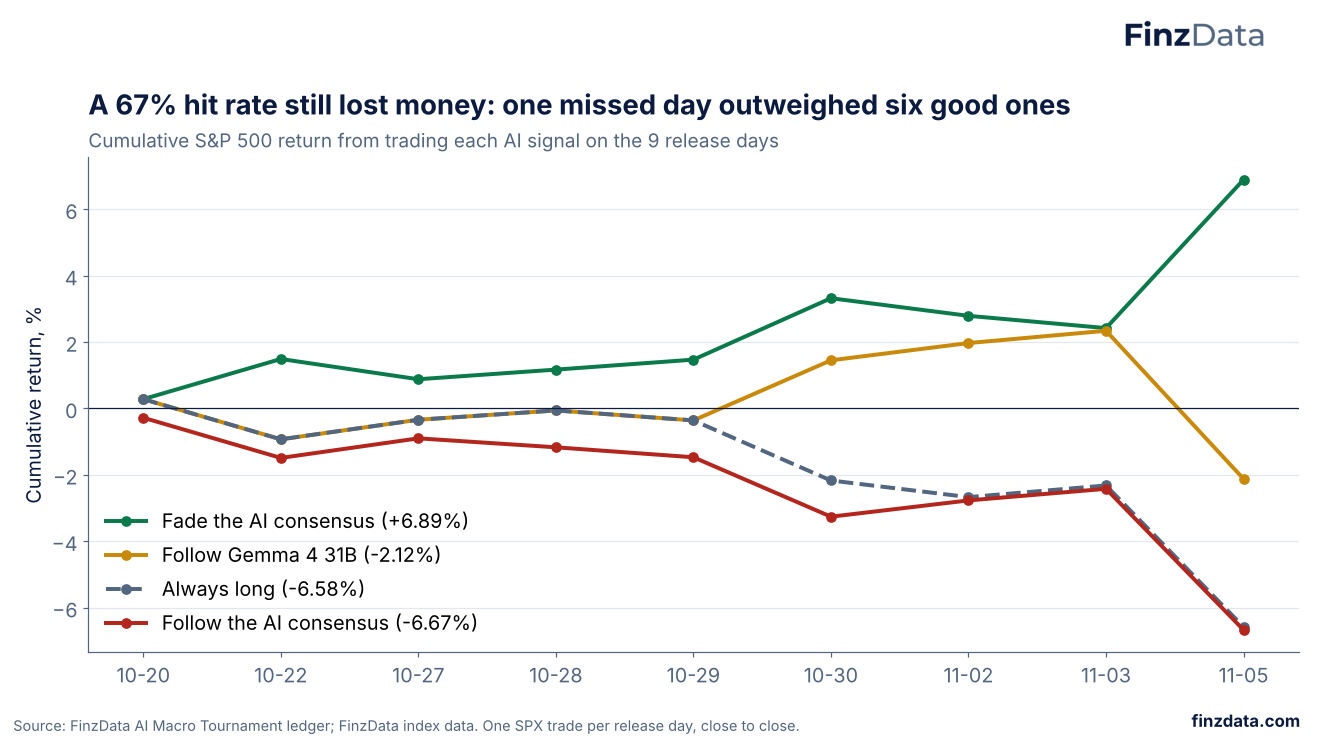
Hit rate is not profit. Trading the S&P 500 close to close in the direction of each signal on the nine release days: following the AI consensus lost -6.67%, always long lost -6.58%, and fading the consensus gained 6.89%. Gemma 4 31B, the leader on hit rate, finished -2.12%: it was up 2.34% after eight calls, six of them right, and gave it all back on November 5. One tail day outweighed six correct calls, which is why size matters as much as direction.
8. The models herd
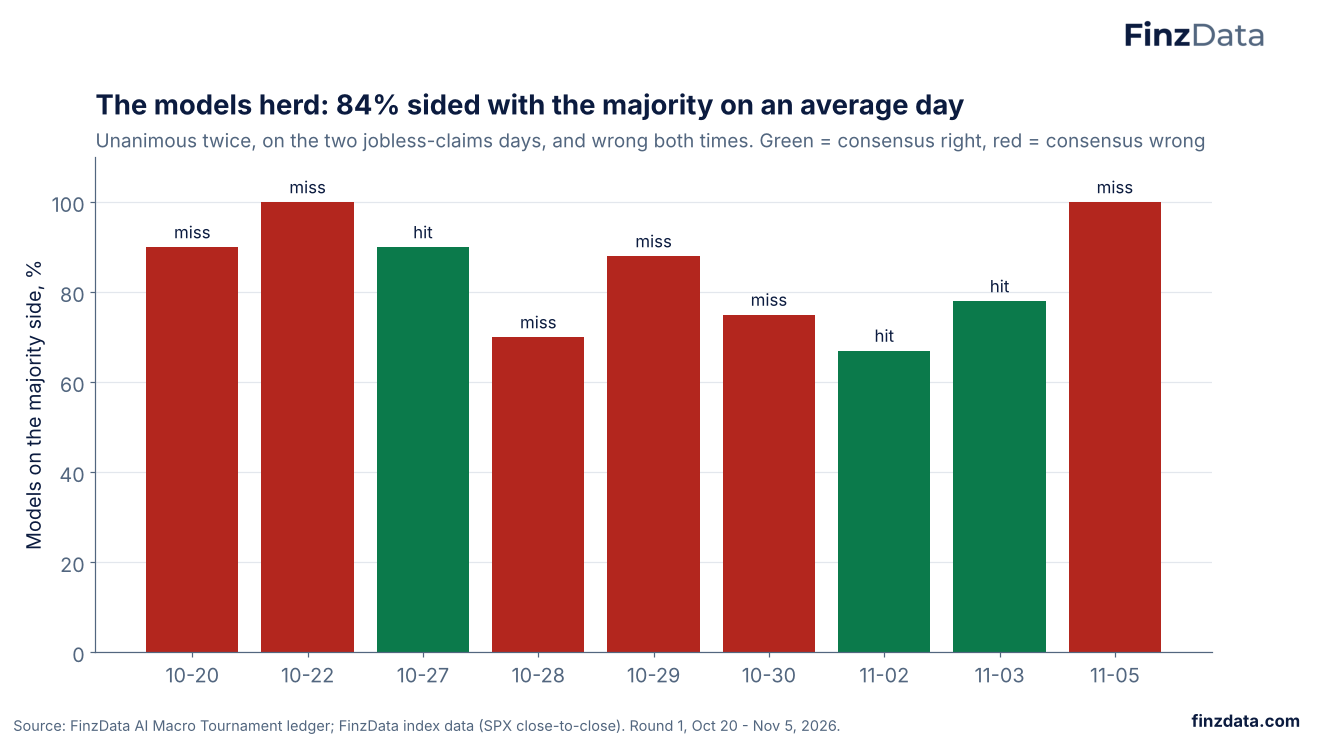
On an average day 84% of the models sat on the same side. They were unanimous twice, both on jobless-claims days, and both unanimous calls missed. The reason is visible in the models' own notes: most of them cite the same statistic, the share of past release days that closed higher. Models that read the same history reach the same answer, so the agreement adds no information.
9. Four models made the same call on every shared day
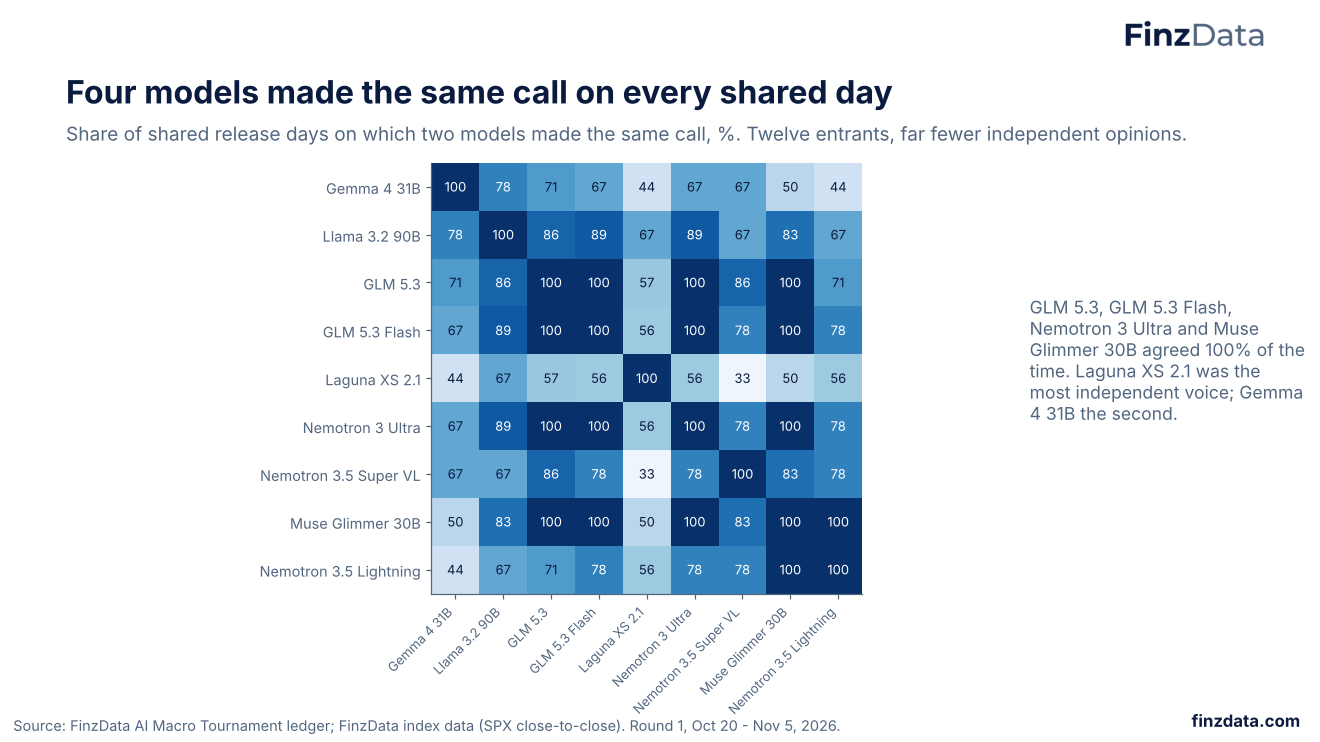
The matrix shows how often each pair of models made the same call on the days both took part. GLM 5.3, GLM 5.3 Flash, Nemotron 3 Ultra and Muse Glimmer 30B agreed every time: four entrants, one opinion. Laguna XS 2.1 sided with the majority on only 56% of days and Gemma 4 31B on 67%, the two most independent voices. For anyone building a model ensemble, the lesson is that different model names do not mean different views when the inputs are the same.
10. What the models cited
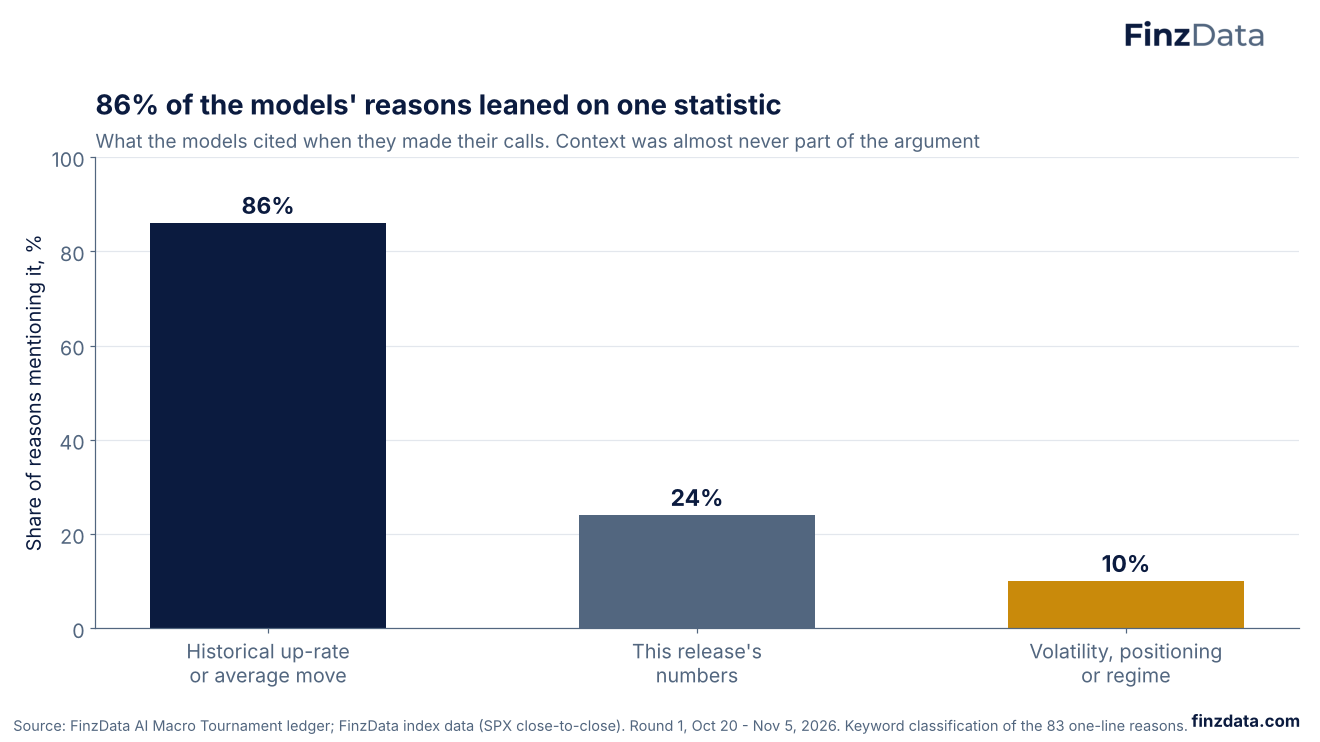
We classified all 83 one-line reasons. 86% leaned on a historical up-day rate or average move. 24% referred to the release's own numbers, such as the level of claims. Only 10% mentioned volatility, positioning or regime. The models were given the history and used it; almost none of them asked what the market looked like the night before.
11. 26 years of release days
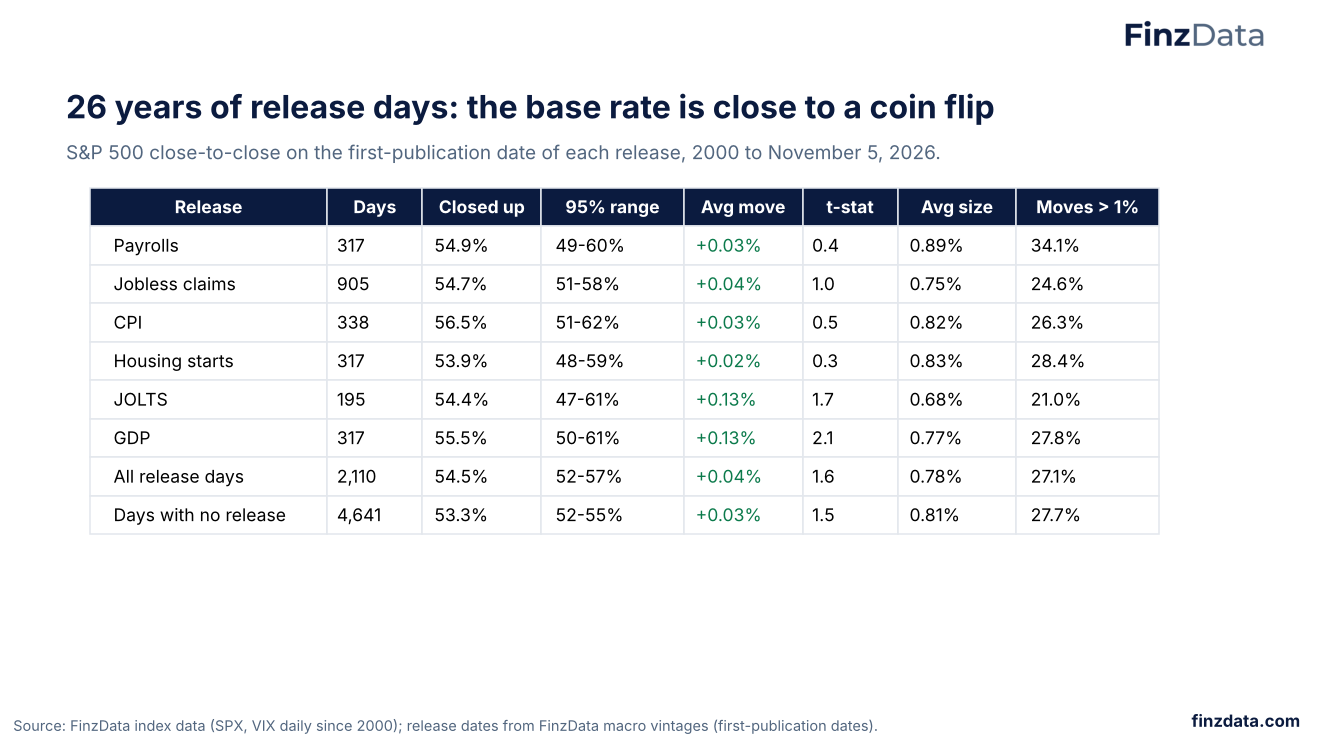
We rebuilt the models' core statistic over the full history. Using the first-publication date of every release in FinzData macro vintages, the S&P 500 closed up on 54.9% of 317 payroll days, 54.7% of 905 claims days and 56.5% of 338 CPI days. Days with no release closed up 53.3% of the time. Only GDP days show a mean return that clears a t-stat of 2 (+0.13%, t = 2.14), and even that is small next to an average move of 0.77%. Release days are not quieter either: 27.1% of them moved more than 1%, against 27.7% of other days.
12. The base rate moves with the lookback
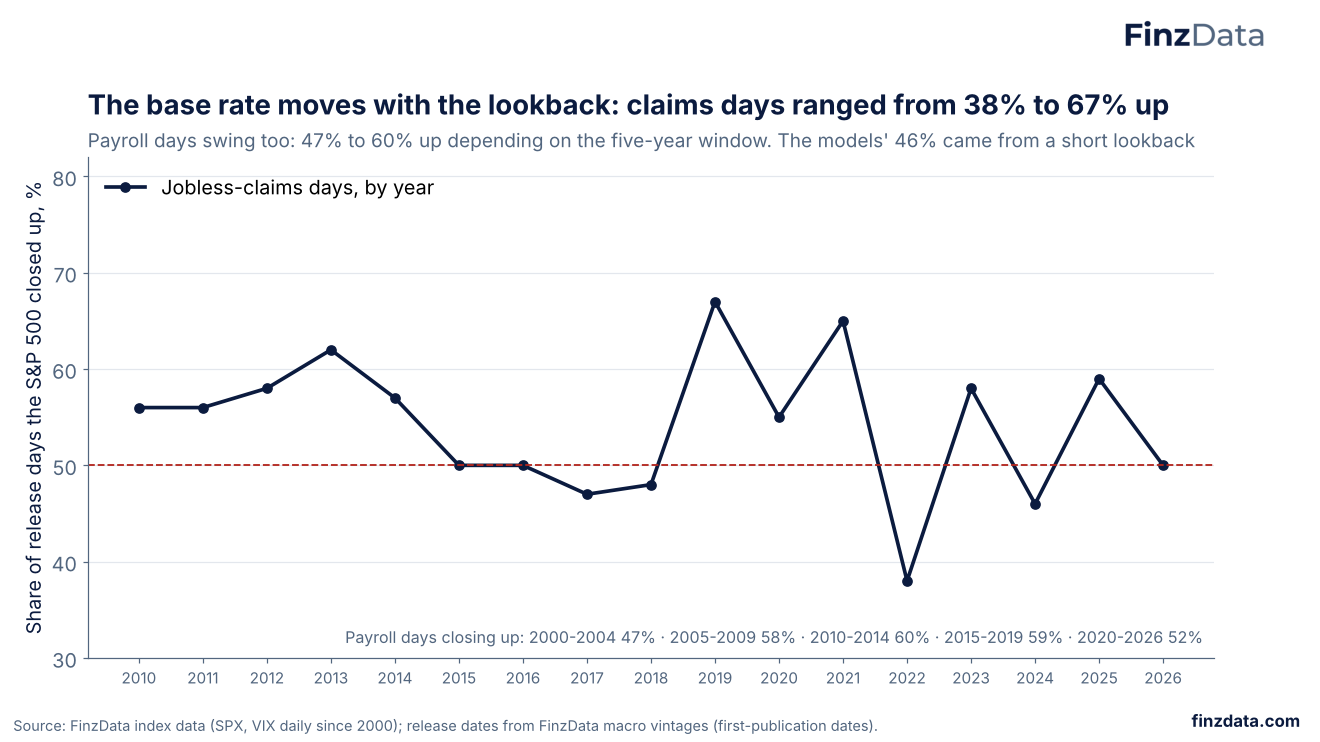
A base rate is only as stable as its window. The share of claims days that closed up ranged from 38% (2022) to 67% (2019). Payroll days closed up 47% of the time in 2000-2004 and 60% in 2010-2014. The models' payroll figure of 46% came from a short recent window; over all 317 payroll days since 2000 the rate is 54.9%. Change the lookback and the same method flips the call, a sign there was no signal to begin with.
13. The VIX told you the size
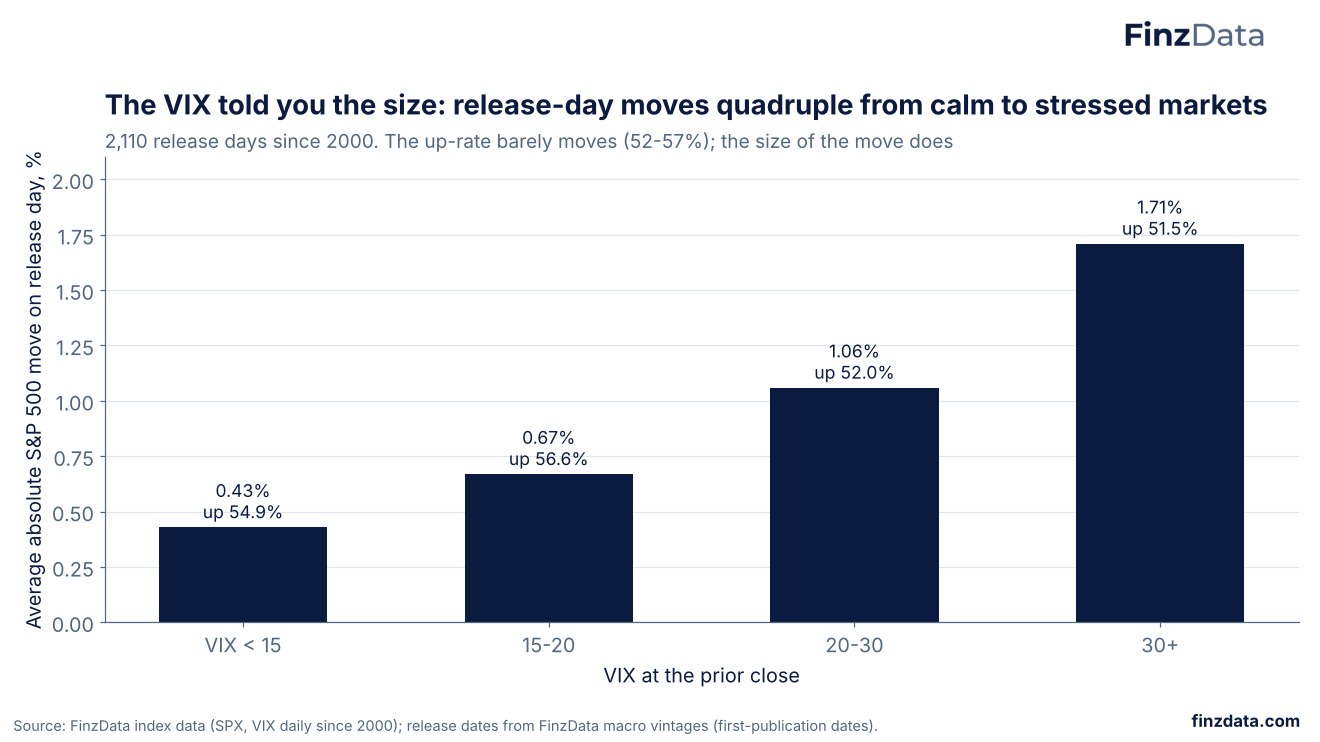
Sorting 2,110 release days by the VIX at the prior close shows where the information is. Below 15, the average release-day move was 0.43%; between 20 and 30 it was 1.06%; above 30 it was 1.71%. The up-rate barely changes, from 51.5% to 56.6%. Volatility regimes tell you how big the day can be, not which way it will go.
14. Dealer gamma doubles the release-day move
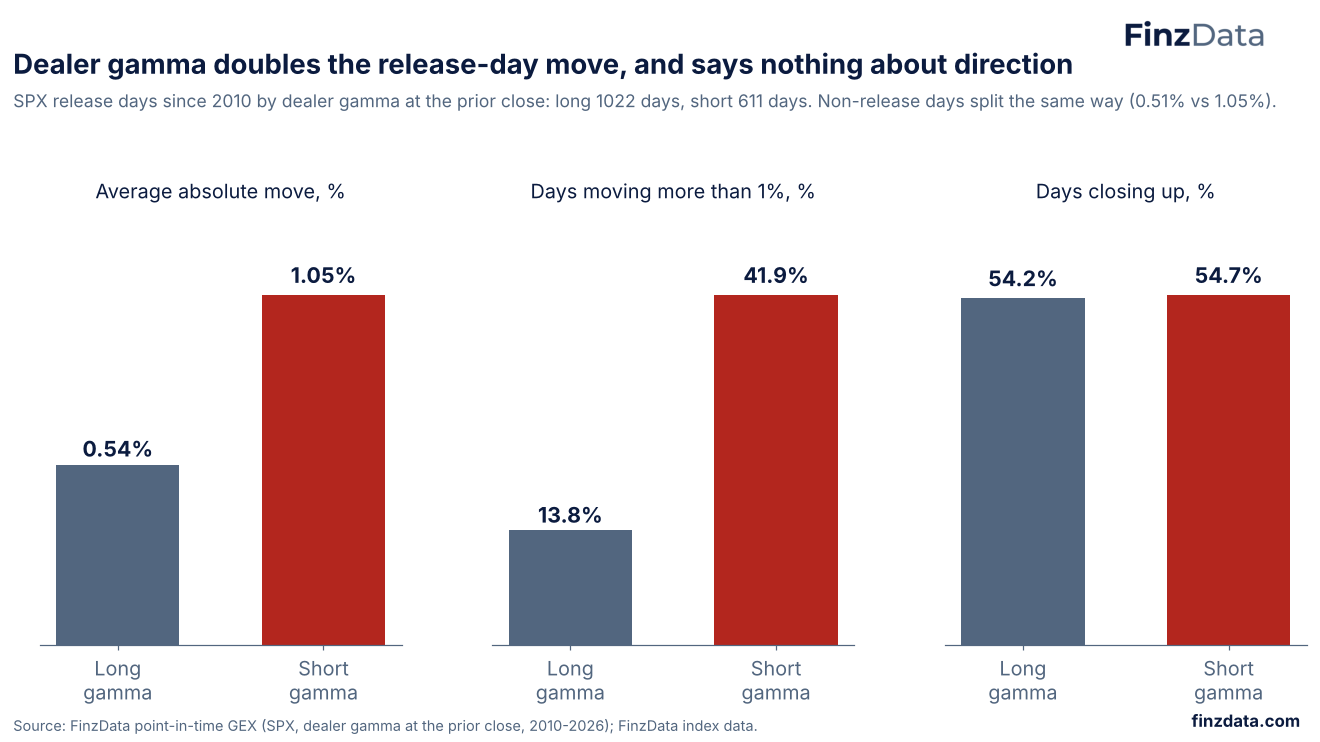
FinzData's point-in-time GEX records whether options dealers were long or short gamma at each close since 2010. On 611 release days that followed a short-gamma close, the S&P 500 moved 1.05% on average and 41.9% of days moved more than 1%. After a long-gamma close: 0.54% and 13.8%. The up-rate is the same in both (54.2% and 54.7%). Non-release days split the same way, so gamma sets the size of every day, release or not. It is a risk input, not a direction call.
15. The options market priced release days right
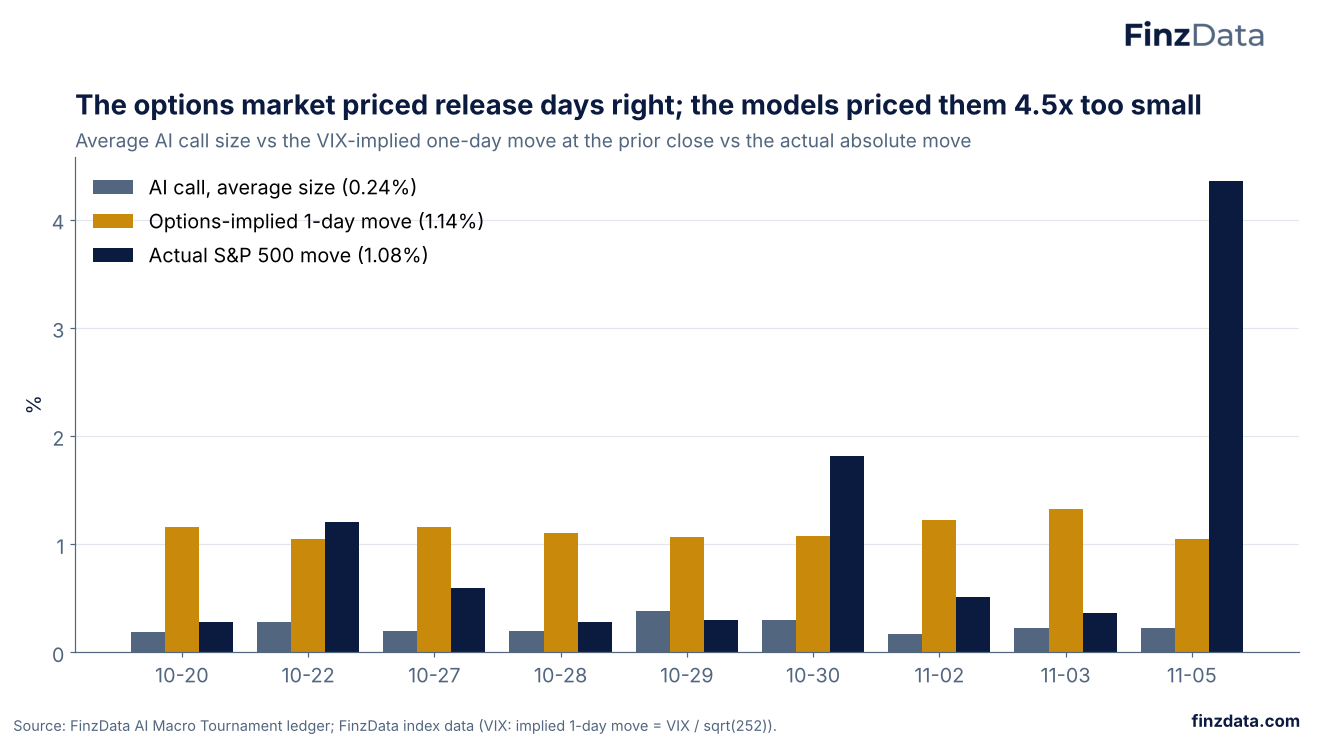
The VIX at the prior close implies a one-day move (one standard deviation) of VIX divided by the square root of 252. Over Round 1 that averaged 1.14%. The models' calls averaged 0.24% and the market's actual moves averaged 1.08%. The options market had the size right; the models priced release days 4.5x too small because the historical average move hides the tail days.
16. Confidence did not mean accuracy
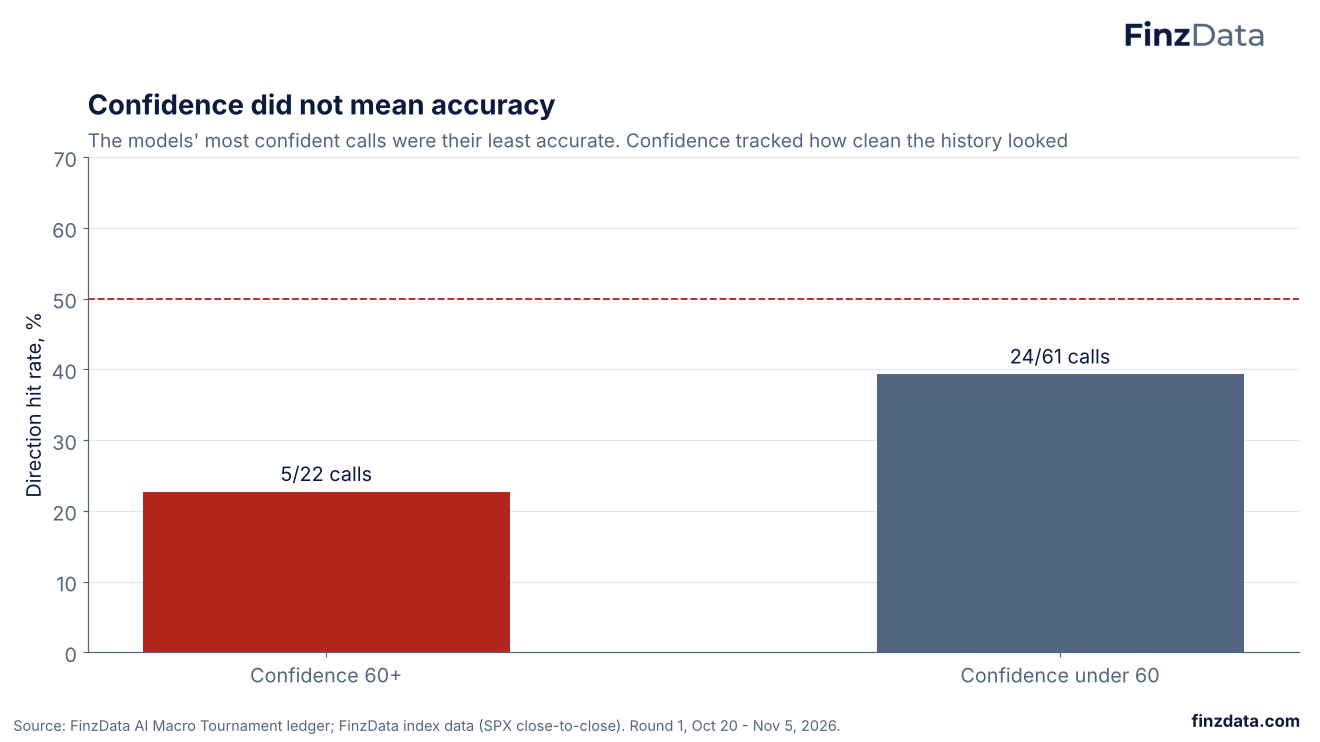
Calls made with 60% confidence or more were right 5 times out of 22. Calls under 60% were right 24 times out of 61. The models' confidence tracked how strong the historical pattern looked, not how well it would hold on the day.
17. November 5: the tail nothing priced
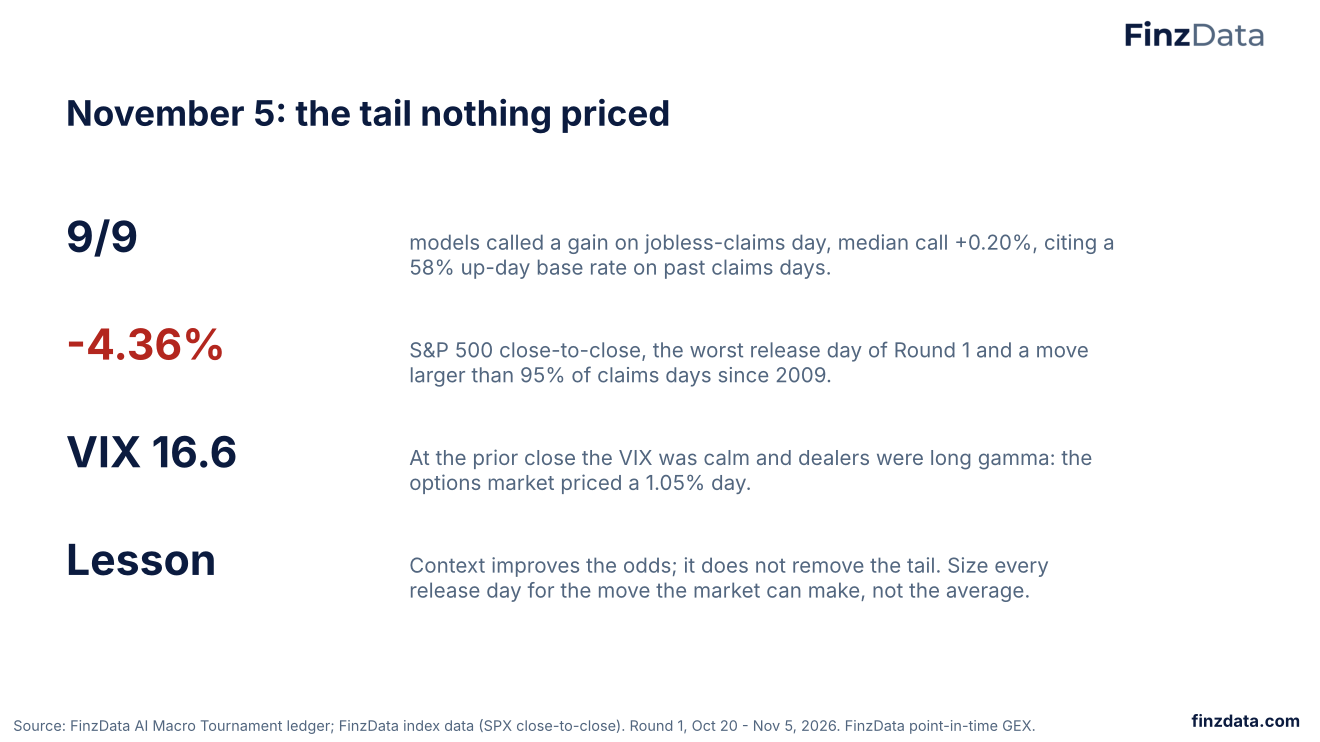
All nine models called a gain on November 5, a jobless-claims day, with a median call of +0.20%. The S&P 500 closed down 4.36%, worse than 95% of the 905 claims days since 2009. Context would not have flagged it: at the prior close the VIX was 16.61, dealers were long gamma and the options market priced a 1.05% day. Context raises the odds of sizing a day correctly; it does not remove the tail. That is why every release day should be sized for the move the market can make, not the average.
18. Today: payrolls, and nine bearish calls
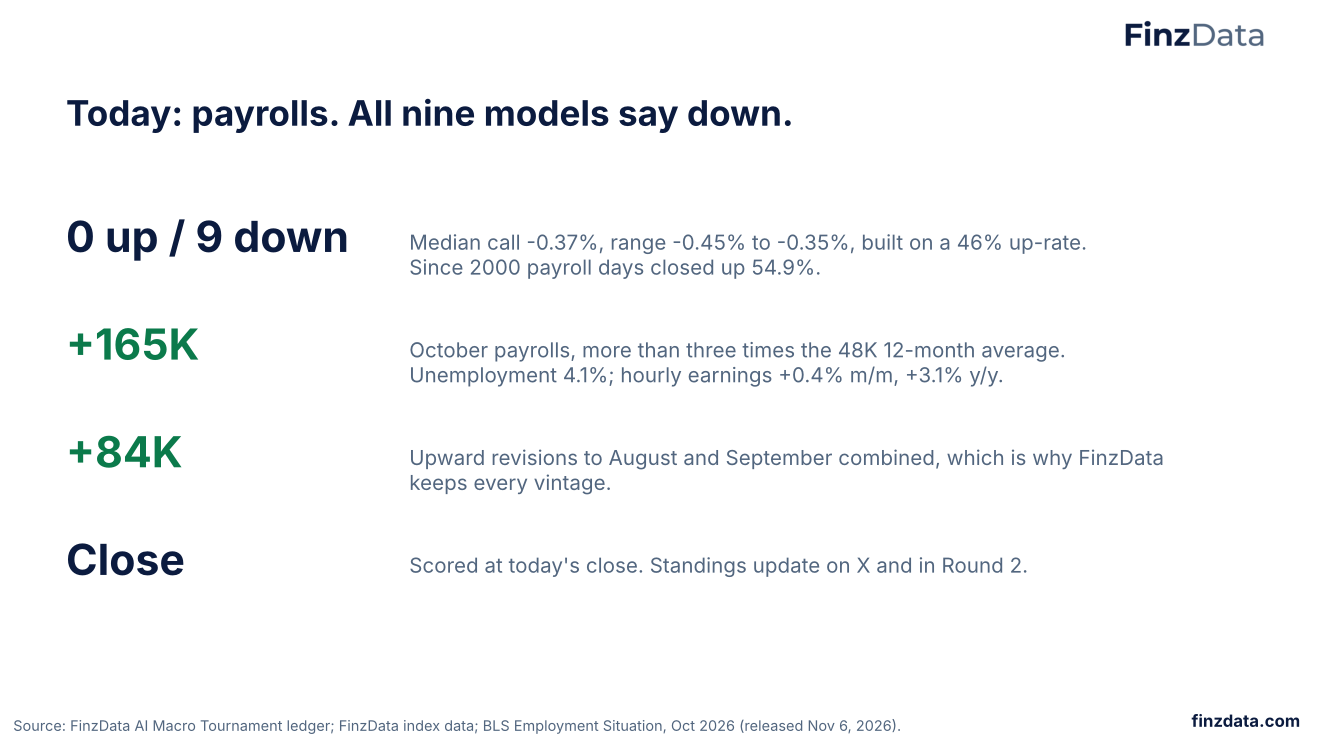
For today's October jobs report all nine models called the S&P 500 lower, with a median call of -0.37% and a range of -0.45% to -0.35%. Their reason: only 46% of past payroll days closed higher, a figure from a short window; since 2000 payroll days closed up 54.9% of the time. The print was strong: +165,000 jobs, more than three times the 48,000 12-month average, unemployment at 4.1%, and average hourly earnings up 0.4% on the month and 3.1% on the year. August and September were revised up by a combined 84,000, which is why FinzData keeps every vintage of every macro series. The call is scored at today's close.
19. Our read: a release-day playbook
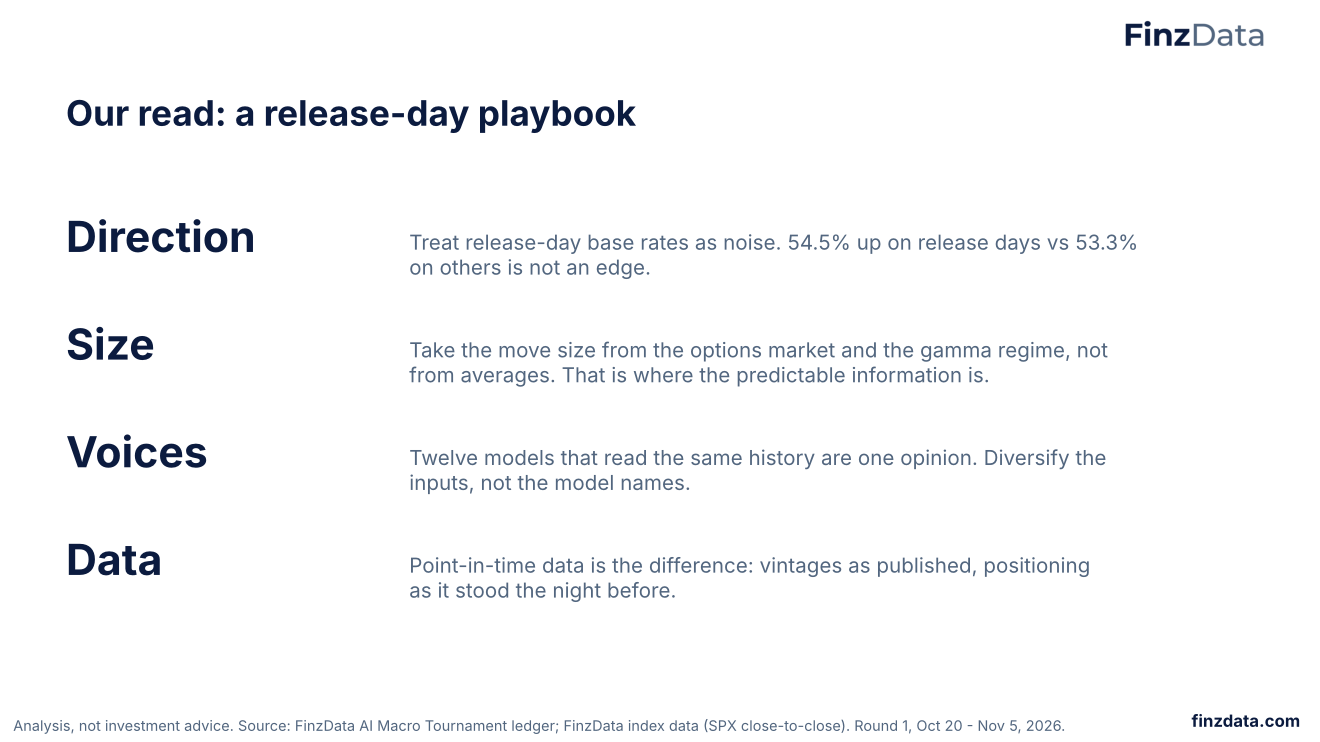
- Direction: treat release-day base rates as noise. 54.5% up on release days versus 53.3% on other days is not an edge.
- Size: take the size of the move from the options market and the gamma regime. That is where the predictable information is.
- Voices: twelve models that read the same history are one opinion. Diversify the inputs, not the model names.
- Data: point-in-time data is the difference: vintages as published, positioning as it stood the night before.
Analysis, not investment advice.
20. Round 2: what changes
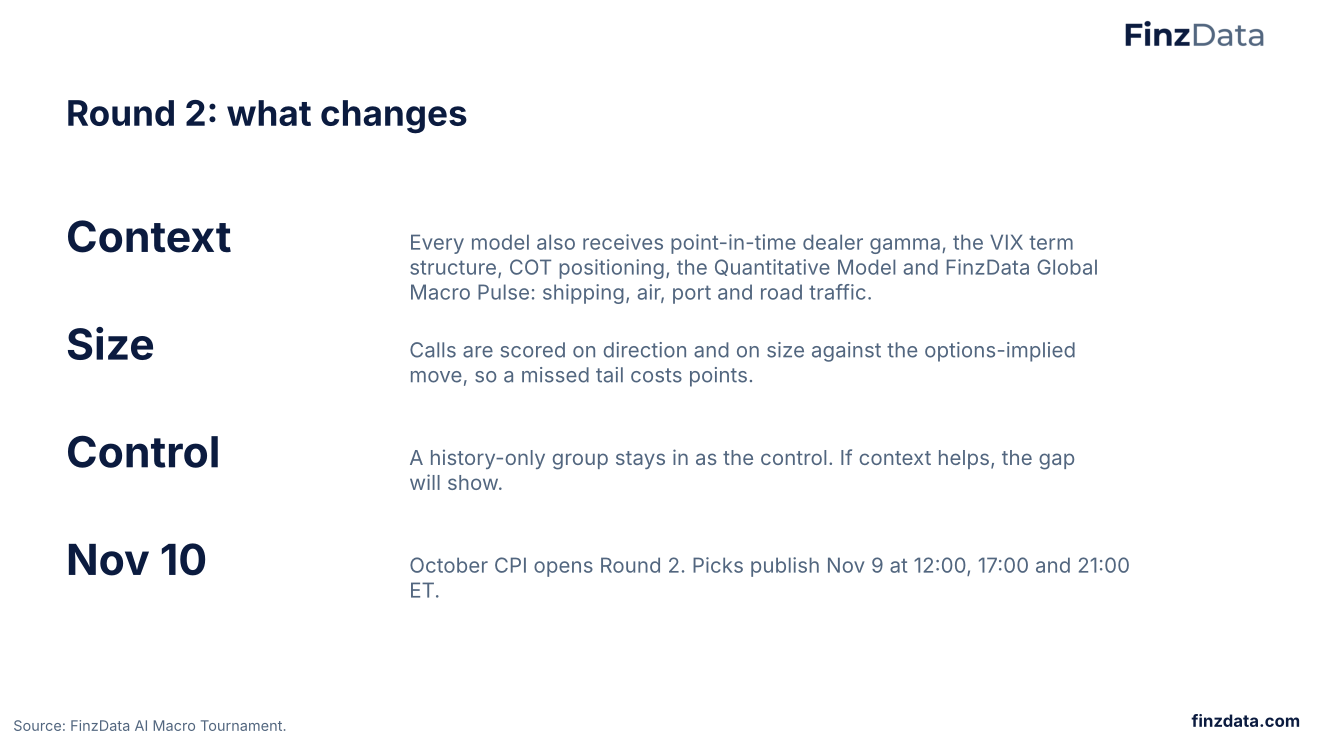
Round 2 puts the Round 1 findings to the test. Every model will also receive point-in-time dealer gamma, the VIX term structure, COT positioning, the FinzData Quantitative Model and FinzData Global Macro Pulse: daily ship transits through 28 chokepoints including Suez, Hormuz and Panama, global flights, port calls and New York congestion-zone traffic, each against a year earlier. The real economy, measured daily, next to the market's own positioning. Calls will be scored on direction and on size against the options-implied move, so missing a tail costs points. A history-only group stays in as the control: if context helps, the gap between the two groups will show. Round 2 opens with October CPI on November 10.
21. Methodology and caveats
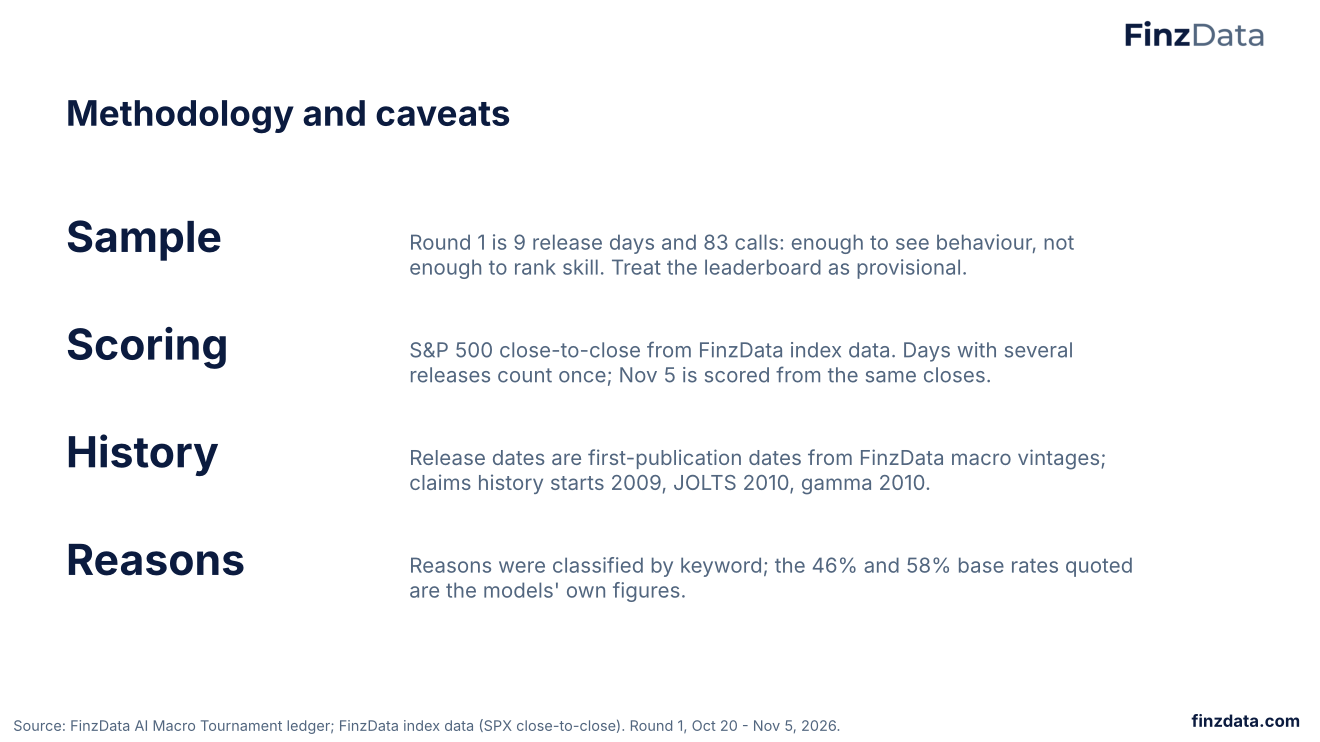
- Sample: Round 1 has 9 release days and 83 calls: enough to see behaviour, not enough to rank skill.
- Scoring: S&P 500 close-to-close from FinzData index data. Days with several releases count once.
- History: release dates are first-publication dates from FinzData macro vintages, from 2000 (claims from 2009, JOLTS from 2010); dealer gamma is FinzData point-in-time GEX for SPX from 2010, taken at the prior close.
- Implied move: VIX / sqrt(252), one standard deviation.
- Reasons: classified by keyword. The 46% and 58% base rates quoted are the models' own figures.
22. What to watch
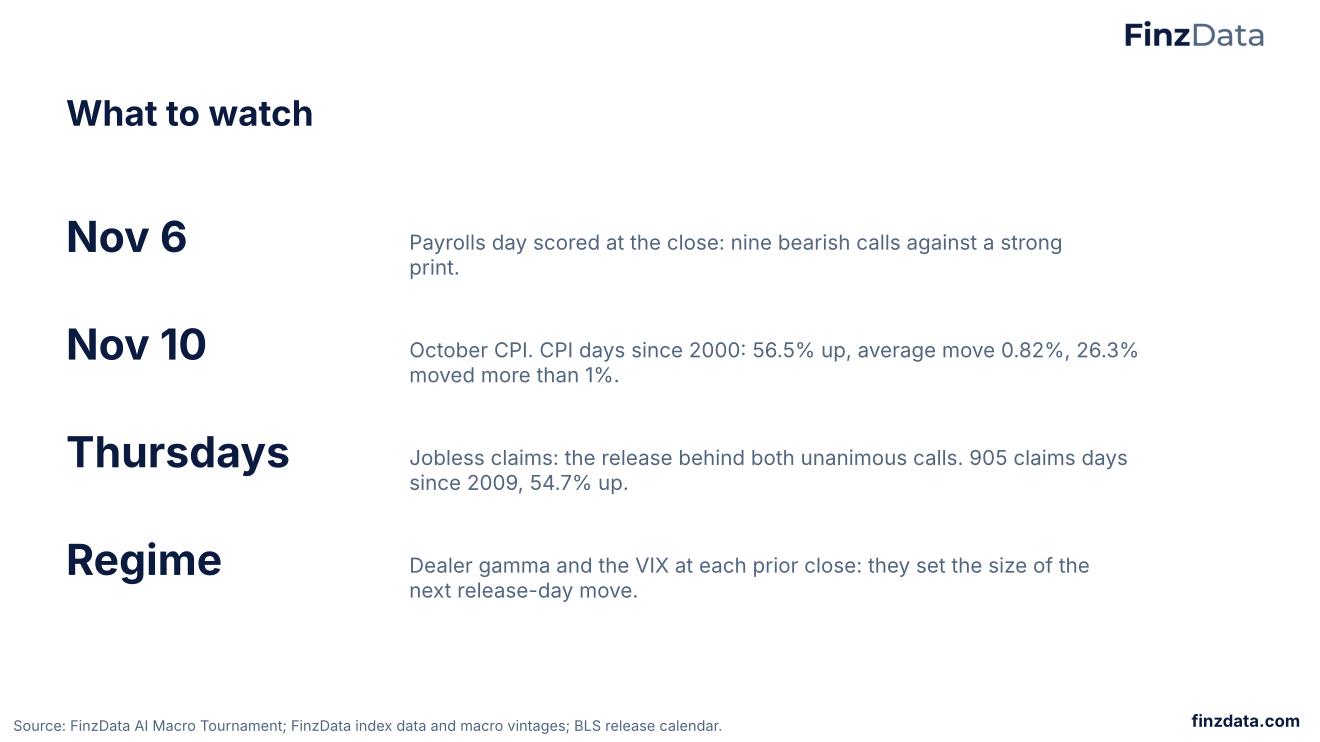
- November 6: payrolls day is scored at the close.
- November 10: October CPI opens Round 2. CPI days since 2000 closed up 56.5% of the time with an average move of 0.82%; 26.3% moved more than 1%. Picks publish November 9 at 12:00, 17:00 and 21:00 ET.
- Every Thursday: jobless claims, the release behind both unanimous calls.
- Every close: dealer gamma and the VIX, which set the size of the next release-day move.
23. The data behind this deck
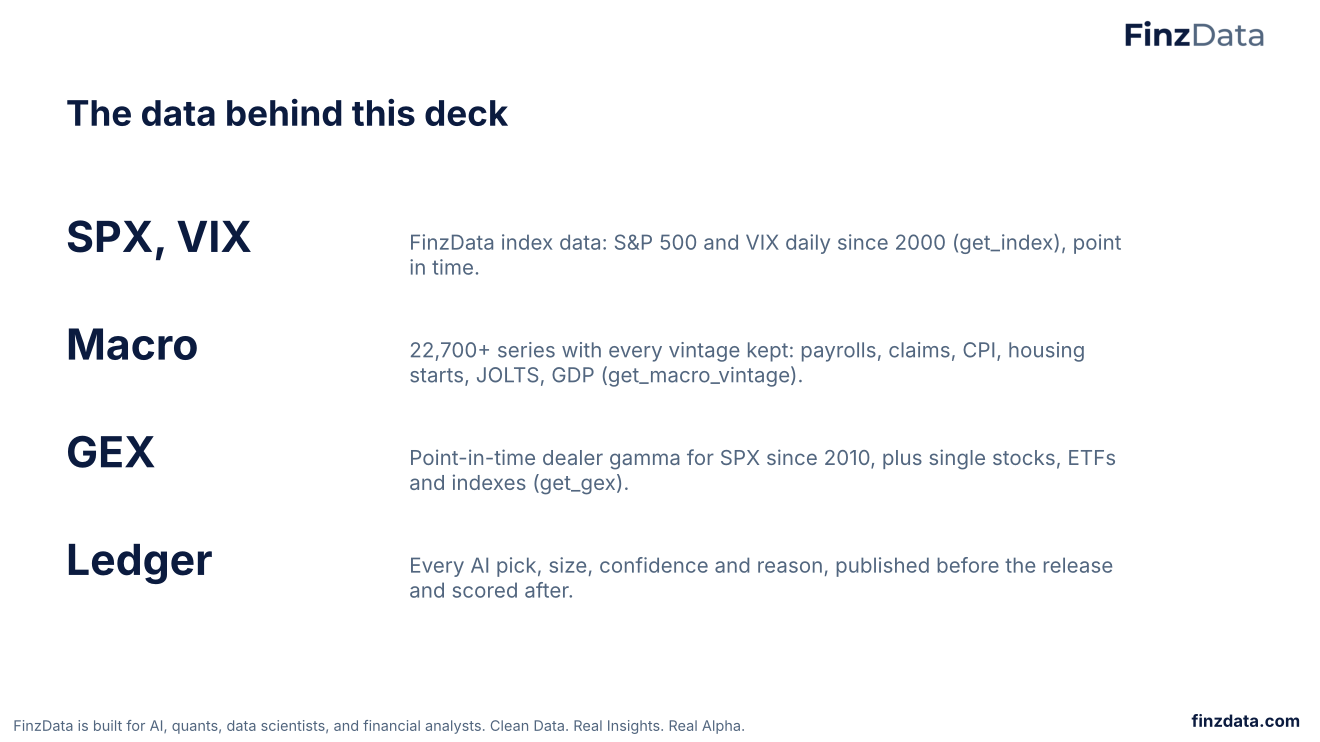
S&P 500 and VIX daily closes since 2000 from FinzData index data (get_index). Release dates and values from FinzData macro data: 22,700+ series with every vintage kept (get_macro_vintage). Dealer gamma from FinzData point-in-time GEX for SPX since 2010, plus single stocks, ETFs and the major indexes (get_gex). Every model can reach the same data in Claude, ChatGPT and Grok through the FinzData connector, or with pip install finzdata.
Frequently asked questions
What is the FinzData AI Macro Tournament?
A standing contest in which AI models call the S&P 500's direction the day before each US economic release, after backtesting past release days on FinzData data. Picks are published before the release and scored at the close.
Which AI model is winning?
After Round 1 (October 20 to November 5, 2026), Gemma 4 31B leads with 6 correct calls out of 9 release days.
How are calls scored?
A call is a hit when its direction matches the S&P 500's close-to-close move on release day, using FinzData index data.
Can I run the same backtest?
Yes. The S&P 500, every vintage of every US macro series, GEX and COT are all on FinzData, through the API, pip install finzdata, or the FinzData connector for Claude, ChatGPT and Grok.
Is this investment advice?
No. It is research on how AI models forecast markets. Nothing here is a recommendation to buy or sell anything.
Do economic releases predict the S&P 500's direction?
Not on their own. Since 2000 the S&P 500 closed up on 54.5% of 2,110 release days and 53.3% of other days. The up-rate also drifts with the lookback window.
What does predict the size of a release-day move?
The volatility regime. Release days after a VIX close below 15 moved 0.43% on average; above 30, 1.71%. After a short-gamma close, moves averaged 1.05% vs 0.54% after a long-gamma close.
Download the deck (PDF, 23 slides) More research
Built for AI, quants, data scientists and financial analysts who backtest. Clean data. Real insights. Real alpha. finzdata.com. This material is for information only and is not investment advice. Data sources: FinzData AI Macro Tournament ledger; FinzData index data (SPX); BLS Employment Situation, October 2026 (released November 6, 2026).
Get FinzData research free, every morning
The daily brief: what moved, the macro releases that matter, positioning and liquidity, with charts. One email a day, free, unsubscribe anytime.