FinzData Research · Published 28 October 2026
Ships Move Before Prices Print: Strait of Hormuz Traffic and Global Shipping Data, 2019–2026
Ship transits through the Strait of Hormuz fell 92% after the 2026 closure, Saudi crude found a Red Sea exit, and the Red Sea route never came back. FinzData Nautical turns that traffic into clean, point-in-time data you can backtest.
Get FinzData research free, every morning
The daily brief: what moved, the macro releases that matter, positioning and liquidity, with charts. One email a day, free, unsubscribe anytime.
Contents
- Five things the shipping data saw first
- Physical trade, measured daily and stored as it was known
- The 2026 closure, read straight off the data
- Gulf terminals emptied; ports outside Hormuz took the trade
- The bypass, then the dark: why raw AIS needs a second source
- Two shipping shocks, opposite winners
- Two years of rerouting around Africa, in three lines
- A quieter collapse the headlines have not explained
- Every trade lane, scored the same way every week
- A drought you could trade, before the headlines
- China’s ports slowed; Europe and the US held
- Chokepoint traffic peaked in 2023 and is falling
- Fewer ships, bigger ships: count and tonnage diverge
- Coincident, not predictive: the edge is speed and context
- 27,386 vessels in a single day, refreshed every 15 minutes
- Where the fleet sits, and how much of it is waiting
- Five series, one point-in-time contract
- A backtest sees only what was knowable that day
- Four questions the data answers before the market does
- From raw radio messages to a clean daily series
- The limits, stated plainly
- Put the world’s shipping lanes beside your prices
- Frequently asked questions
Is the Strait of Hormuz open? What the traffic says
Barely. In the year to February 2026, an average of 82.9 ships a day passed through the Strait of Hormuz. From 7 March 2026 the average has been 6.3, a fall of 92%. Tankers, the ships that carry about a fifth of the world’s oil, went from 46.5 transits a day to 2.5. In the week to 18 October 2026, Hormuz traffic was still 96% below the same week a year earlier.
FinzData Nautical reads that answer straight off the data, the day it happens, not from headlines. Our series lines up with independent counts: Kpler reported roughly six to eleven commodity vessels a day crossing in August 2026, and S&P Global and gCaptain dated the closure to late February. The full 23-slide research deck and the PDF are on this page, and early access is open at finzdata.com.
Strait of Hormuz traffic, port by port
A chokepoint count tells you a strait shut. Port data tells you who lost and who won. Comparing 7 March to 16 October 2026 with the twelve months before the closure:
- Inside the Gulf, terminals emptied. Kuwait’s Mina Al Ahmadi exports fell 96%, Saudi Arabia’s Ras Tanura 88%, Qatar’s Ras Laffan 82%. Jebel Ali, the region’s container hub, saw port calls fall 85%.
- Outside the strait, trade found another door. Saudi exports from Yanbu on the Red Sea rose 123%, carried there by the East-West pipeline. Oman’s Salalah gained 26% and Duqm’s port calls rose 70%.
- In between, Fujairah fell 53% and Sohar’s calls 27%, even though both sit outside Hormuz.
Yanbu is the clearest story. Its exports climbed from 146,000 tonnes a day to an average of 576,000 in June and July 2026, about 4.2 million barrels a day, in line with Signal Ocean’s 4.7 million reported by Reuters on 13 July.
When ships go dark: the limit of AIS data
Then the Yanbu count fell to almost nothing in August. Loadings had not stopped: on 3 August, reporting had five very large crude carriers at the terminal. What appears to have stopped was the signal: the same reporting had tankers carrying Yanbu crude through the Red Sea with their AIS transponders switched off, and when ships go dark, every count built from AIS data goes blind with them. That is why FinzData Nautical marks those gaps instead of publishing zeros, and why our pipeline detects long silences between a ship’s messages as events in their own right.
What the Hormuz closure did to oil and tanker stocks
In the 20 trading days after 27 February 2026, Brent rose 55% and WTI 49%. Energy stocks (XLE) gained 12%. Tanker owners fell: Frontline 11%, DHT 7%, Teekay Tankers 7%, Scorpio Tankers 4%, International Seaways 3%. The S&P 500 (SPY) fell 8%.
That looks backwards until you compare it with the Red Sea. After the diversions began in December 2023, the same tanker stocks rose 9% to 16% in 20 trading days and the container line ZIM rose 44%, while Brent moved only 2%. A closure removes cargoes; a detour makes every voyage longer and needs more ships. The traffic data tells the two apart, and that difference, not the headline, is what moved the price.
| 20 trading days after | Brent | Tanker stocks | ZIM |
|---|---|---|---|
| Hormuz closure, 27 Feb 2026 | +55% | −3% to −11% | −9% |
| Red Sea diversions, 15 Dec 2023 | +2% | +9% to +16% | +44% |
Two events are an illustration, not a statistical result, and we present them that way.
Red Sea shipping and Suez Canal traffic, three years on
Before the attacks, Bab el-Mandeb at the southern end of the Red Sea carried 74.6 ships a day and the Suez Canal 73.6. In 2024 they fell to 32.5 and 39.6, while the Cape of Good Hope rose from 48.9 to 87.0. The route has not come back: over the last 90 days Bab el-Mandeb averaged 27.6 transits a day, Suez 41.5 and the Cape 88.1.
Bosphorus shipping: a quieter collapse
The Bosporus carried about 92 ships a day in April 2026 and about 50 in September and October; tankers fell from 23 a day to 14. Turkish figures showed only a 1.7% decline for the first quarter, and we have found no published explanation for the slide since June. We do not guess one. A break like this is exactly what the dataset’s weekly scorecard is built to surface first.
Panama Canal traffic and every other lane
The Panama Canal averaged 33.4 transits a day in 2022, fell to 21.5 at the low of the 2023–24 drought restrictions, and has averaged 28.3 over the last 90 days. Every week FinzData Nautical scores all 28 chokepoints against their own level a year earlier. In the week to 18 October 2026 the sharpest falls were Hormuz (−96%), the Bosporus (−54%), Bab el-Mandeb (−29%) and Panama (−16%); the strongest gains were Mindoro (+76%), Luzon (+29%), the Taiwan Strait (+23%) and Makassar (+16%).
Port congestion and world hubs
Since March 2026, Shanghai’s port calls are down 22% and its exports 18%; Ningbo is down 12% and Singapore 5%. Rotterdam and Los Angeles–Long Beach are each up 2%. Corpus Christi, the main US crude export port, is up 13% on calls and 15% on exports. Where calls and tonnes diverge, cargo per ship is changing, and that is visible only when you carry both.
Fewer ships, bigger ships
Across all 28 chokepoints, traffic peaked at 2,069 transits a day in 2023 and has averaged 1,877 in 2026 so far, down 9%. Capacity fell less, from 63.4 to 60.9 million tonnes a day, because the average ship keeps growing: 27,100 tonnes of capacity per transit in 2019, 32,400 in 2026, up 20%. A model that only counts ships misreads trade.
Live ship tracking and vessel tracking
Alongside the IMF history, FinzData Nautical runs its own live AIS feed. On 26 October 2026 it saw 27,386 vessels and stored 975,525 positions. Twenty-four sea regions are scored daily, from the Persian Gulf and the Red Sea to the North Sea and Malacca, with the share of tankers at anchor or moored: the first place floating storage and port queues appear. Vessel search finds any ship by name, MMSI or IMO and draws its last two days of track. Terrestrial receivers see about 50 nautical miles offshore, so the open ocean and the Gulf come from the IMF layer instead.
Can shipping data predict oil prices?
We tested it against ourselves before a buyer could. Over about 400 weeks from March 2019, weekly changes in Hormuz tanker transits moved with Brent in the same week (t = −3.1). Measured one week after the IMF publishes, the link vanished (t = 0.6), and no other pair we tested was significant. The weekly series is coincident, not predictive. The edge is speed, from the live feed, and context: knowing a closure from a detour.
Point-in-time shipping data, built for backtests
Every row carries the moment we learned it. When the IMF revises a recent day, we keep the old value as a vintage and append the new one, so a backtest sees only what was knowable on its date. That is the same contract behind everything at FinzData: 16,000+ US stocks that have traded on NYSE and Nasdaq since January 2000, delisted included; 139 futures markets; point-in-time GEX; COT since 1986; and 18,000+ macro series with every vintage kept. FinzData is built for AI, quants, data scientists and financial analysts. Clean data. Real insights. Real alpha.
The FinzData team
1. Ships move before prices print
FinzData Research · Nautical
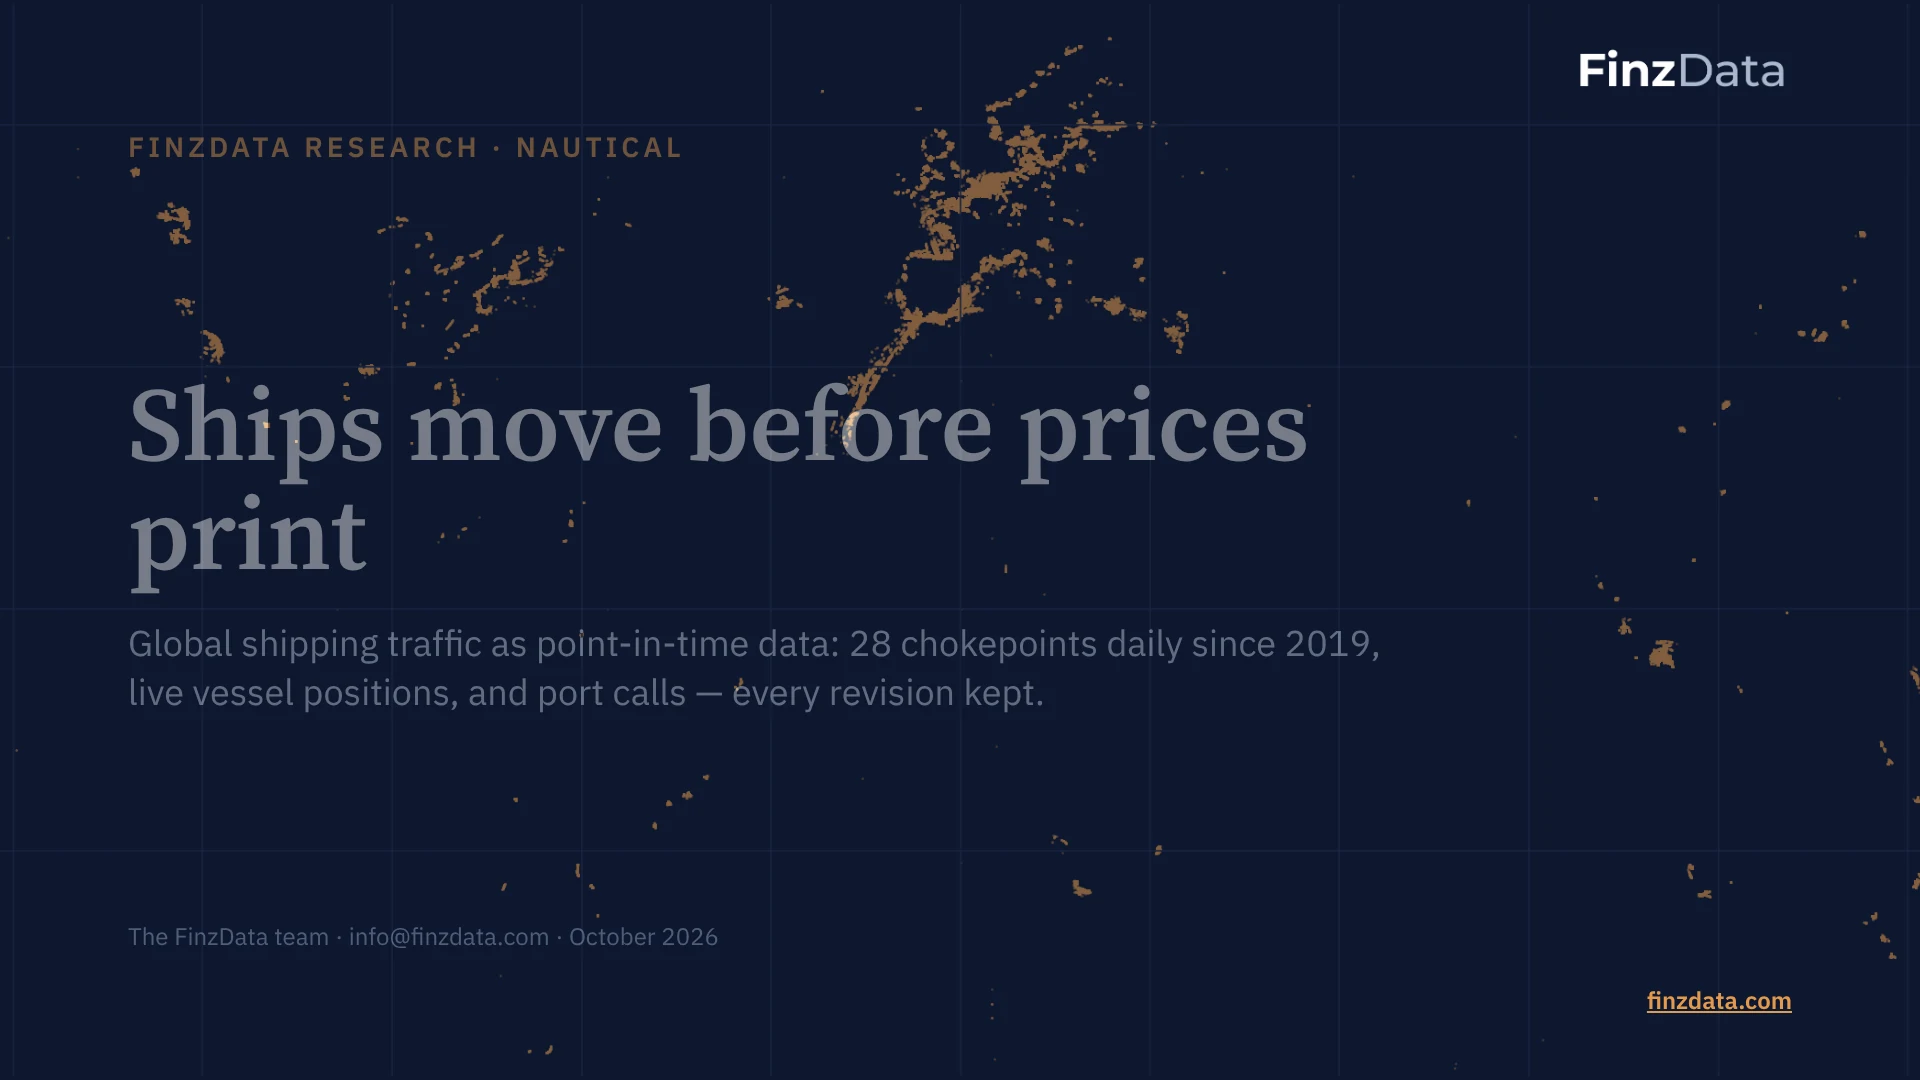
Ships move before prices print
FinzData Nautical turns raw vessel-tracking signals into clean, point-in-time series a quant can backtest without look-ahead. The background is one real day of live positions from our feed, 26 October 2026.
2. Five things the shipping data saw first
Executive summary
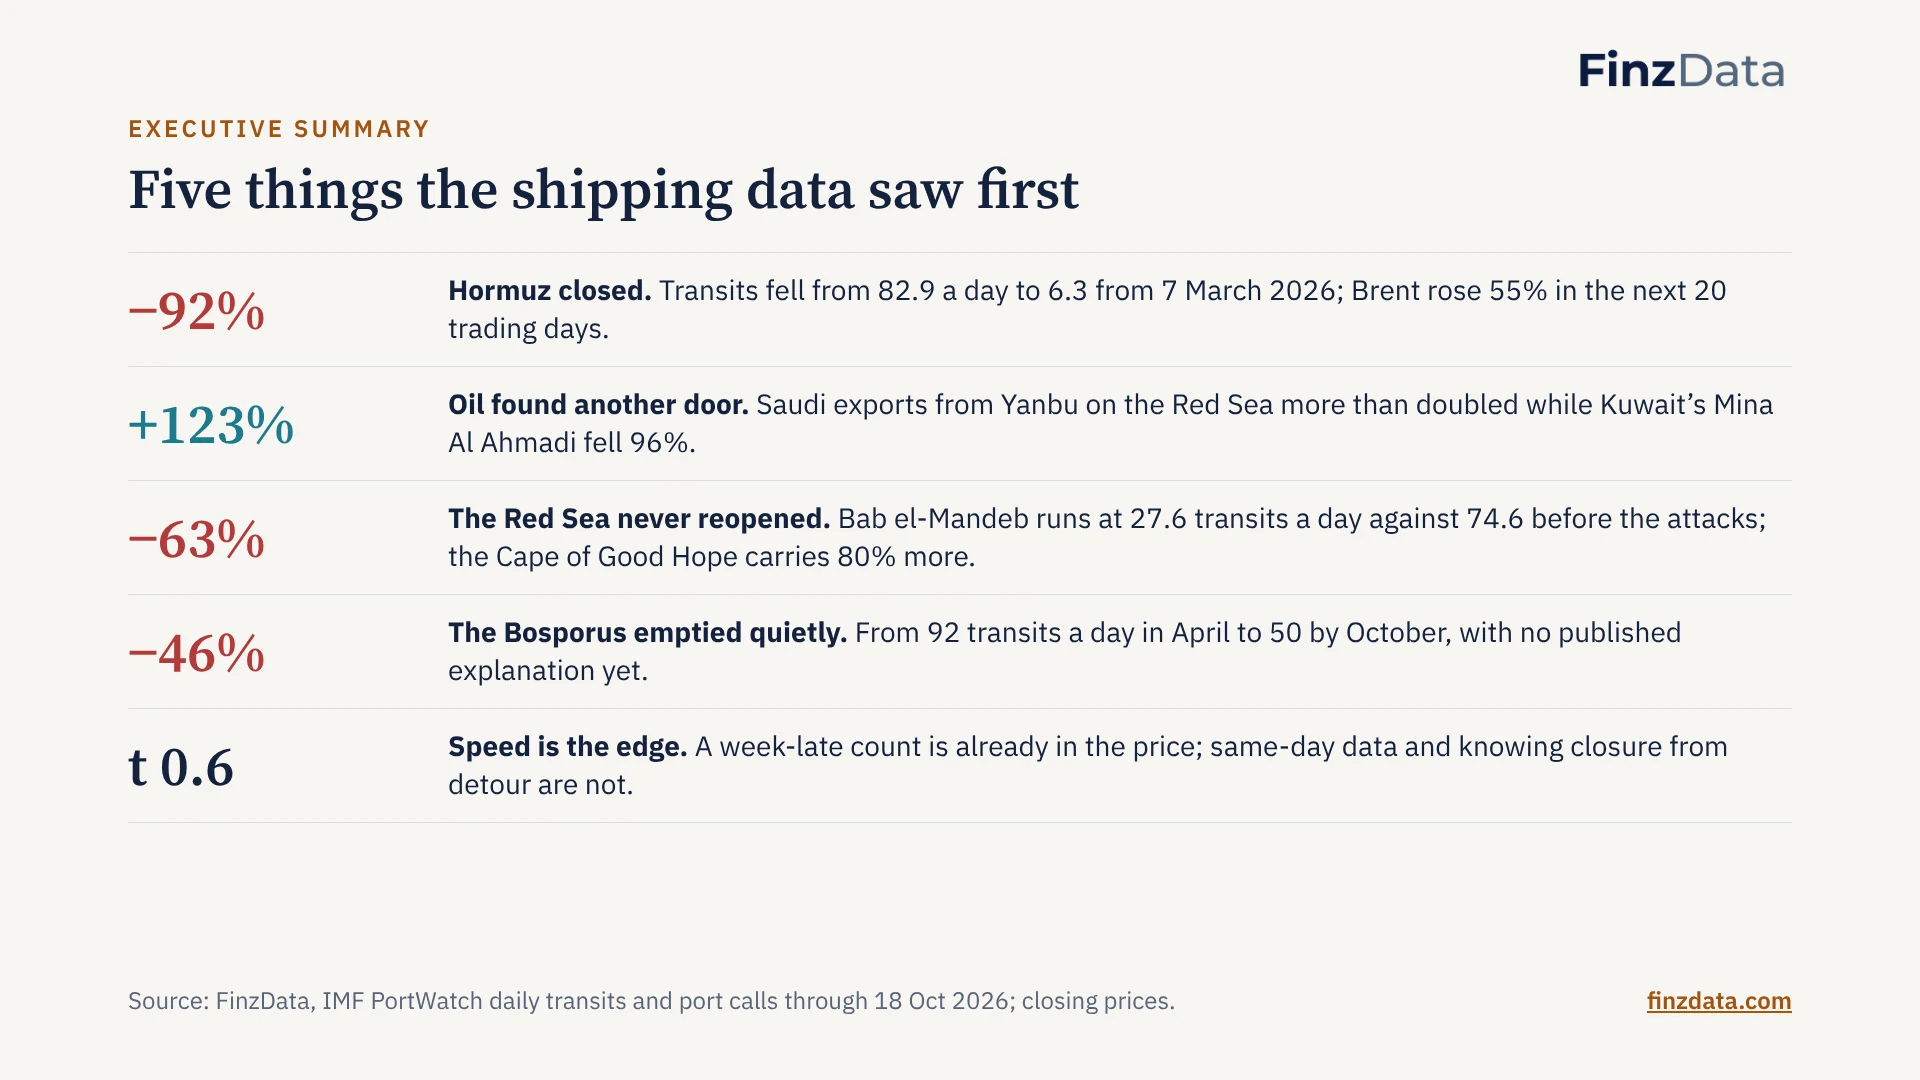
Five things the shipping data saw first
If a reader takes one slide away, it is this one. Each line is backed by a chart later in the deck. The fifth line is the honest one: the long history alone does not predict prices a week later, which is why the live layer exists.
3. Physical trade, measured daily and stored as it was known
What it is
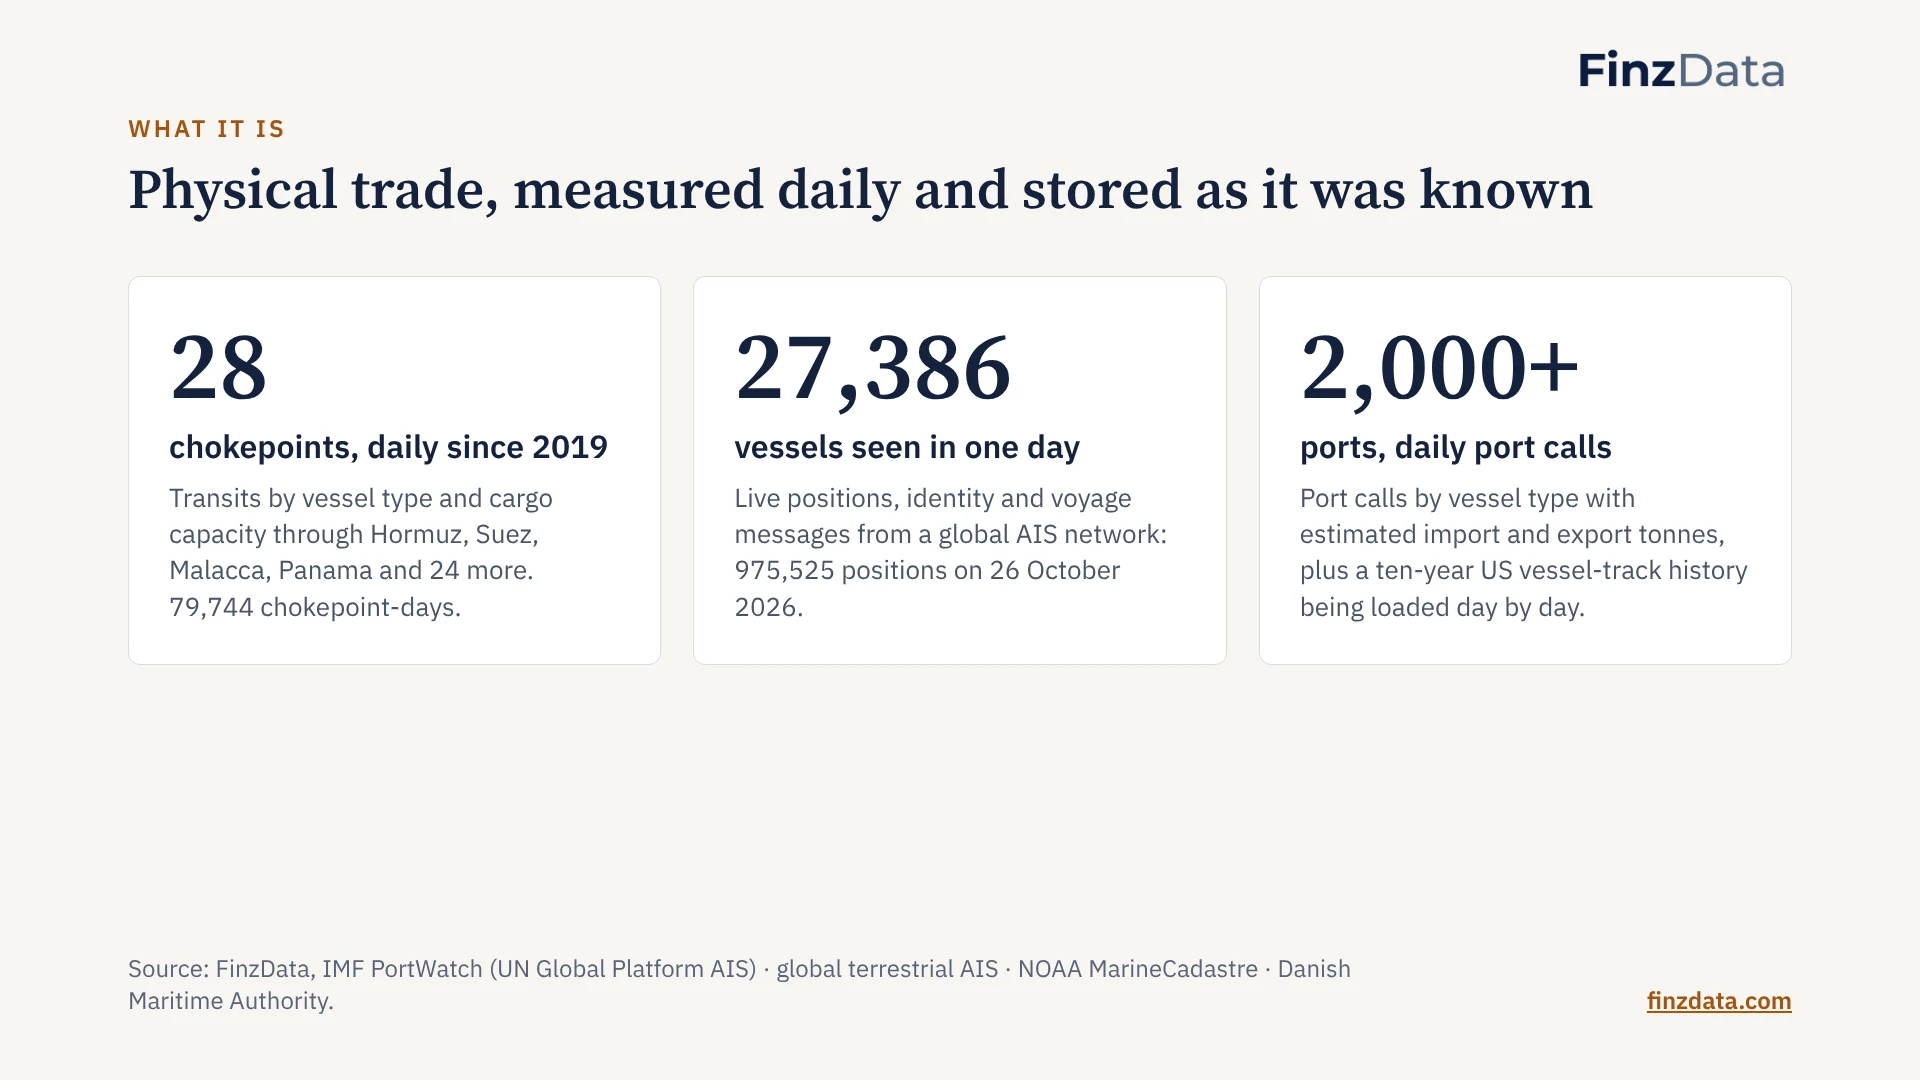
Physical trade, measured daily and stored as it was known
Three layers. The chokepoint layer is the longest history and the cleanest signal. The live layer is our own feed. The port layer covers 2,065 ports. Every row carries the time we learned it, so a backtest only ever sees what was knowable on that day.
4. The 2026 closure, read straight off the data
Strait of Hormuz · transits per day
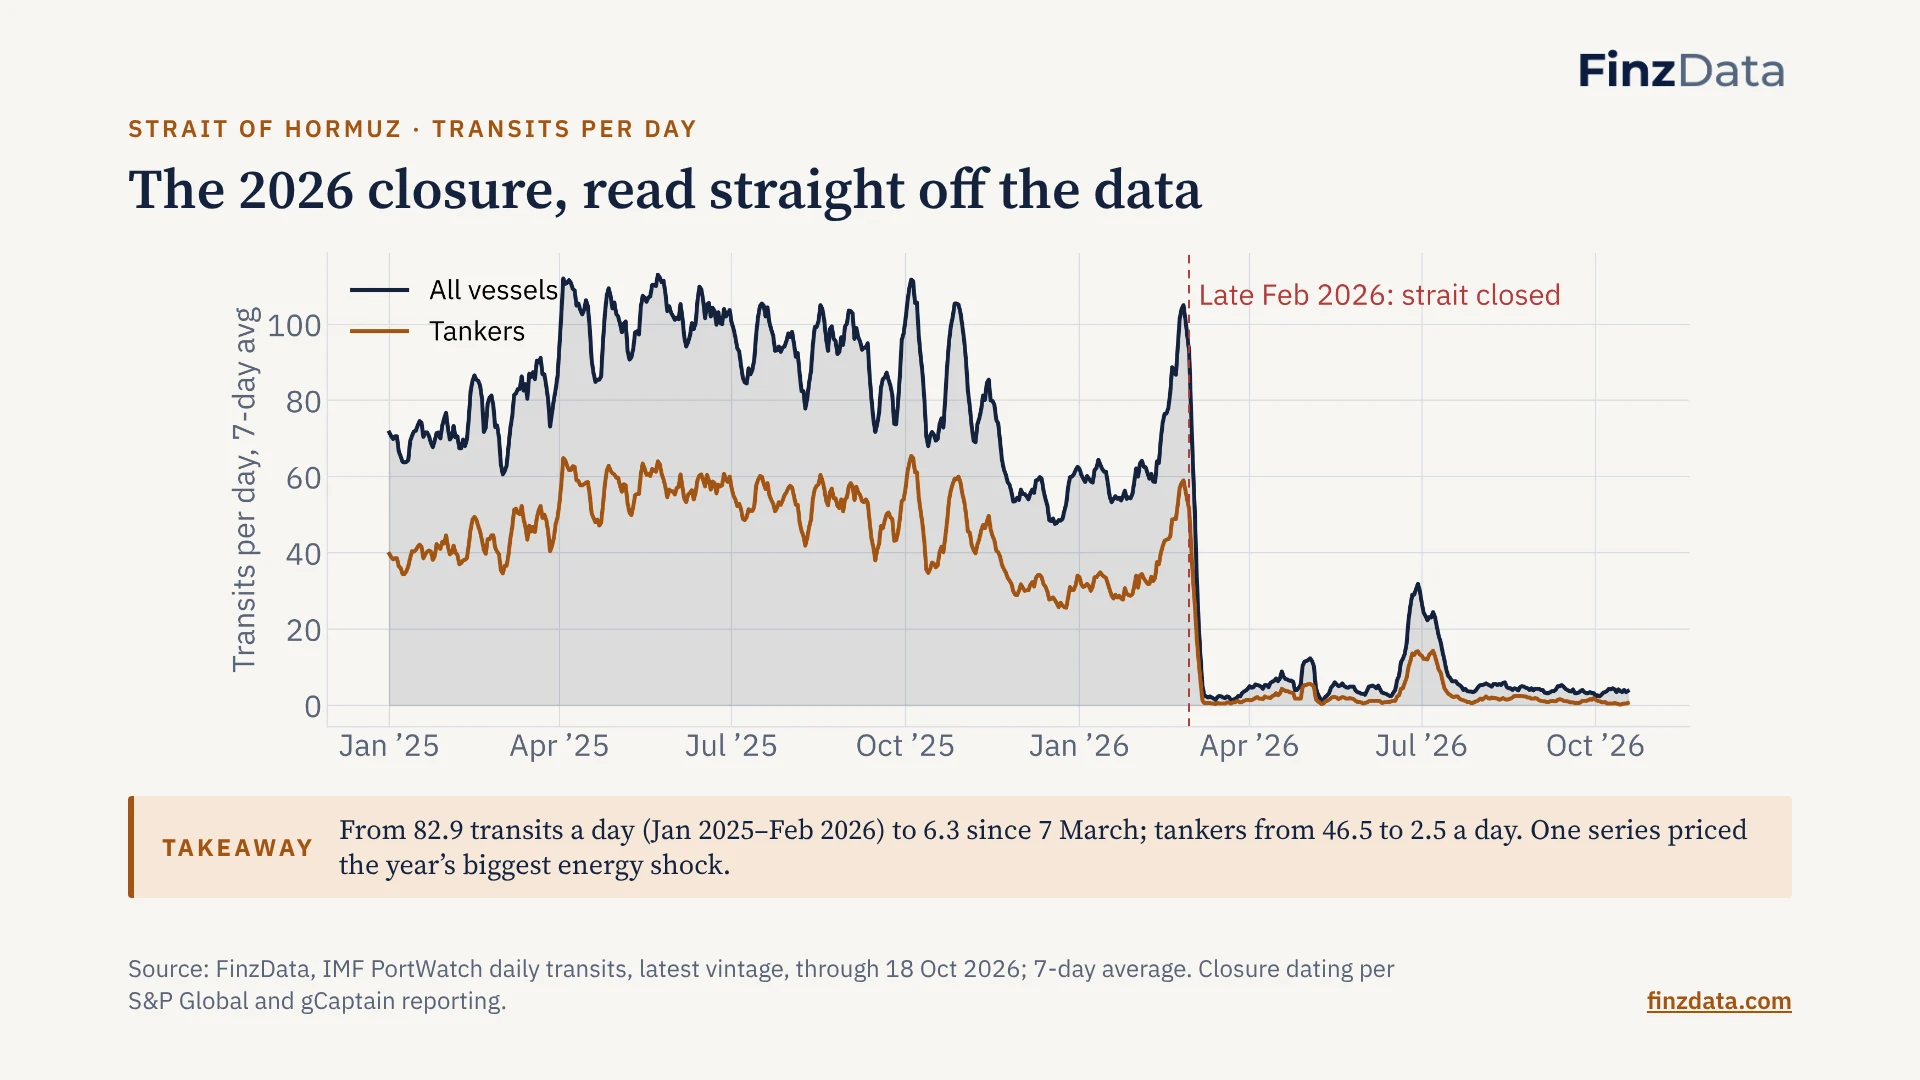
Takeaway: From 82.9 transits a day (Jan 2025–Feb 2026) to 6.3 since 7 March; tankers from 46.5 to 2.5 a day. One series priced the year’s biggest energy shock.
Iran blocked the strait in late February 2026 and the US Navy answered with a blockade on Iranian shipping. The data shows it the day it happened: transits fell from roughly 80 to 100 a day to single digits within a week. The brief bounce in late June and July is visible too, as is the relapse. Kpler reported about six to eleven commodity vessels a day in August, in line with our series.
5. Gulf terminals emptied; ports outside Hormuz took the trade
Port by port · since the closure
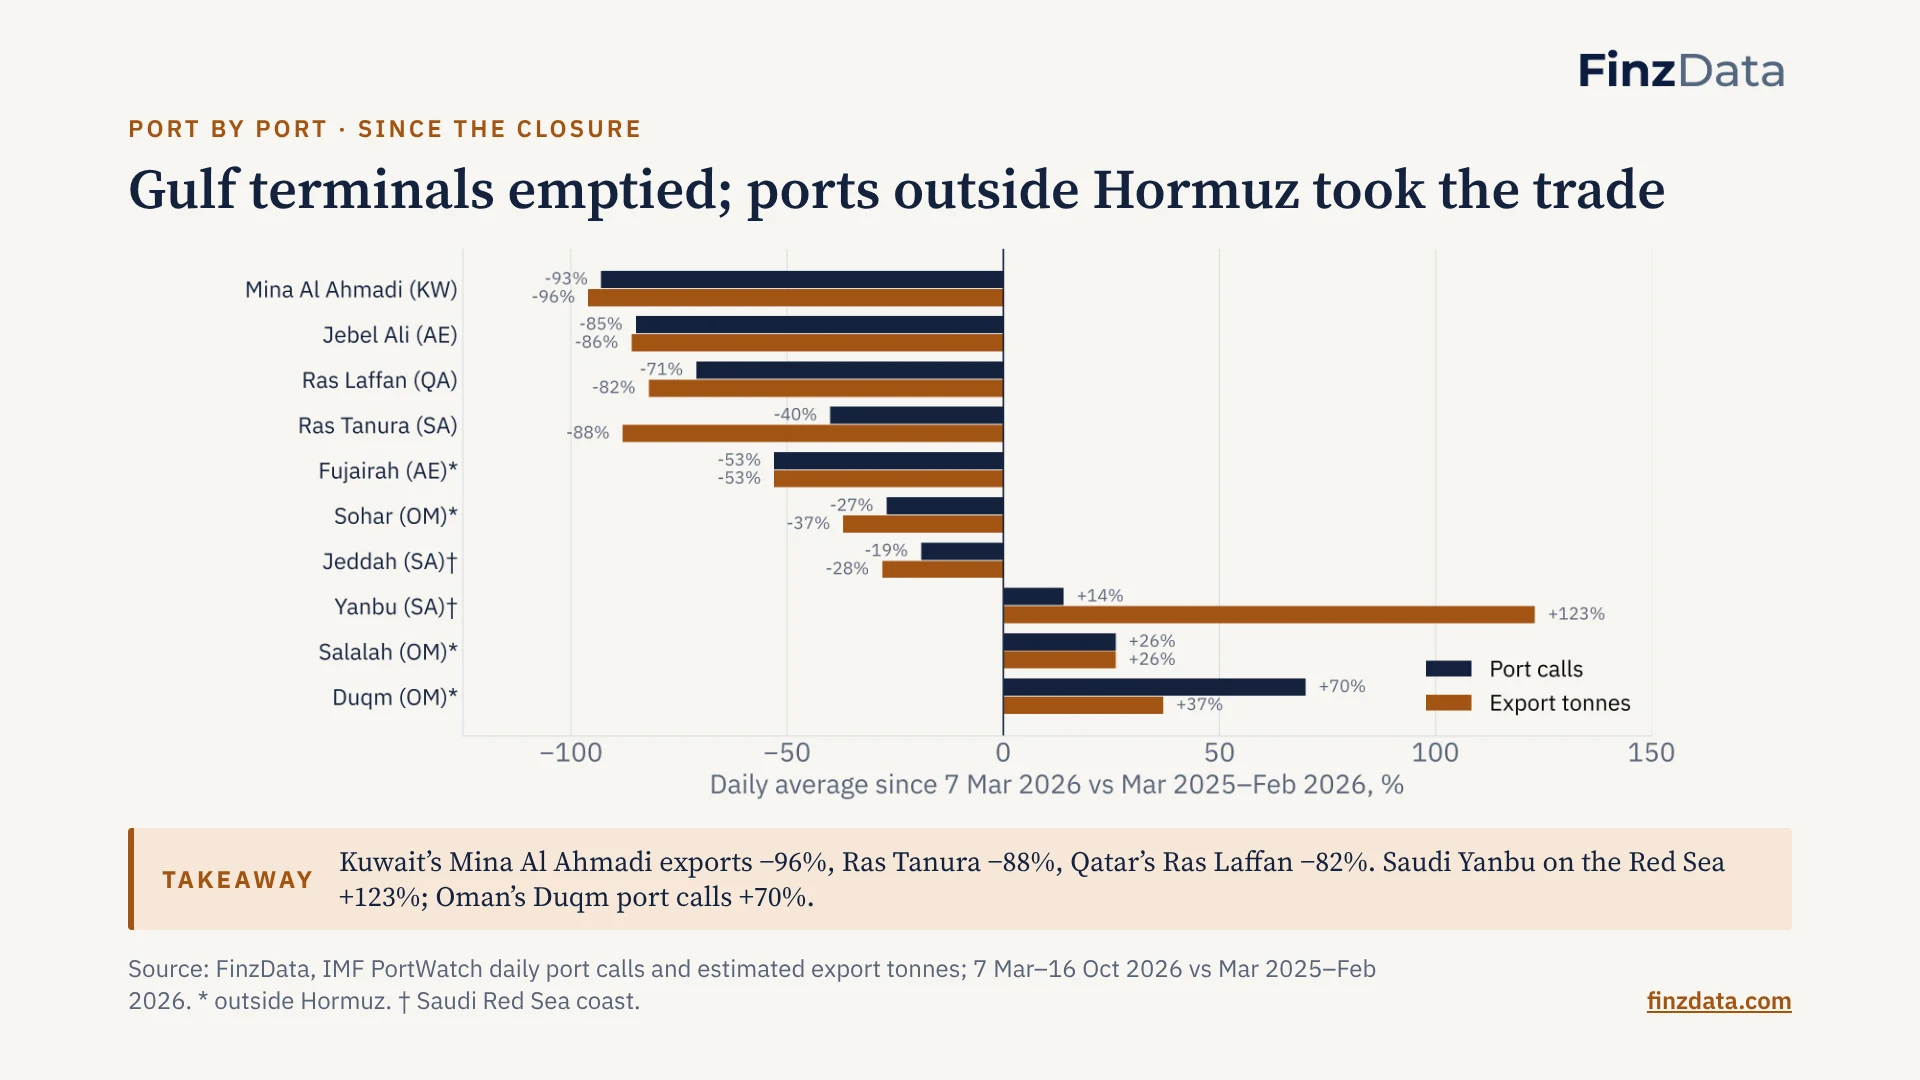
Takeaway: Kuwait’s Mina Al Ahmadi exports −96%, Ras Tanura −88%, Qatar’s Ras Laffan −82%. Saudi Yanbu on the Red Sea +123%; Oman’s Duqm port calls +70%.
The chokepoint counts say the strait shut. The port layer says who lost and who won. Every terminal inside the Gulf collapsed; the outlets that do not need the strait, Yanbu through the Saudi East-West pipeline and the Omani ports on the Arabian Sea, gained. That is a tradeable map of the shock, port by port.
6. The bypass, then the dark: why raw AIS needs a second source
Saudi crude exports · Yanbu vs Ras Tanura
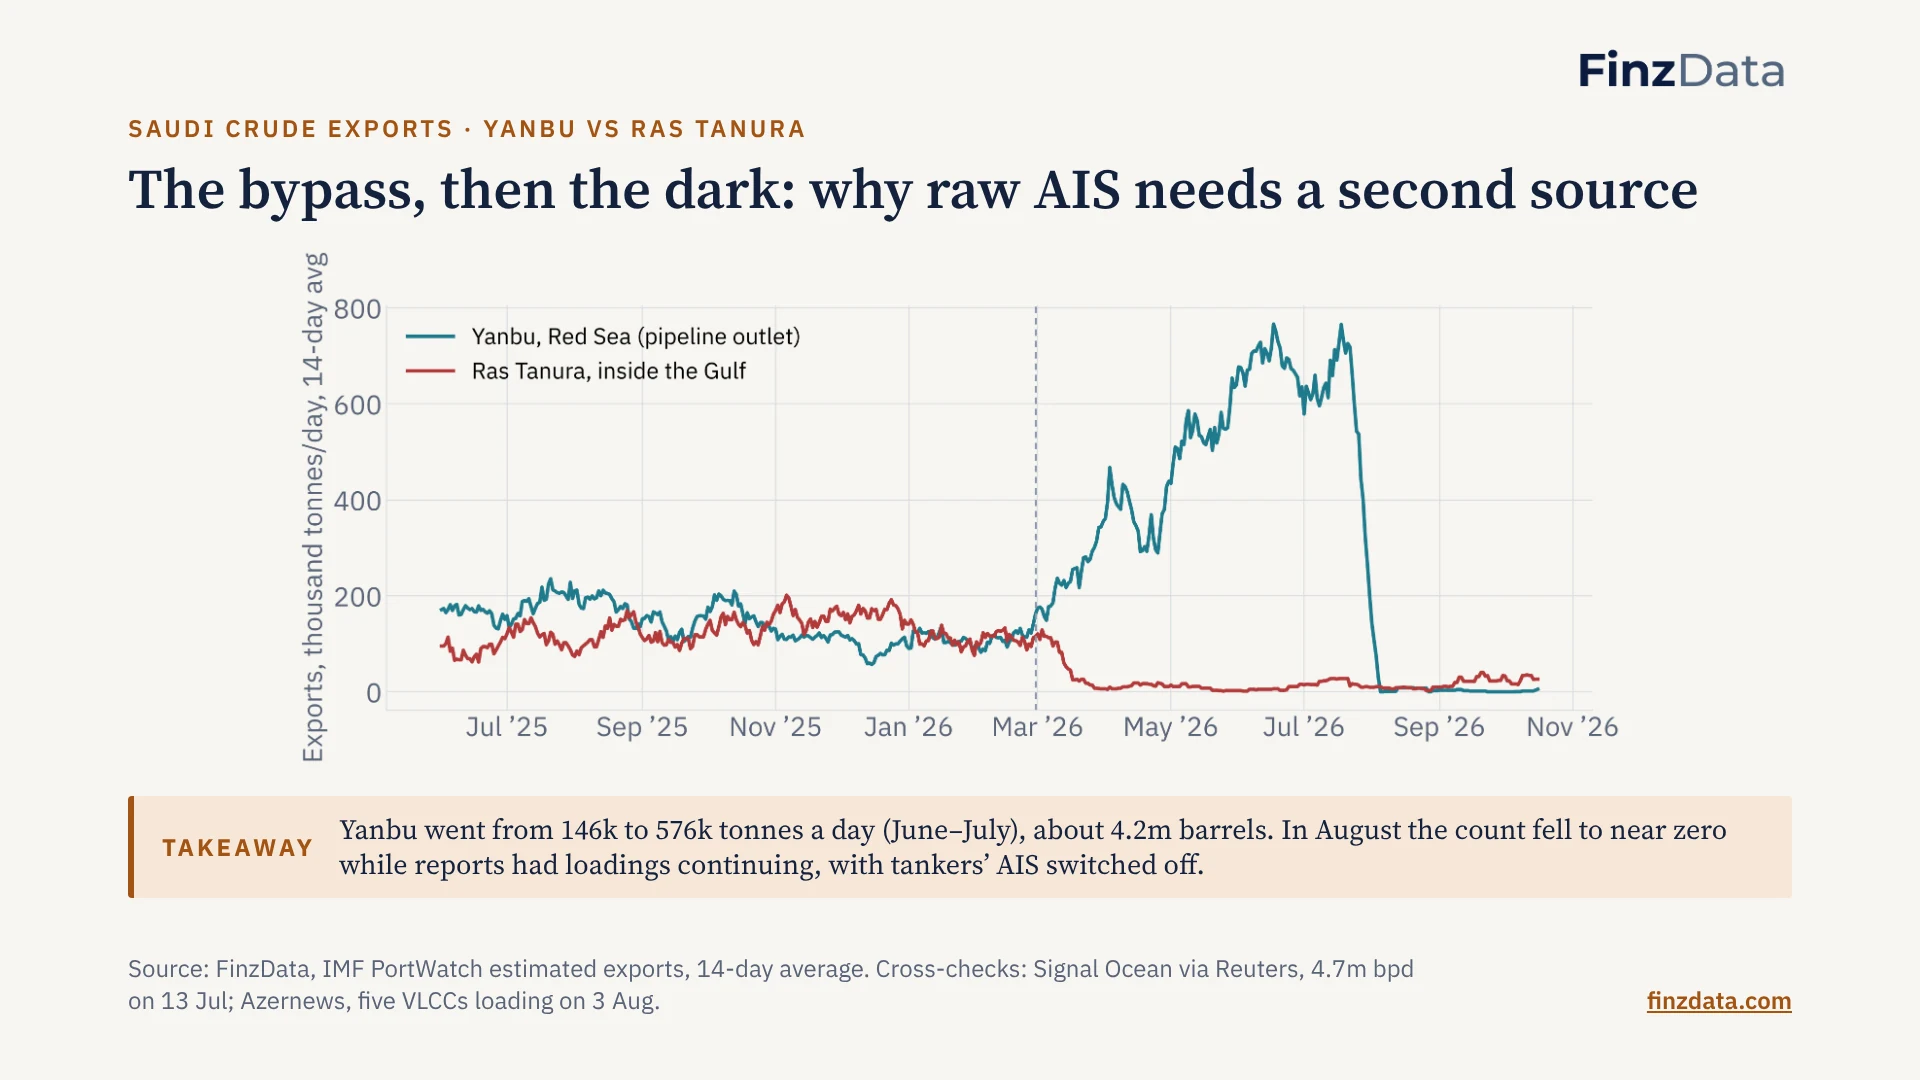
Takeaway: Yanbu went from 146k to 576k tonnes a day (June–July), about 4.2m barrels. In August the count fell to near zero while reports had loadings continuing, with tankers’ AIS switched off.
Two lessons in one chart. First, the data caught Saudi Arabia rerouting crude through the East-West pipeline to the Red Sea within days of the closure. Second, after the Houthis threatened Saudi ports in mid-July, tankers loading at Yanbu turned their transponders off, and every AIS-derived count went blind. We flag those gaps rather than publish them as zeros, and our dark-gap detector is built for exactly this case.
7. Two shipping shocks, opposite winners
Event study · 20 trading days after each shock
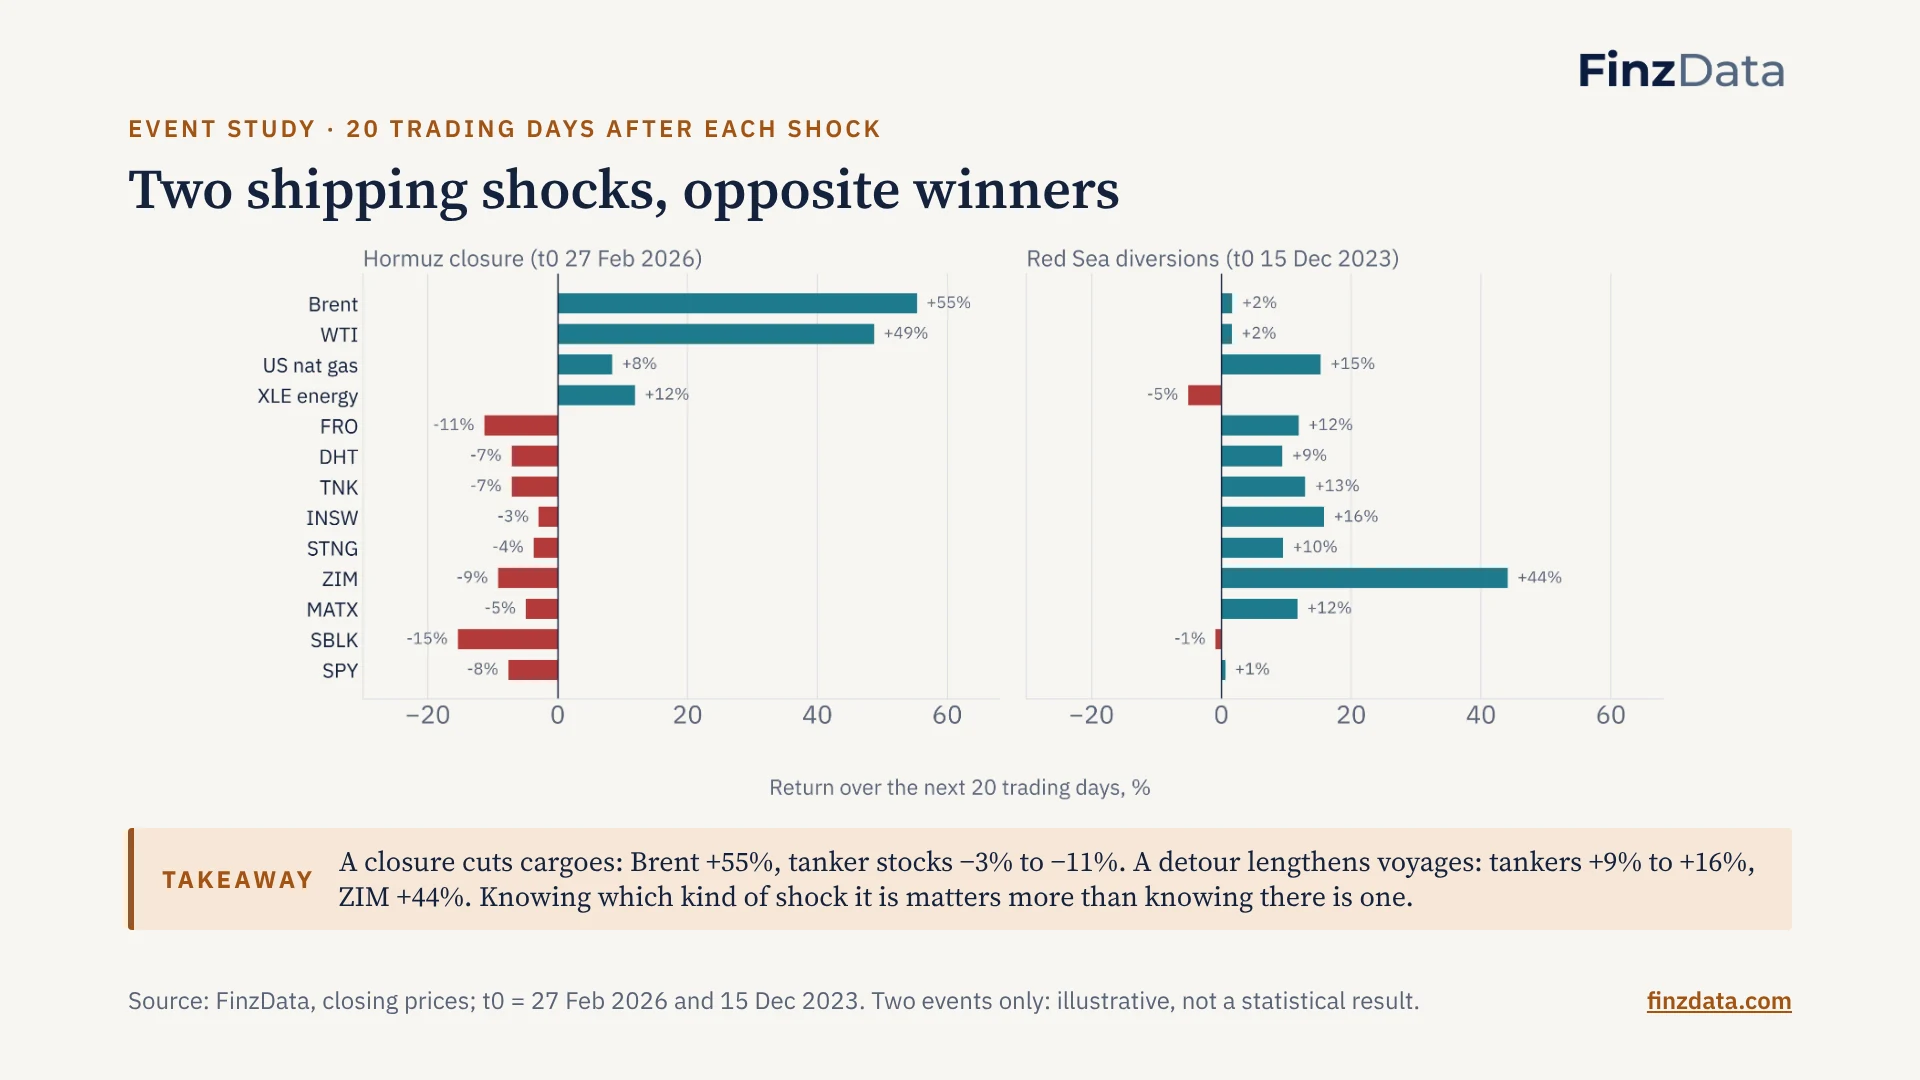
Takeaway: A closure cuts cargoes: Brent +55%, tanker stocks −3% to −11%. A detour lengthens voyages: tankers +9% to +16%, ZIM +44%. Knowing which kind of shock it is matters more than knowing there is one.
The Hormuz closure removed supply, so oil soared while tanker owners lost cargoes. The Red Sea diversions sent the same cargoes the long way round Africa, which uses more ships for longer, so tanker and container shipping rates and stocks rose. The transit data tells the two apart: Hormuz shows transits falling with nowhere else rising; the Red Sea shows Suez falling while the Cape rises.
8. Two years of rerouting around Africa, in three lines
Red Sea · Suez · Cape of Good Hope
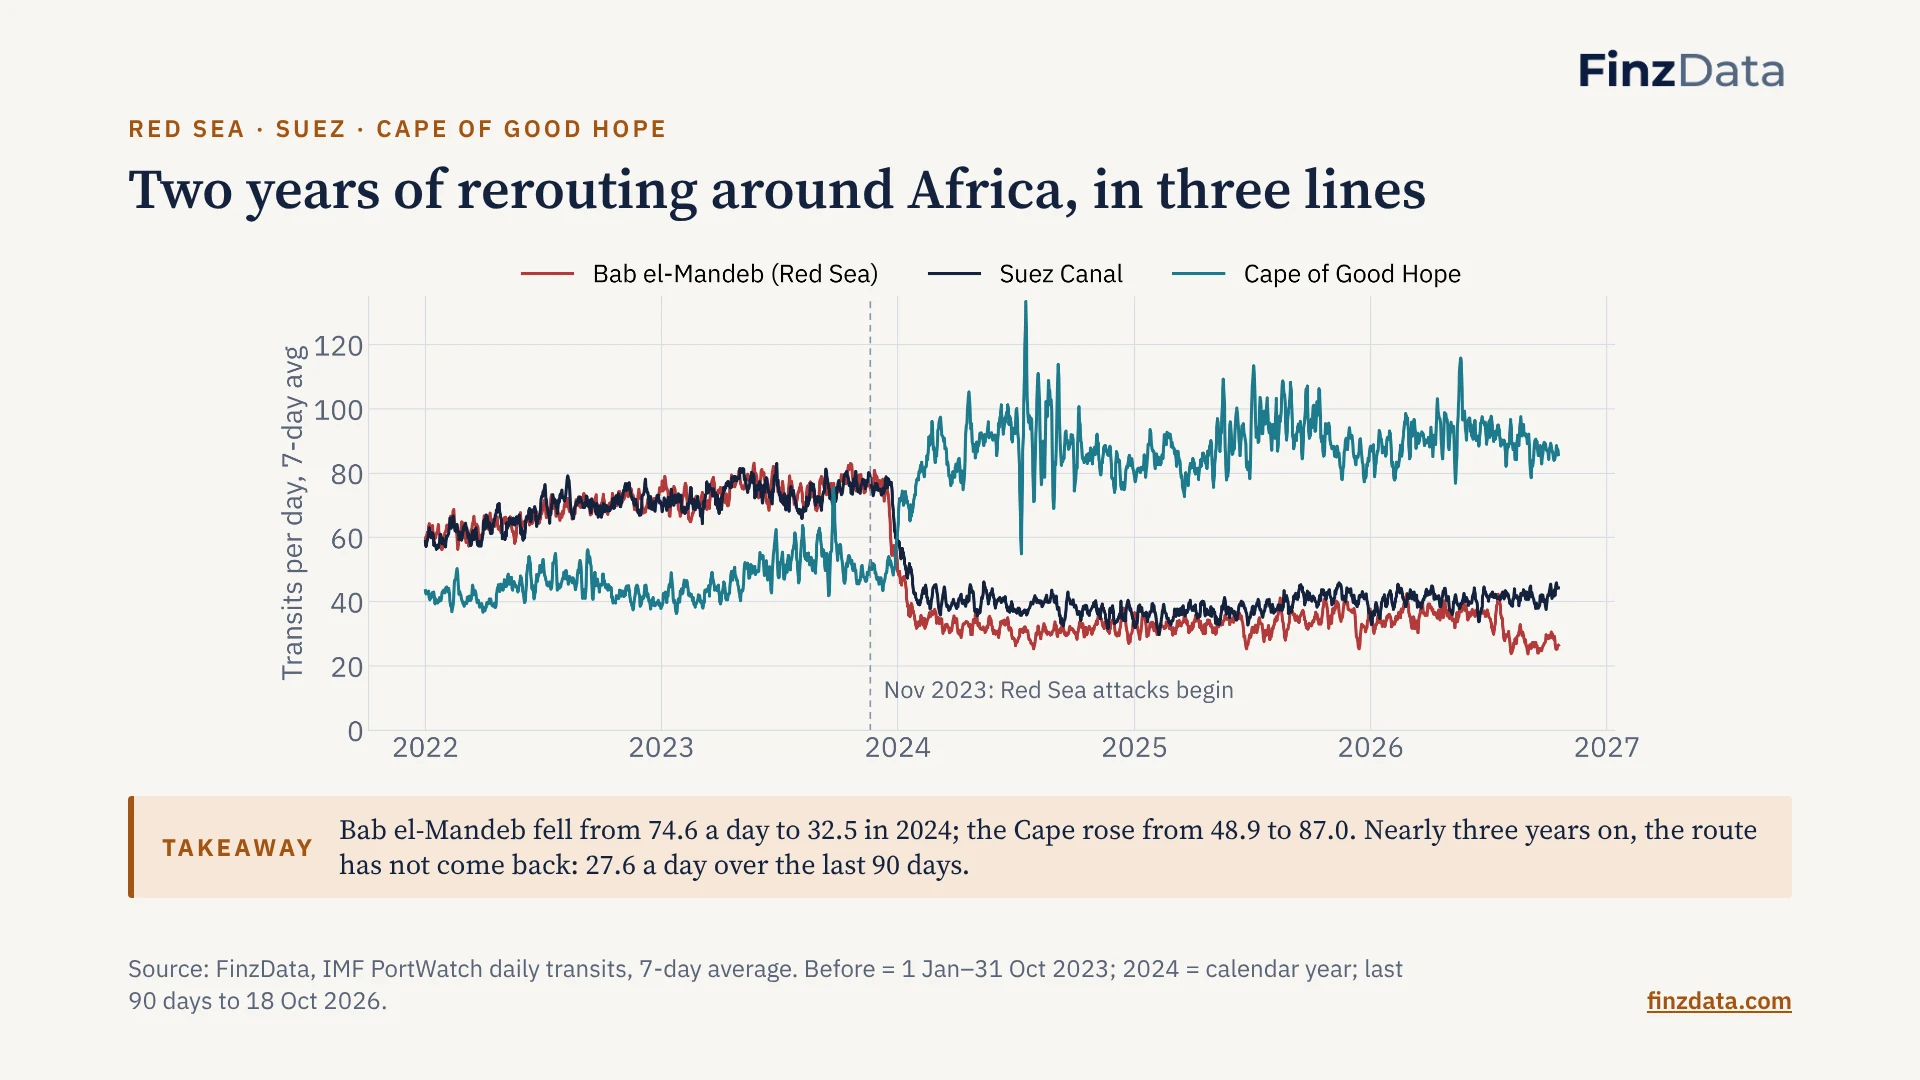
Takeaway: Bab el-Mandeb fell from 74.6 a day to 32.5 in 2024; the Cape rose from 48.9 to 87.0. Nearly three years on, the route has not come back: 27.6 a day over the last 90 days.
The Red Sea attacks began in November 2023. Within weeks Suez and Bab el-Mandeb traffic halved and the Cape of Good Hope took the diverted ships. Suez has edged up to about 41 a day; Bab el-Mandeb has slipped again in 2026.
9. A quieter collapse the headlines have not explained
Bosporus · transits per day, monthly
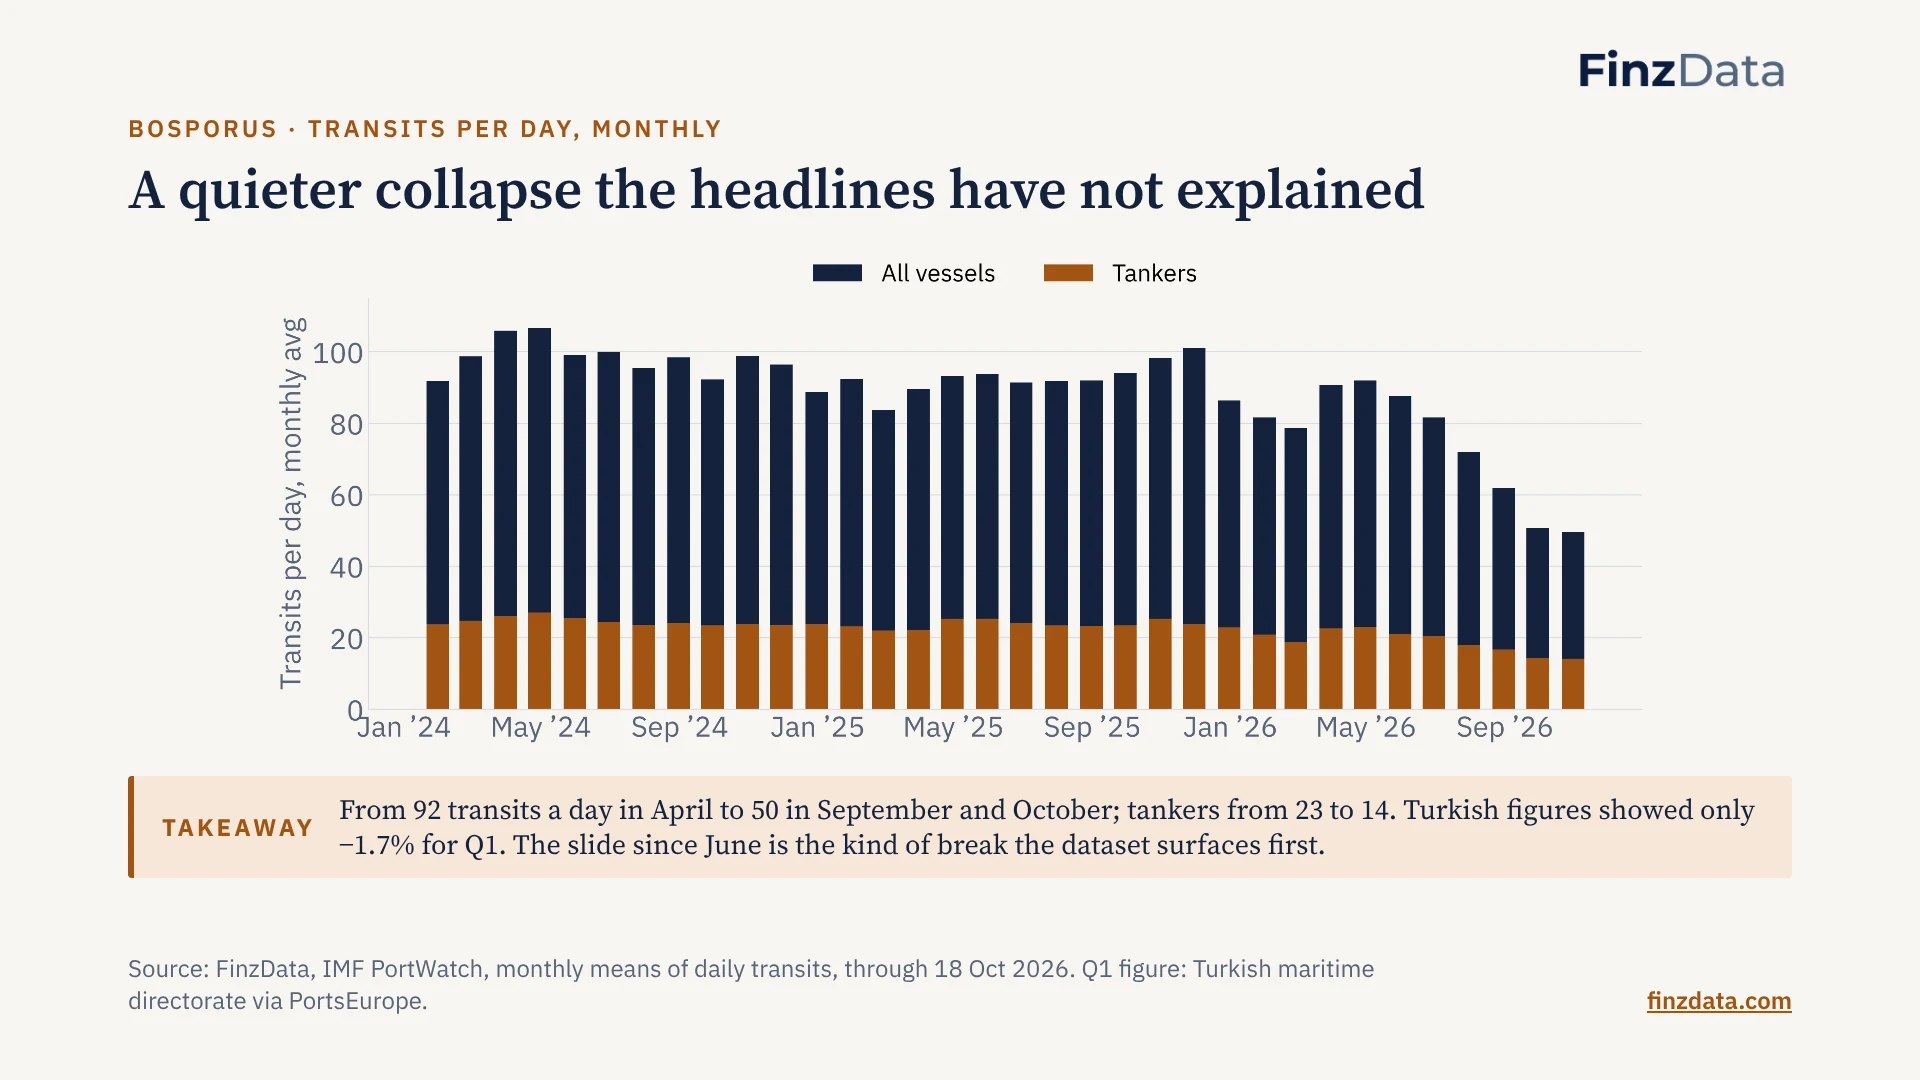
Takeaway: From 92 transits a day in April to 50 in September and October; tankers from 23 to 14. Turkish figures showed only −1.7% for Q1. The slide since June is the kind of break the dataset surfaces first.
We have not found a published cause for the Bosporus decline that starts in June 2026, and we do not guess one here. Russia’s Black Sea port Novorossiysk shows fewer calls but higher export tonnes over the same period, so the mix is changing as well as the count. This is a lead for research, flagged by the weekly scorecard.
10. Every trade lane, scored the same way every week
24 chokepoints · this week vs a year ago
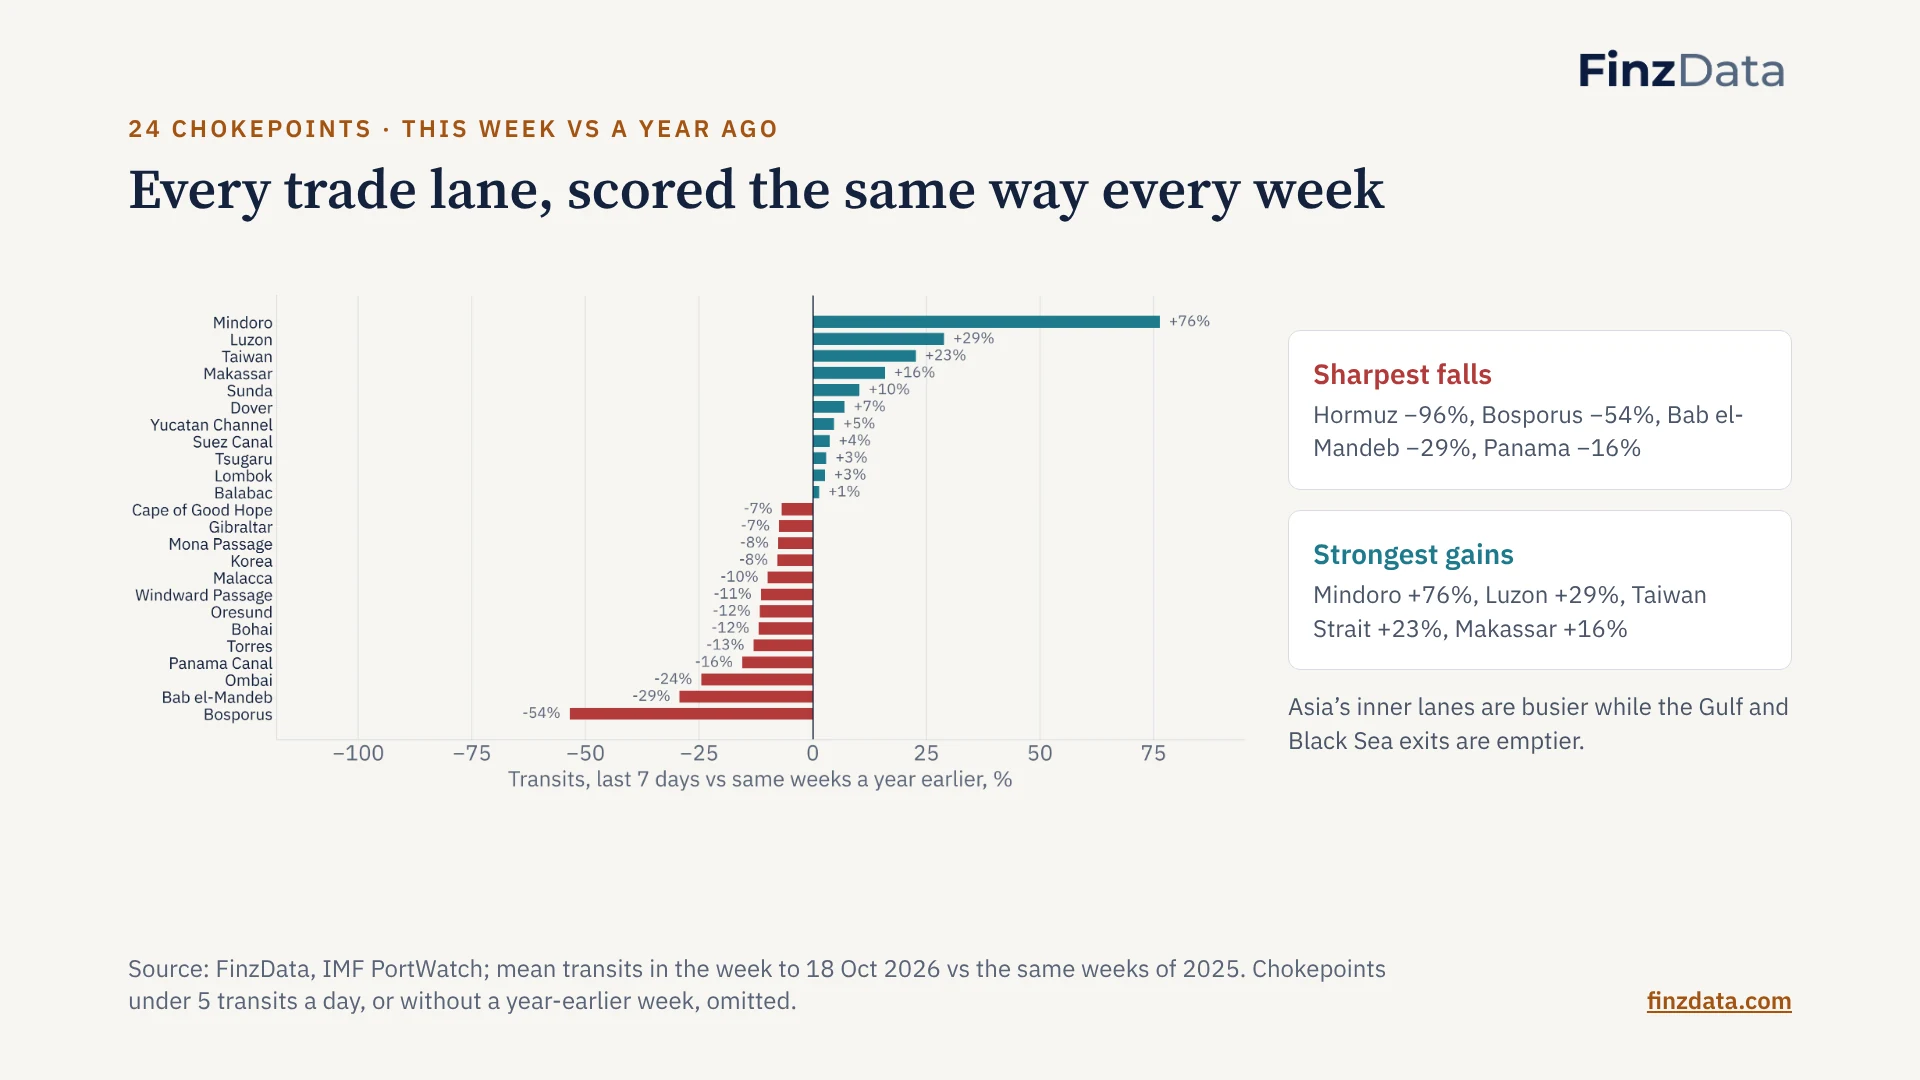
Every trade lane, scored the same way every week
This is the weekly scorecard the dataset produces automatically. Four chokepoints are left out: those with fewer than five transits a day, whose percentages are noise (the Kerch Strait reads minus 100 percent and is excluded on that rule), and any without a comparable year-earlier week.
11. A drought you could trade, before the headlines
Panama Canal · transits per day
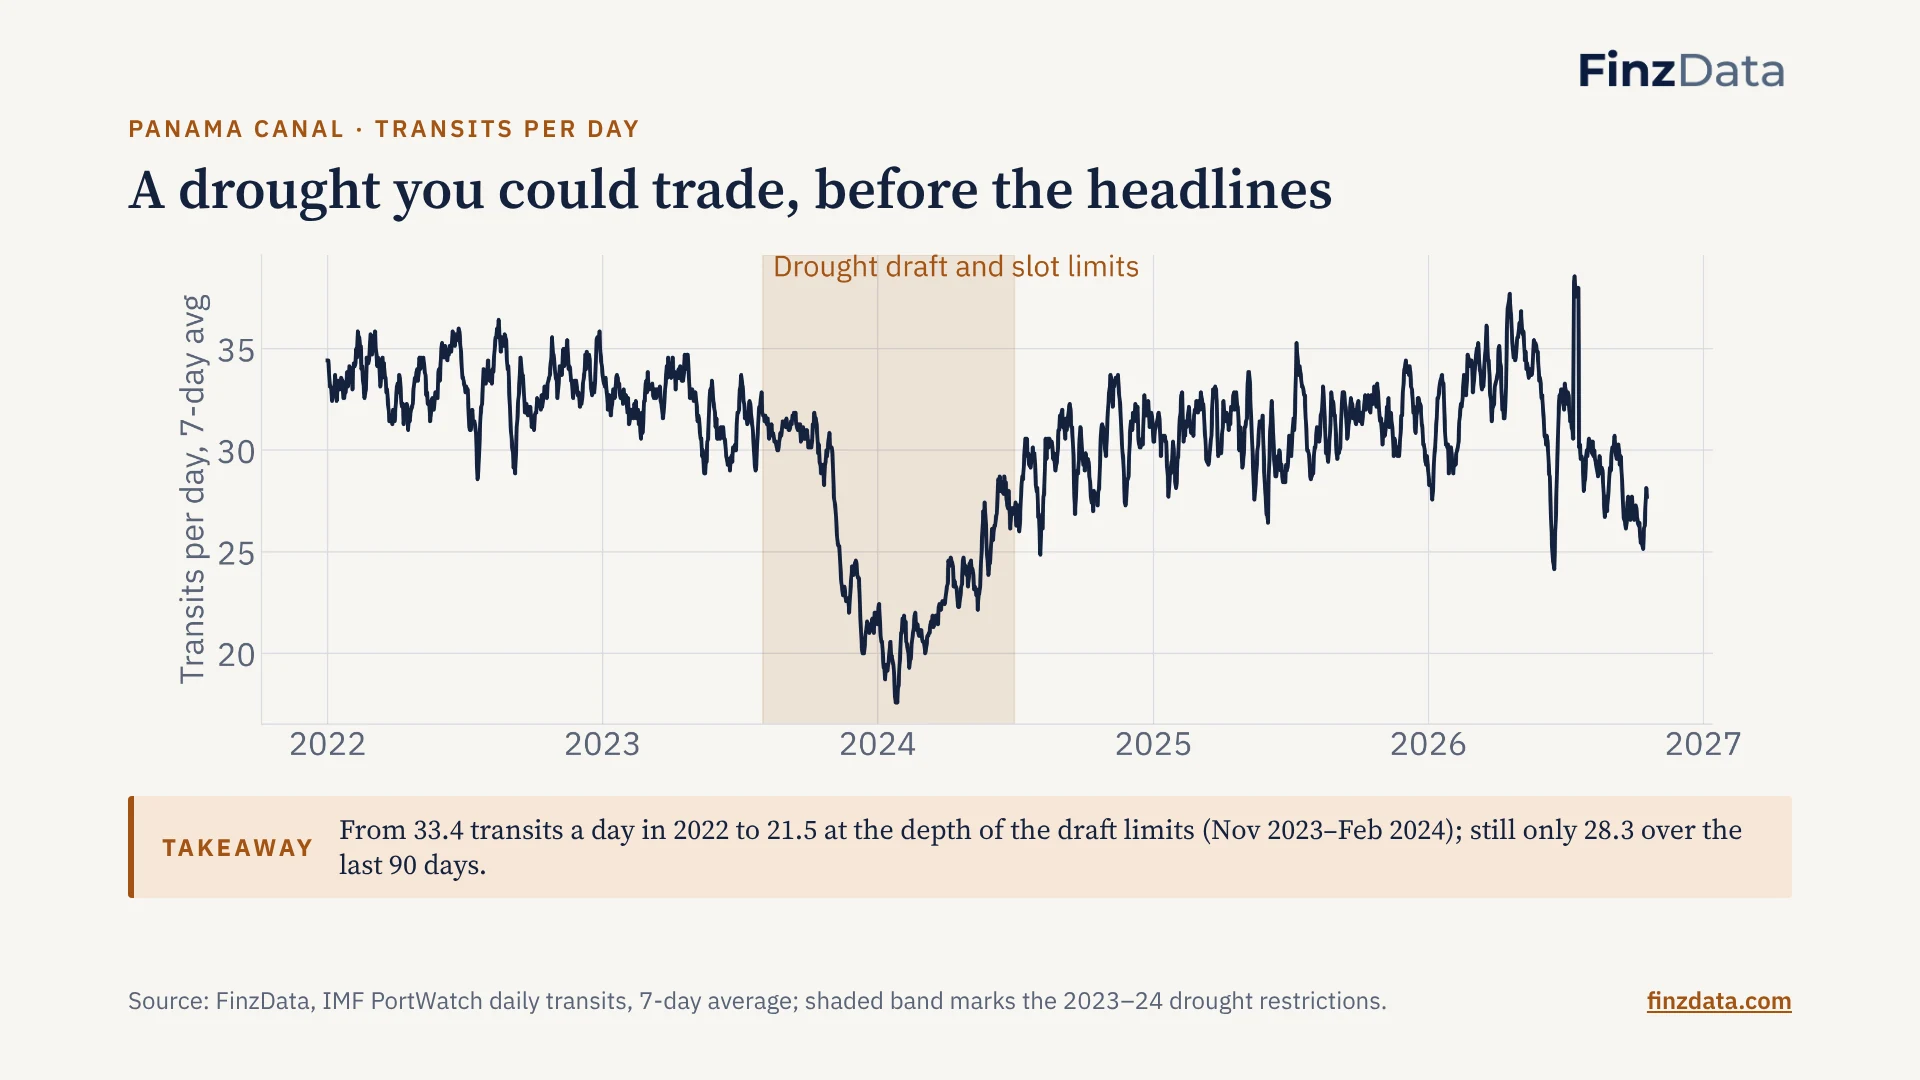
Takeaway: From 33.4 transits a day in 2022 to 21.5 at the depth of the draft limits (Nov 2023–Feb 2024); still only 28.3 over the last 90 days.
The canal cut daily slots and draft limits as Gatun Lake fell. The series shows the slide building over months, which is the point: the physical data moved well before the restrictions reached quarterly results.
12. China’s ports slowed; Europe and the US held
World hubs · since March 2026
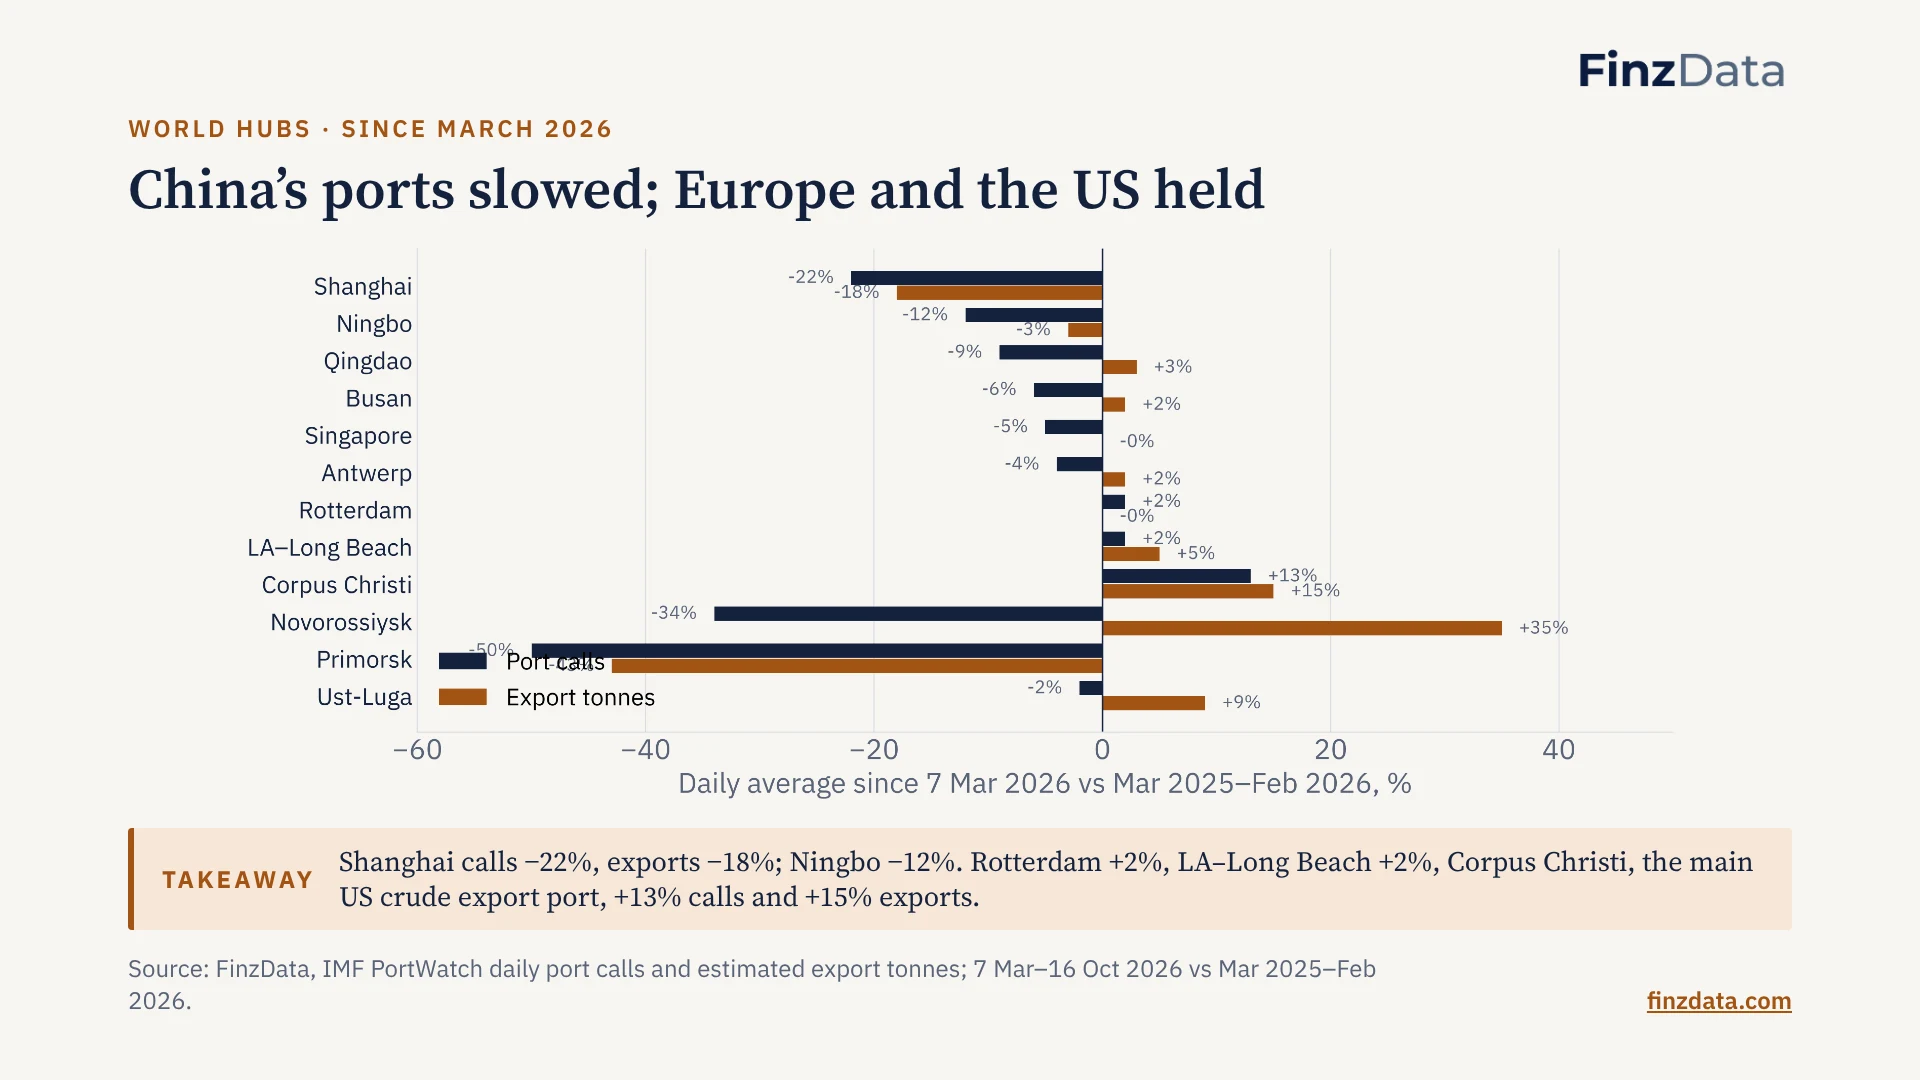
Takeaway: Shanghai calls −22%, exports −18%; Ningbo −12%. Rotterdam +2%, LA–Long Beach +2%, Corpus Christi, the main US crude export port, +13% calls and +15% exports.
Port calls count ship visits; export tonnes estimate what left. Watch where they diverge: Novorossiysk has fewer calls but more tonnes, so bigger cargoes per call. Corpus Christi, the main US crude export port, is up on both.
13. Chokepoint traffic peaked in 2023 and is falling
All 28 chokepoints · average transits per day
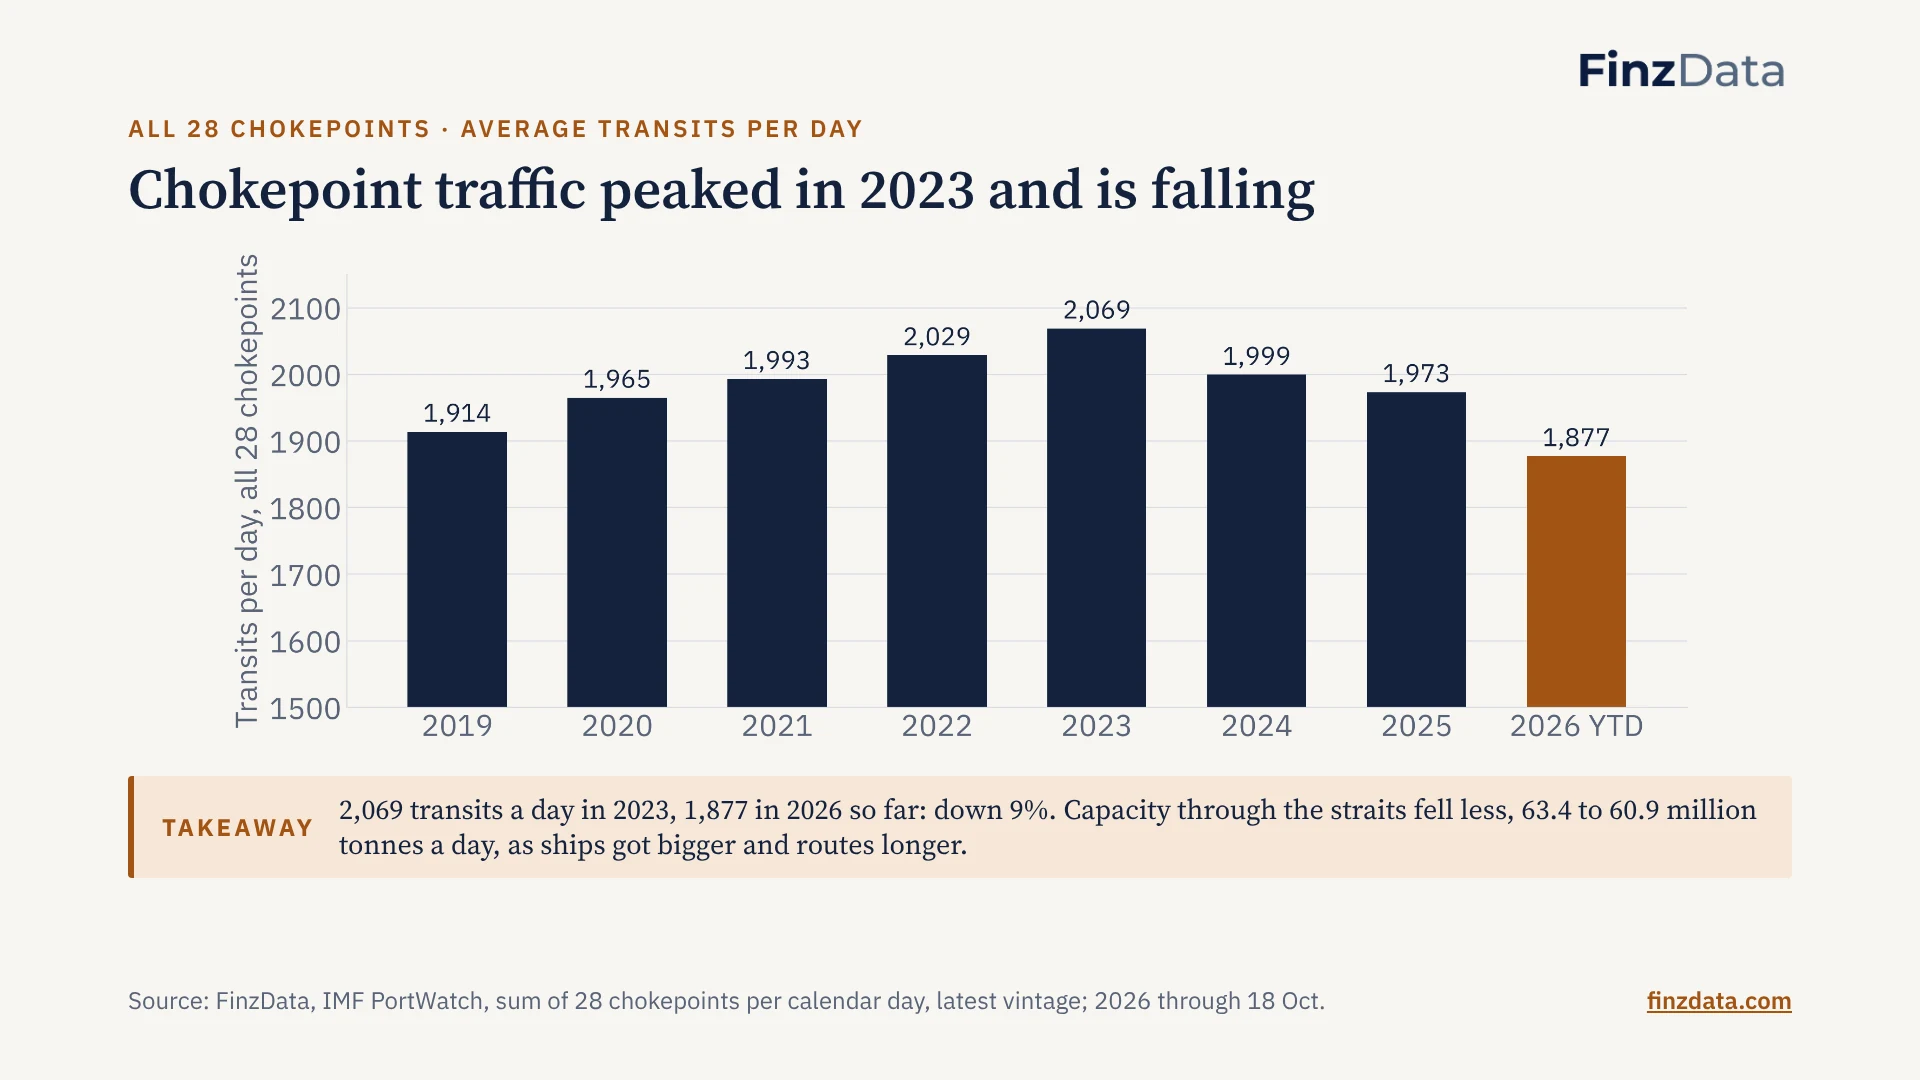
Takeaway: 2,069 transits a day in 2023, 1,877 in 2026 so far: down 9%. Capacity through the straits fell less, 63.4 to 60.9 million tonnes a day, as ships got bigger and routes longer.
A ship rerouted round the Cape stops crossing Suez and Bab el-Mandeb but adds only one Cape crossing, so part of this fall is rerouting rather than lost trade. The capacity line, which counts tonnes, falls less, which is why we publish both.
14. Fewer ships, bigger ships: count and tonnage diverge
All chokepoints · cargo capacity per transit
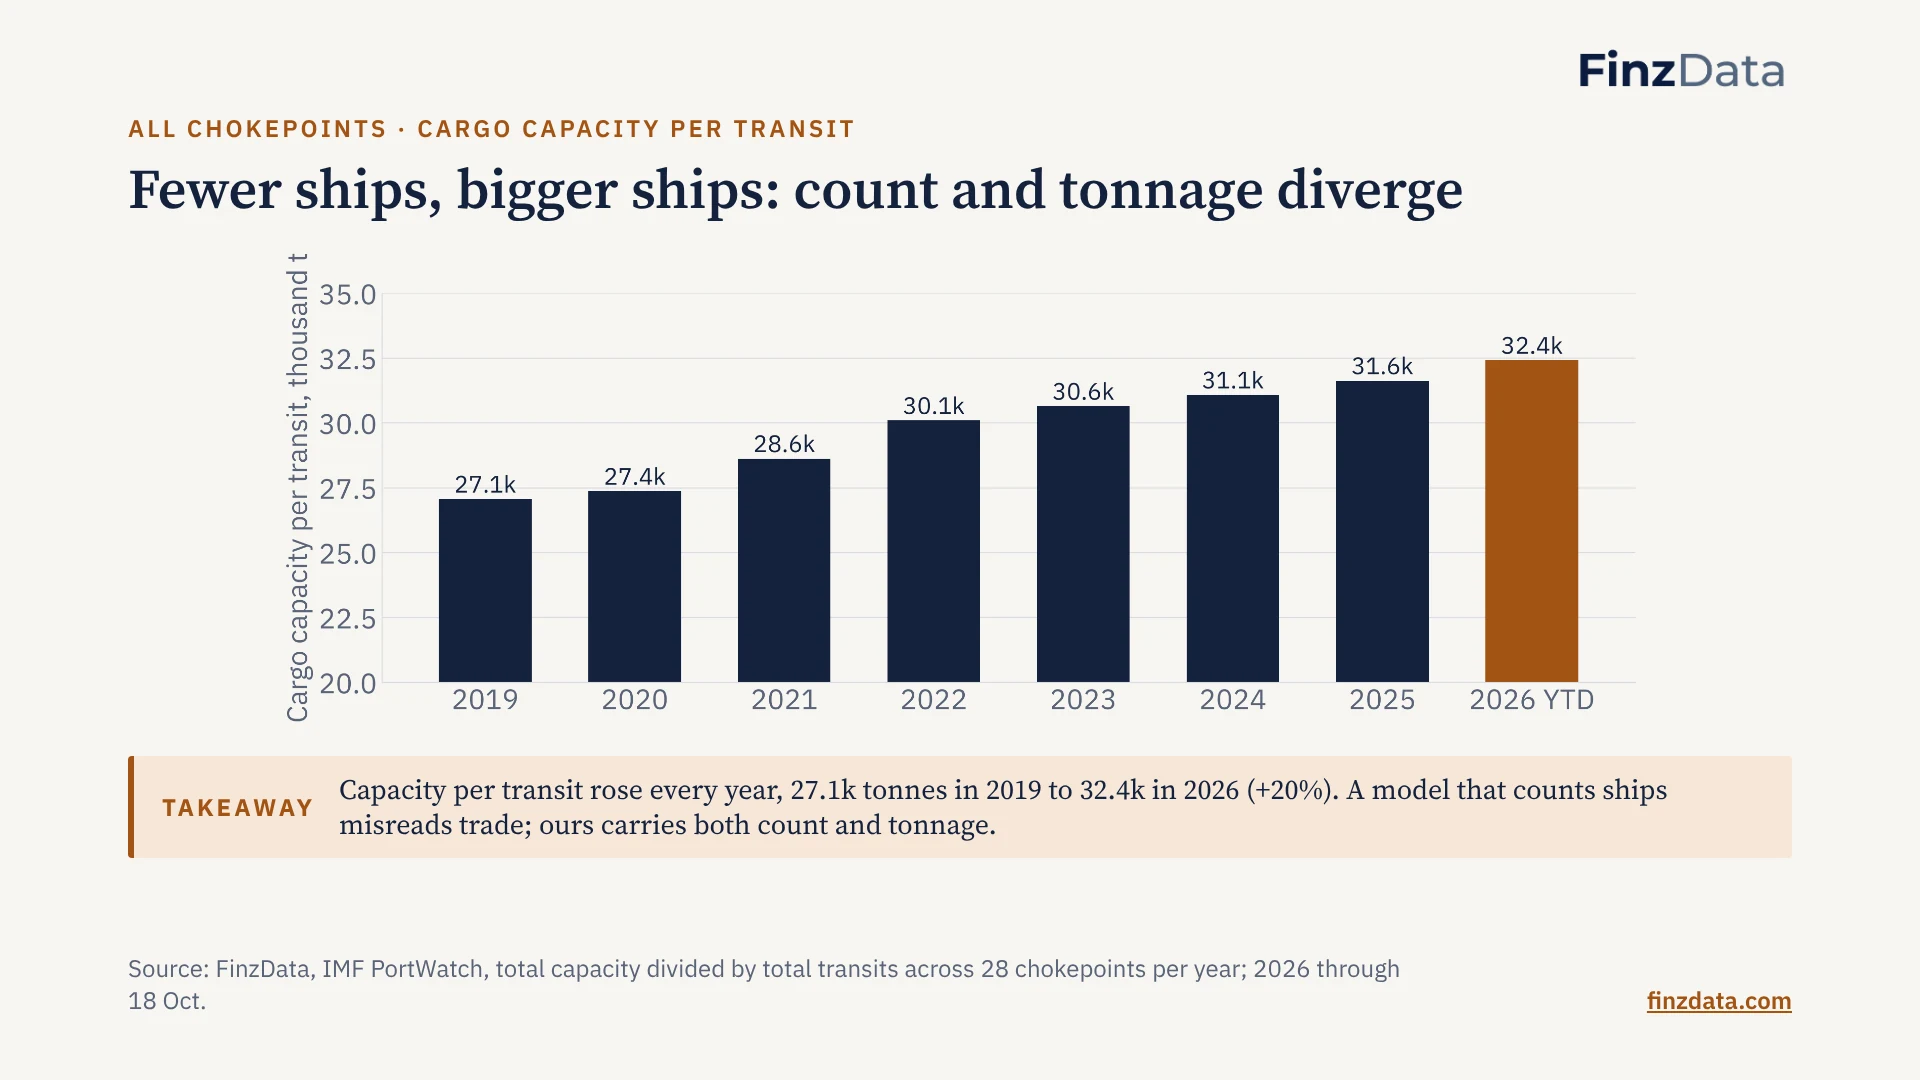
Takeaway: Capacity per transit rose every year, 27.1k tonnes in 2019 to 32.4k in 2026 (+20%). A model that counts ships misreads trade; ours carries both count and tonnage.
Tankers’ share of transits slipped from about 30 percent to 28 percent in 2026, mostly the Hormuz effect. The capacity series is why total chokepoint tonnage fell only 4 percent from its peak while the ship count fell 9 percent.
15. Coincident, not predictive: the edge is speed and context
Does the weekly IMF series predict prices on its own?
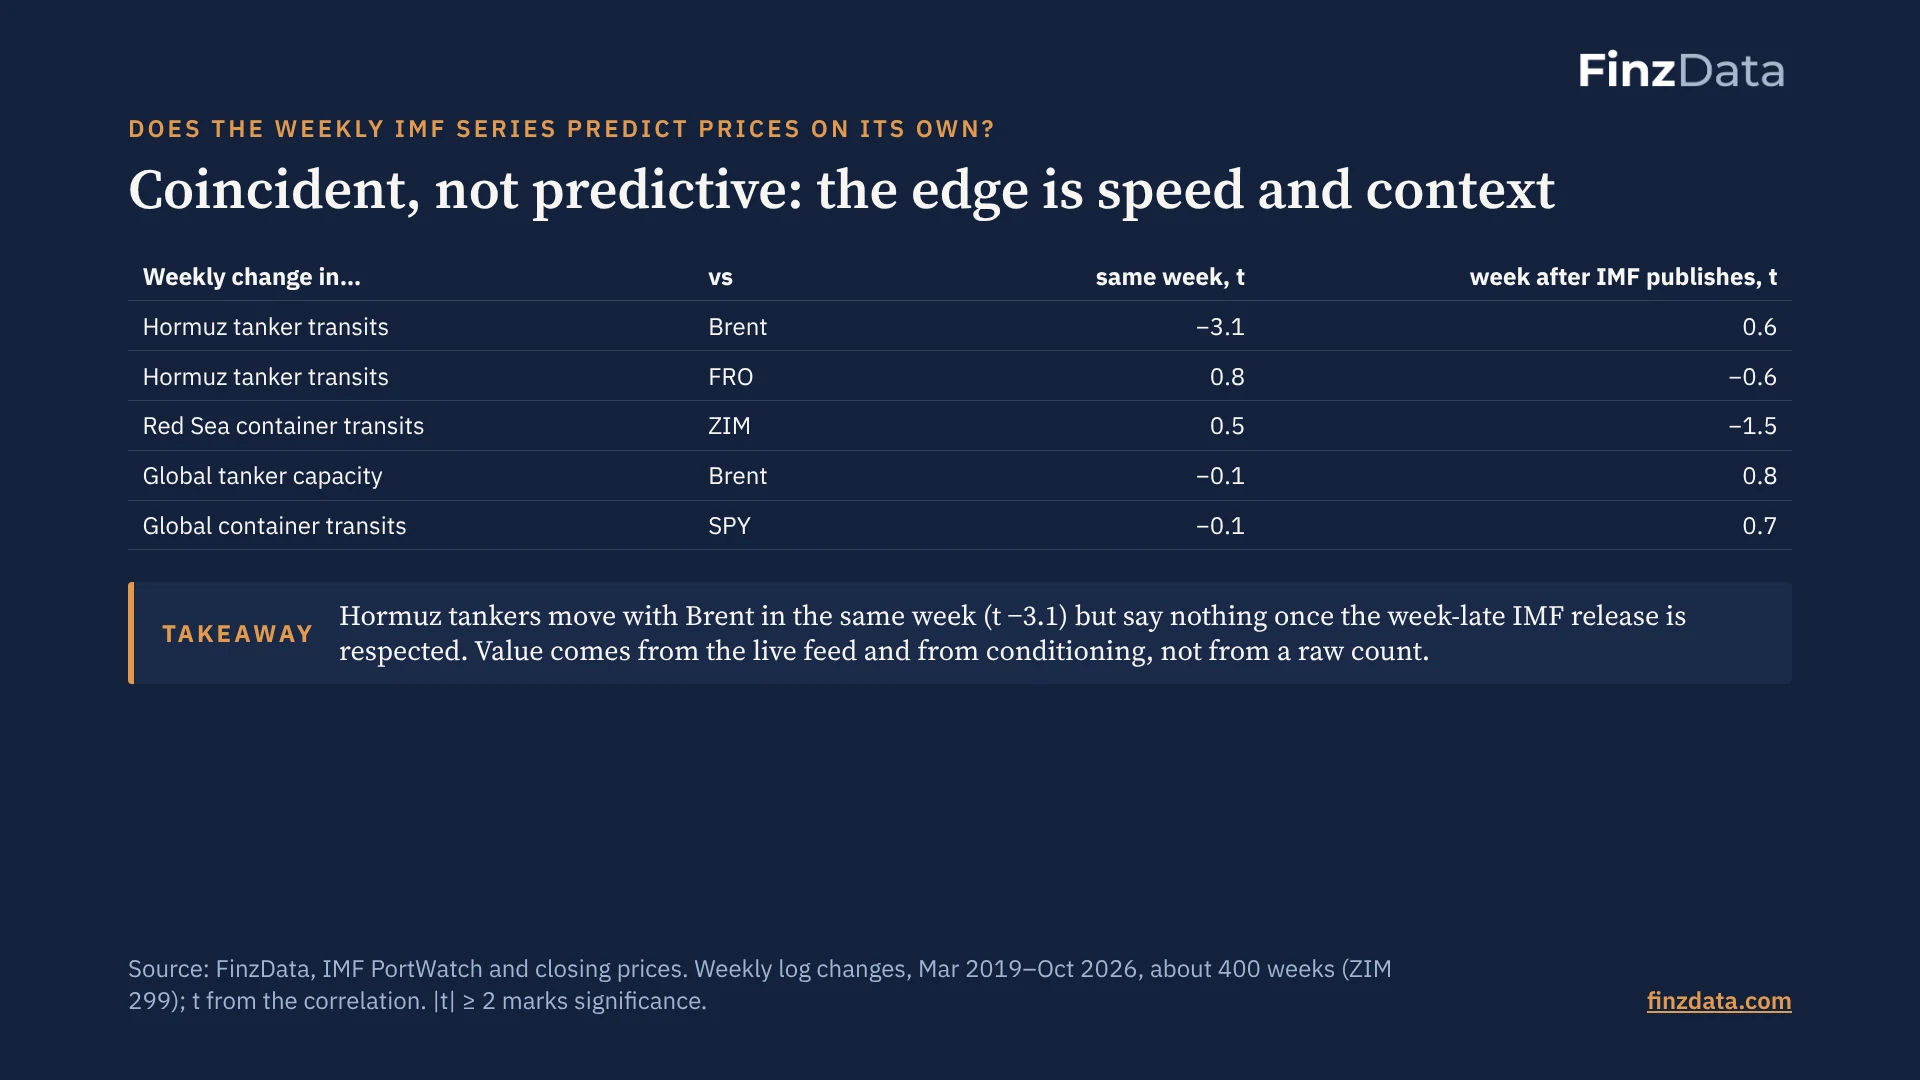
Takeaway: Hormuz tankers move with Brent in the same week (t −3.1) but say nothing once the week-late IMF release is respected. Value comes from the live feed and from conditioning, not from a raw count.
We ran this test against ourselves on purpose. A buyer will run it in the first week. The honest answer is that a raw weekly count published a week late is already in the price. What is not in the price is a count you have the same day, from the live feed, and a count read in context: which lane, which vessel type, and whether it is a closure or a detour. That is the product.
16. 27,386 vessels in a single day, refreshed every 15 minutes
Live layer · one day of vessel positions
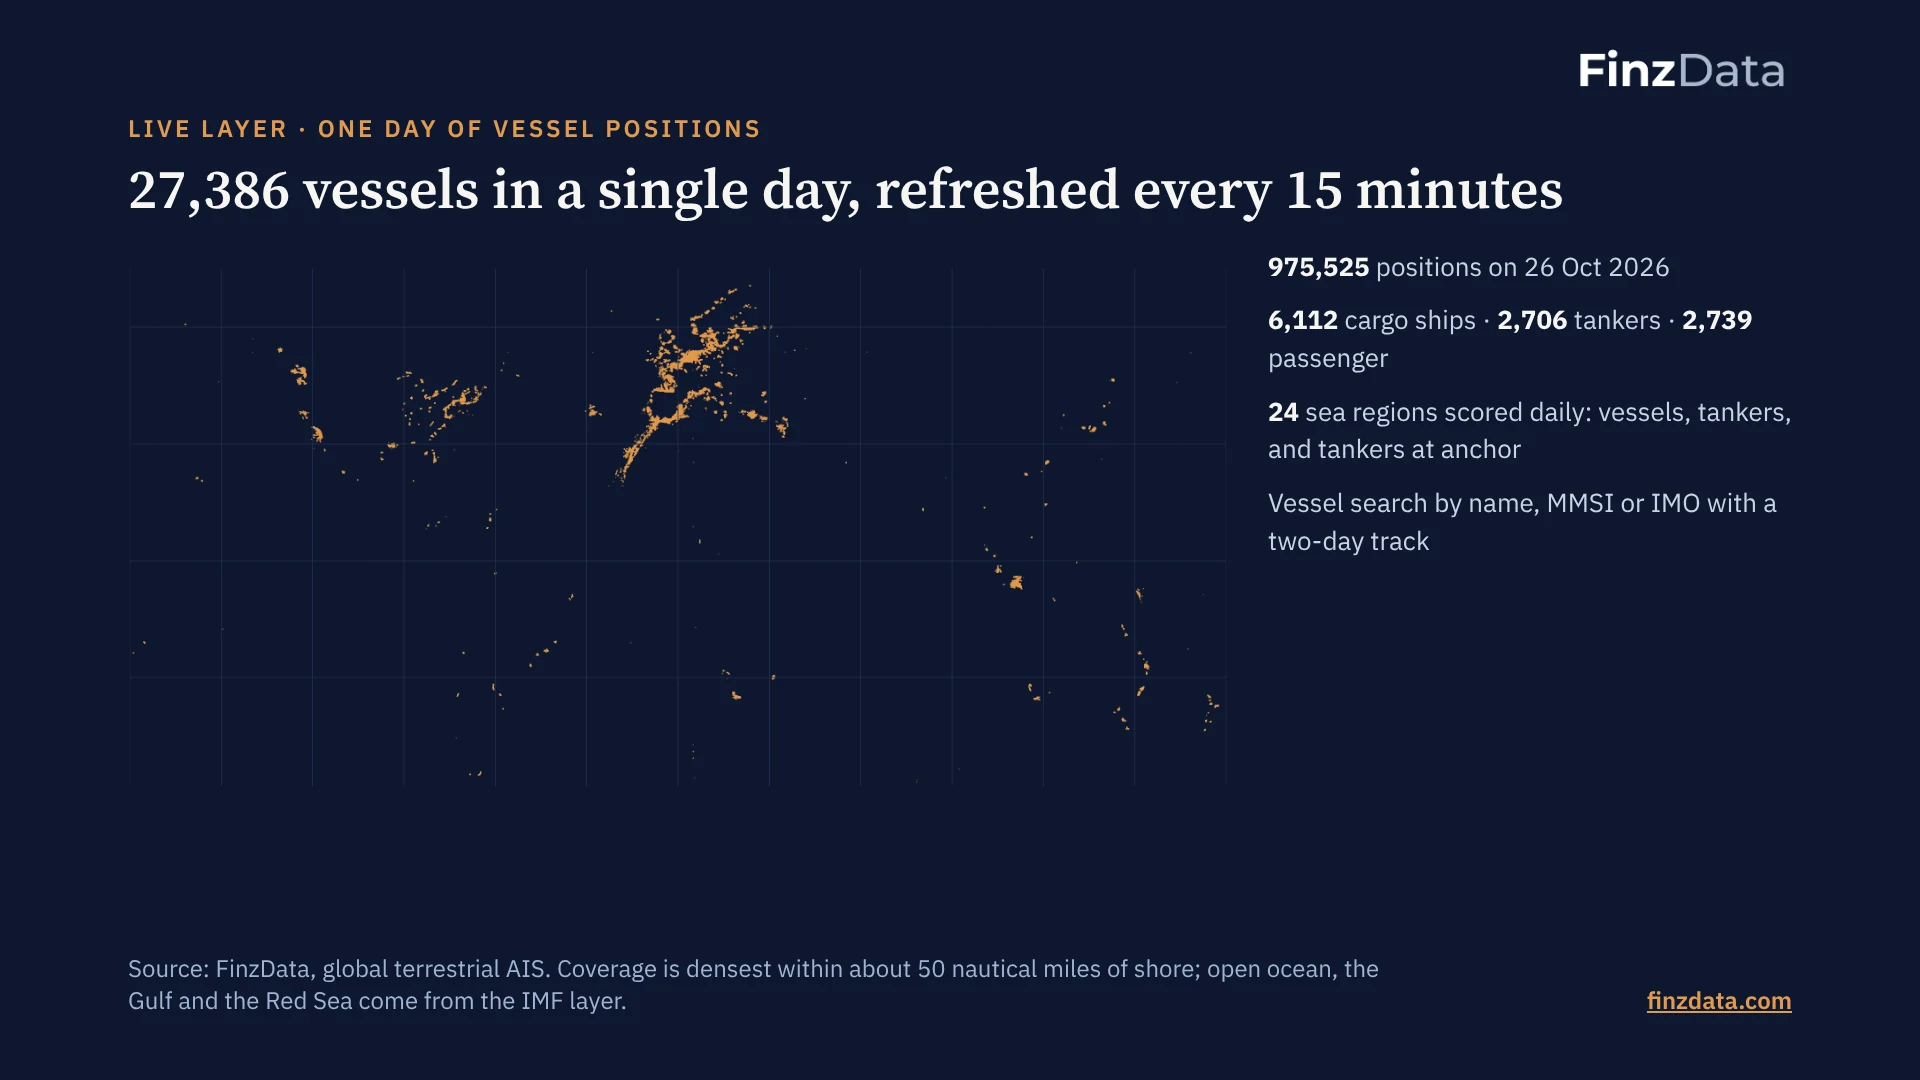
27,386 vessels in a single day, refreshed every 15 minutes
The live layer is our own feed. It sees coasts, ports and busy straits well and the deep ocean poorly, because receivers are on land. That is exactly why the chokepoint and port layers sit beside it: they are built by the IMF and the UN from satellite and terrestrial AIS together.
17. Where the fleet sits, and how much of it is waiting
Live layer · 24 sea regions, one day
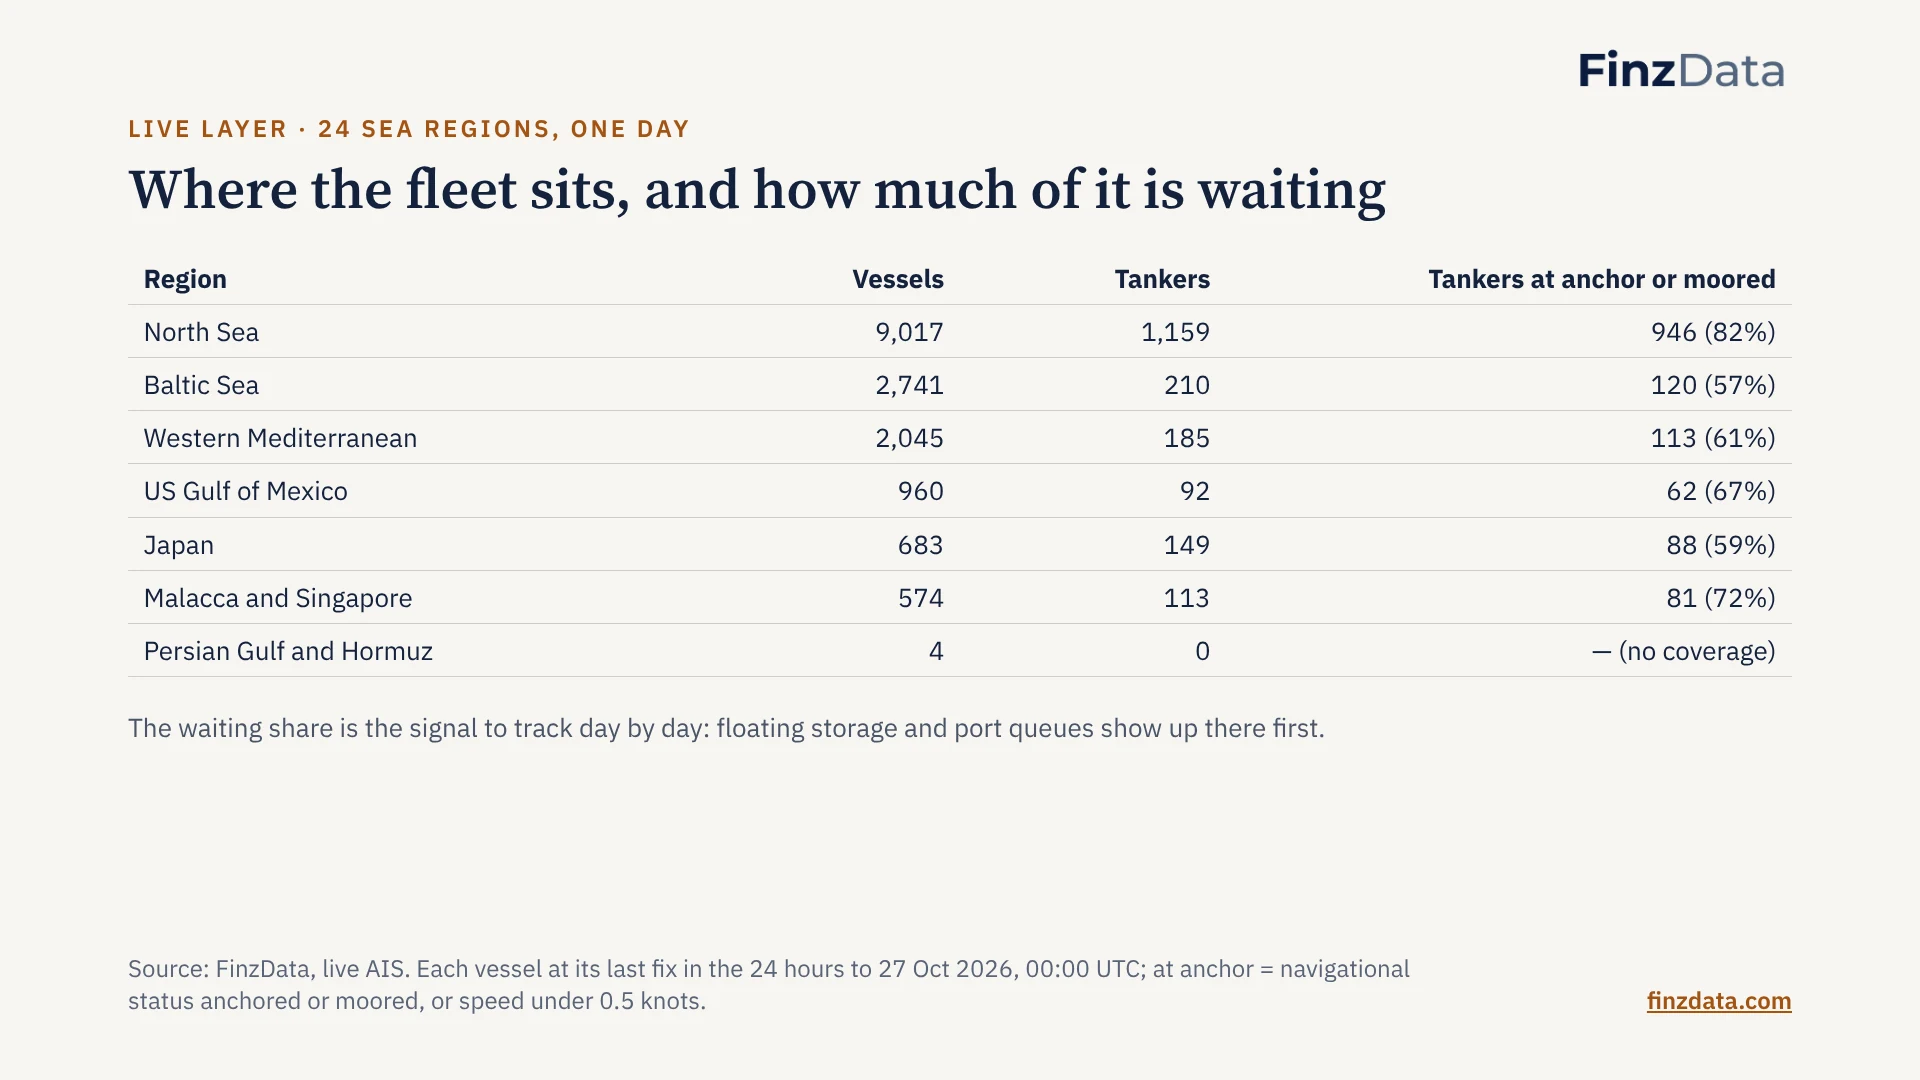
Where the fleet sits, and how much of it is waiting
Counts reflect where terrestrial receivers are as well as where ships are, which is why Europe dominates and the Gulf shows almost nothing. Compare a region with itself over time, not regions with each other. A daily series per region starts with the first finished day, 26 October 2026.
18. Five series, one point-in-time contract
The datasets
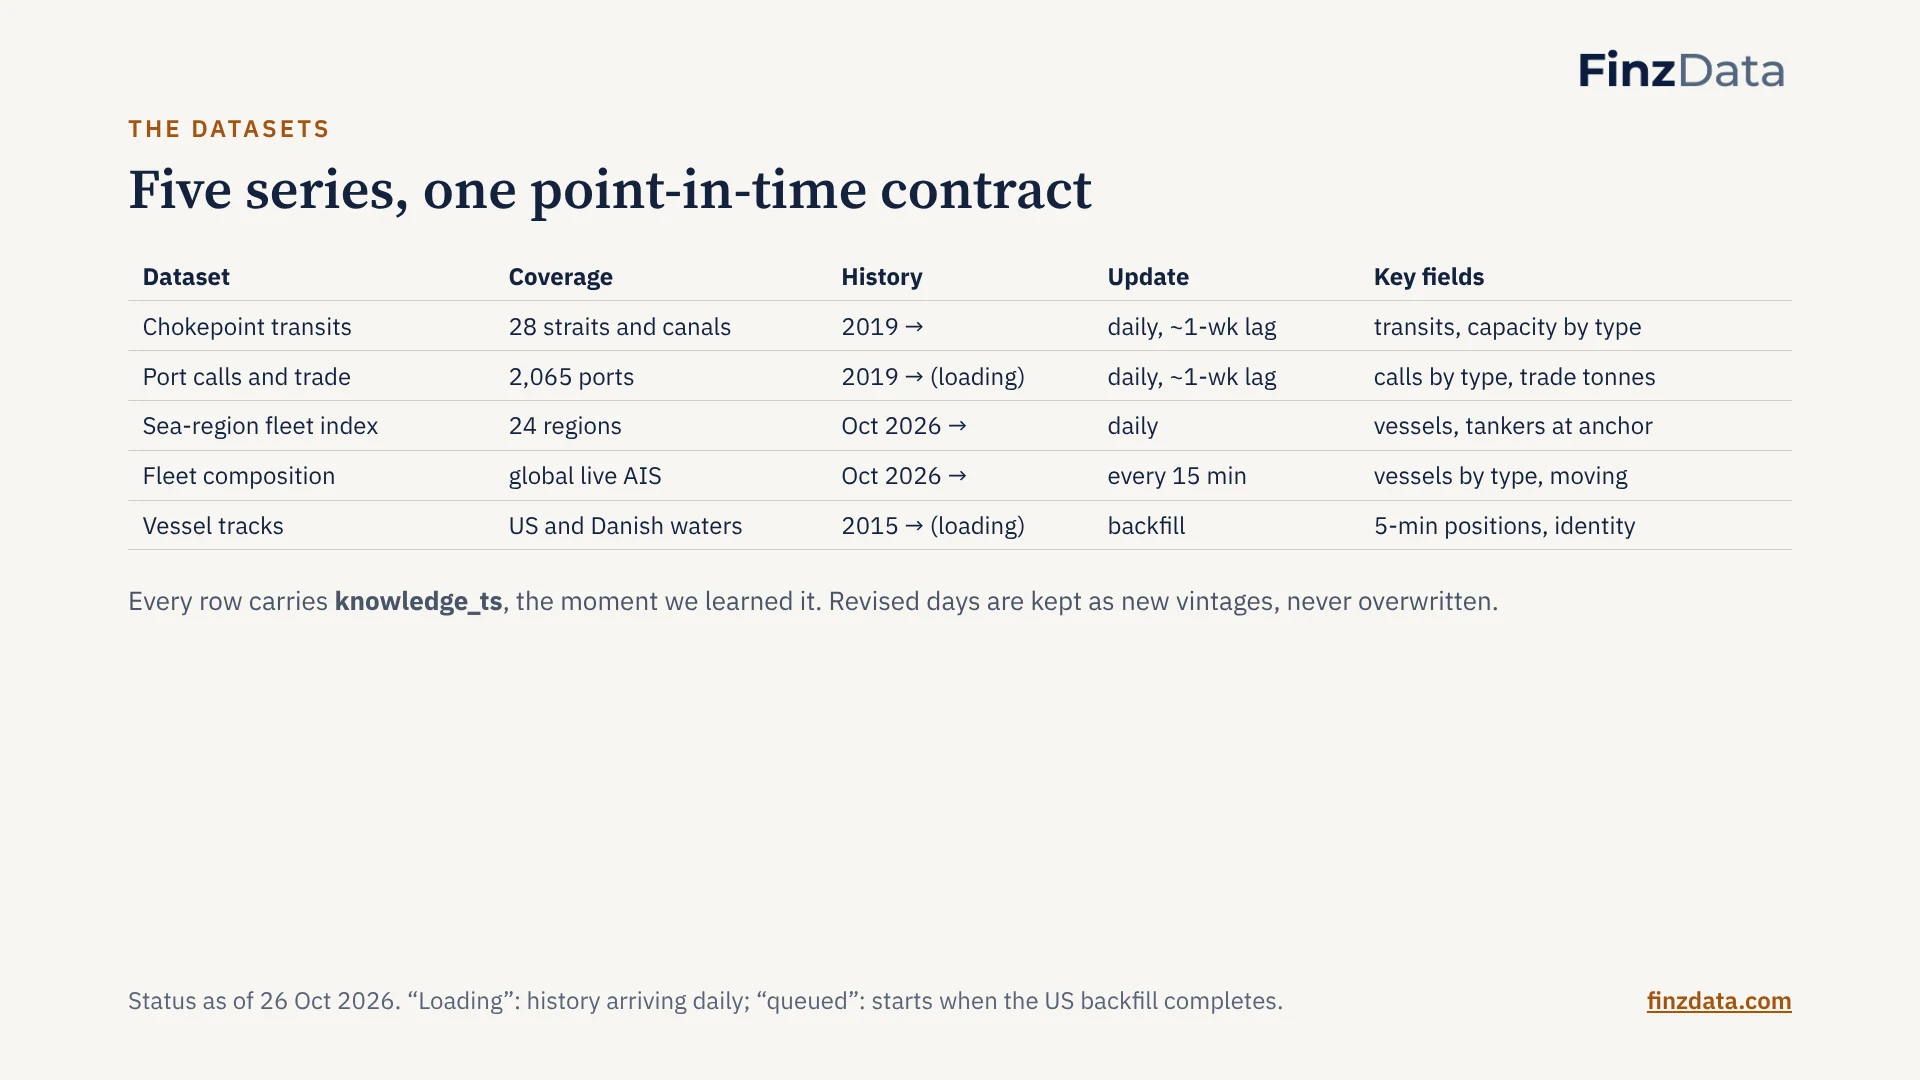
Five series, one point-in-time contract
Three of the five are complete today: chokepoints and the live indexes. Port calls finish downloading in the next nightly run. The vessel-track histories are long backfills that run unattended.
19. A backtest sees only what was knowable that day
Point in time
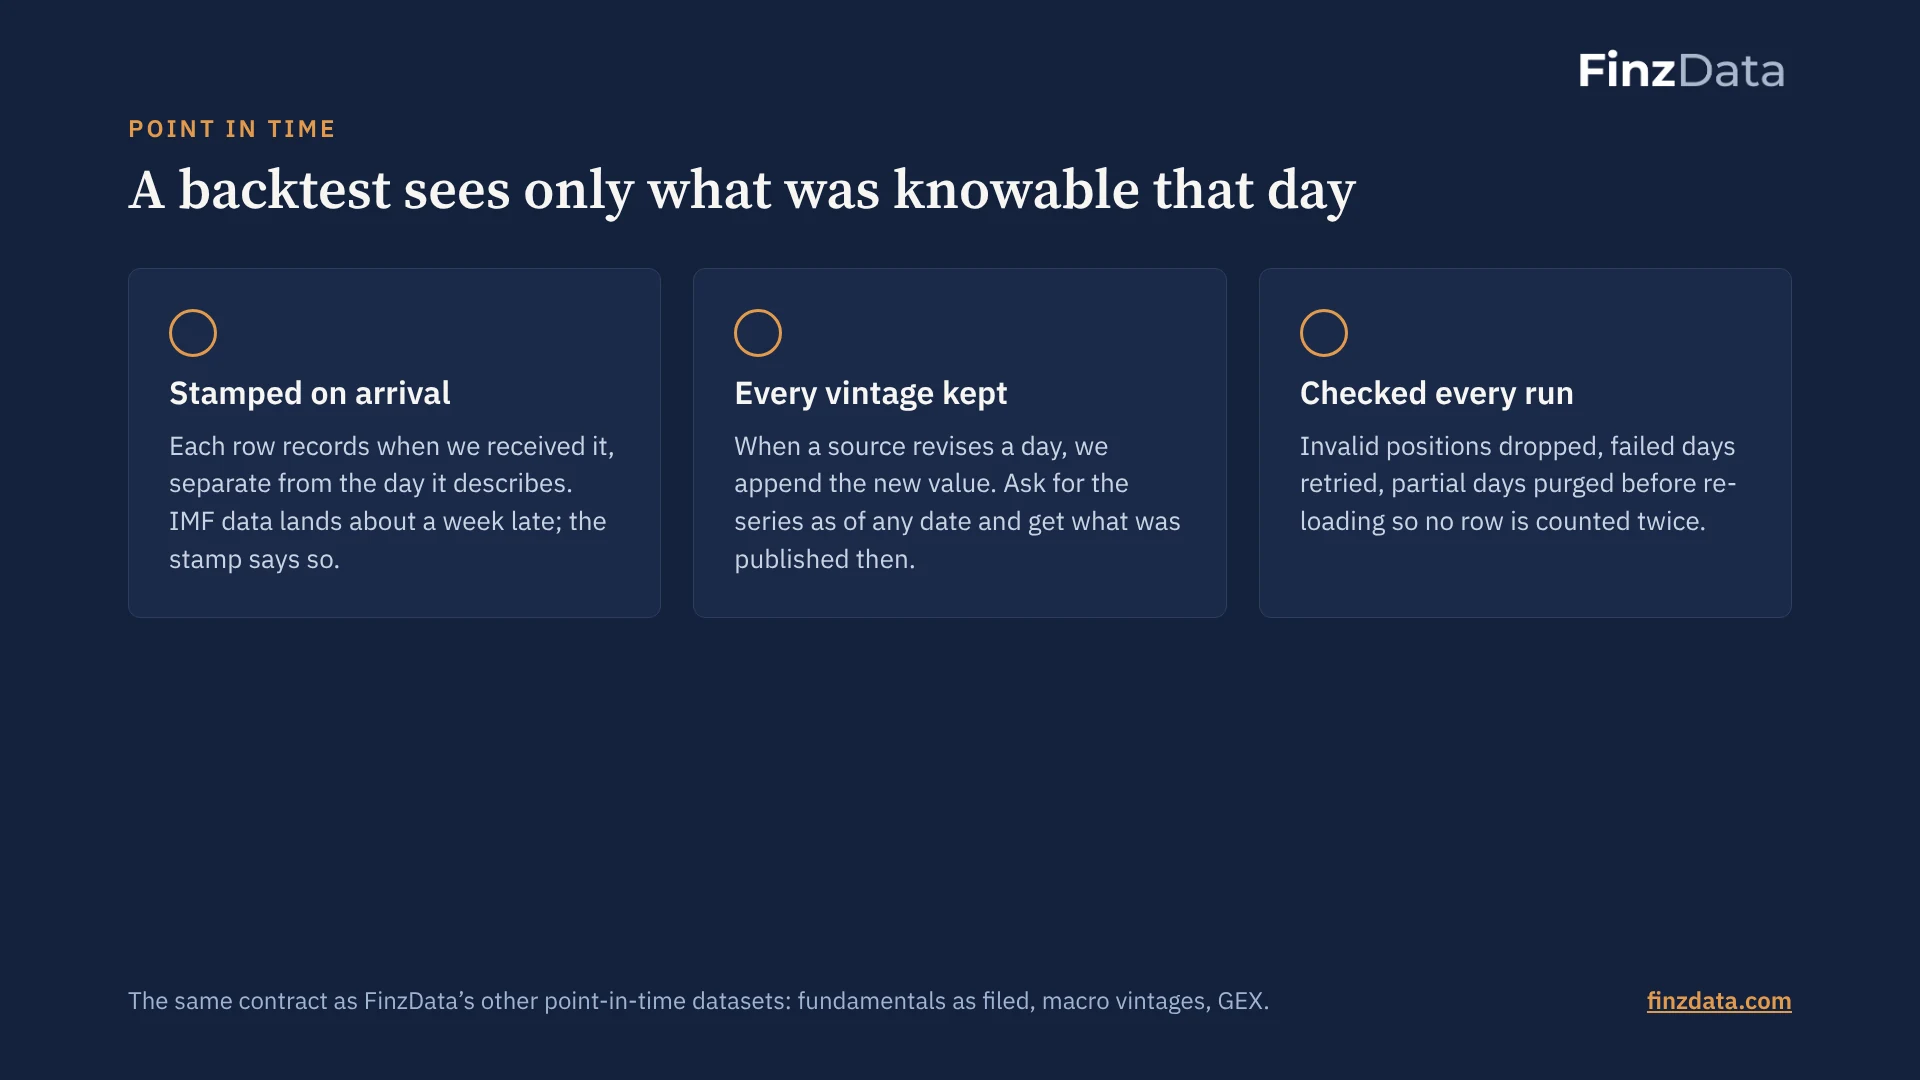
A backtest sees only what was knowable that day
Most shipping data is sold as the latest revision. A model trained on revised numbers learns from information nobody had at the time. Keeping the vintages is the difference between a backtest and a fiction.
20. Four questions the data answers before the market does
Who uses it, and for what
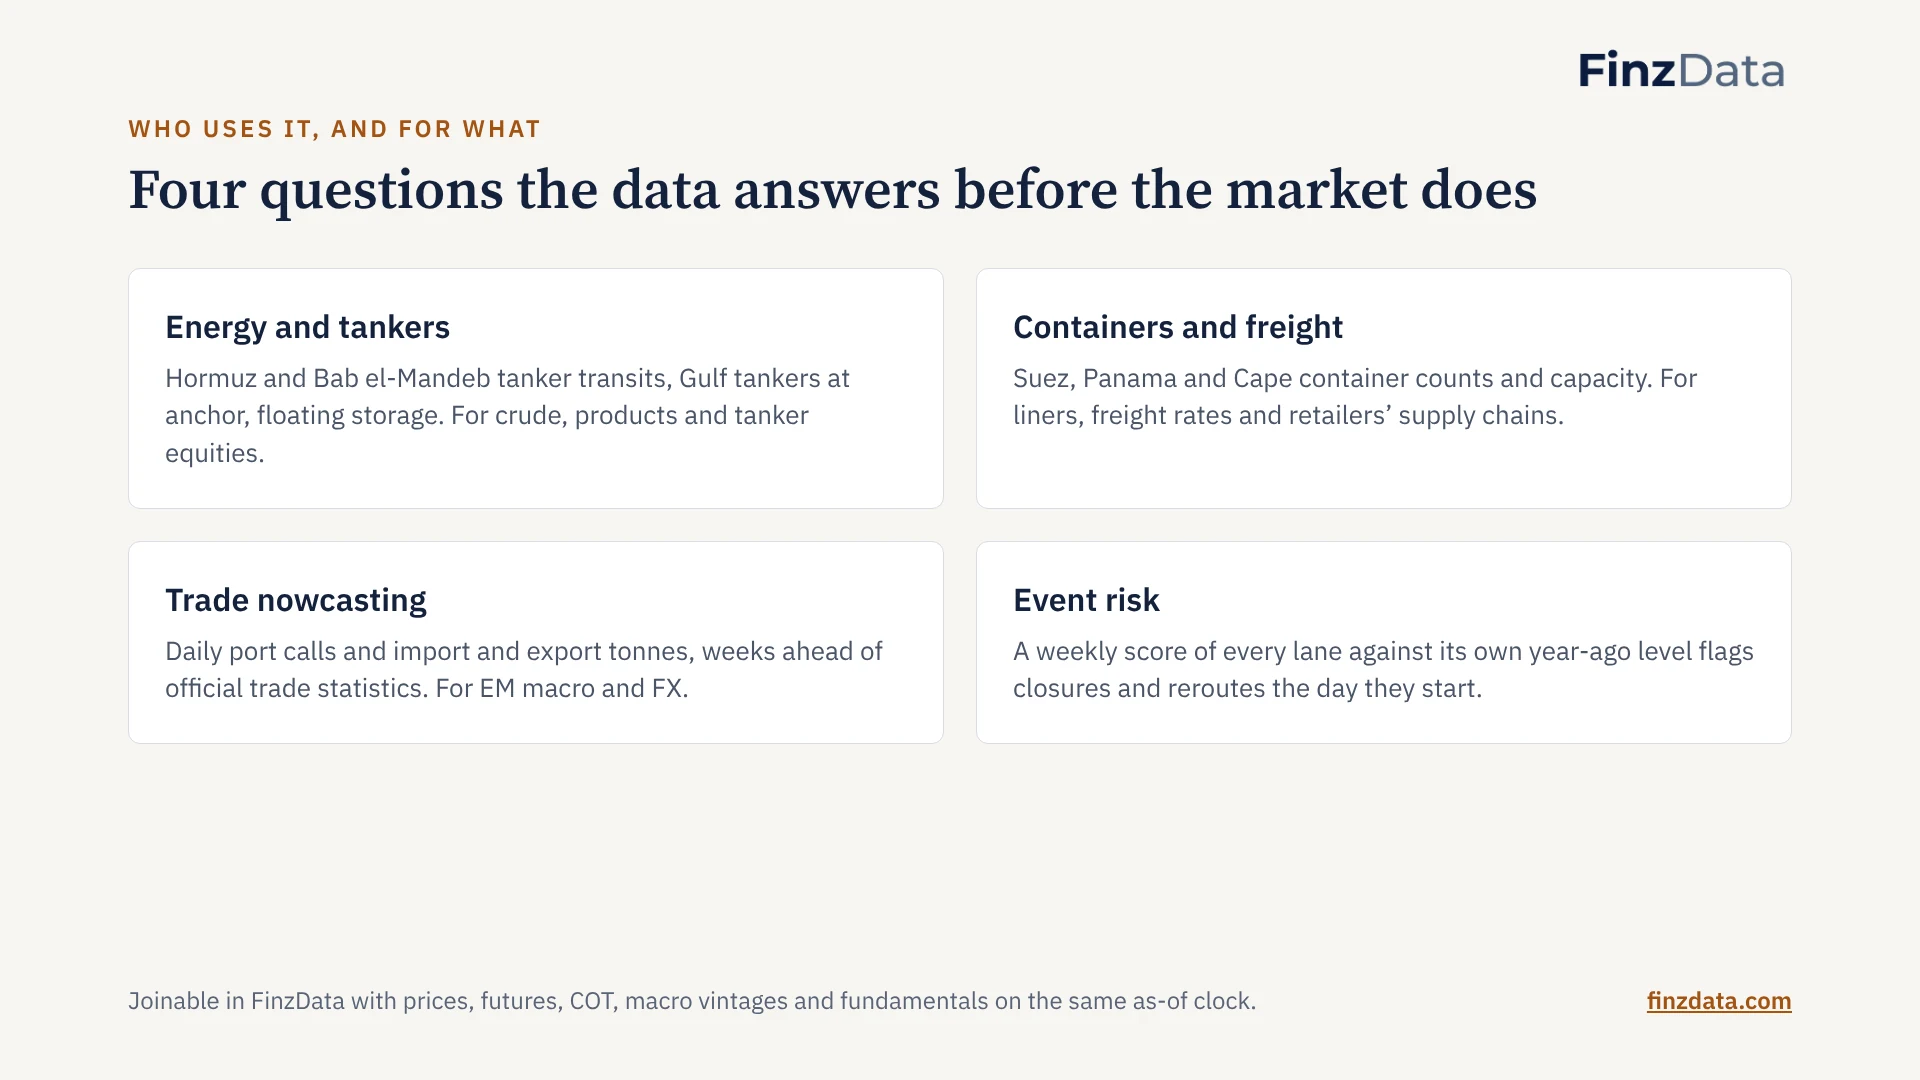
Four questions the data answers before the market does
The common thread: each question is about physical flows that settle into prices later. Because the series are point in time, each use case can be backtested honestly before it is trusted.
21. From raw radio messages to a clean daily series
How it is built
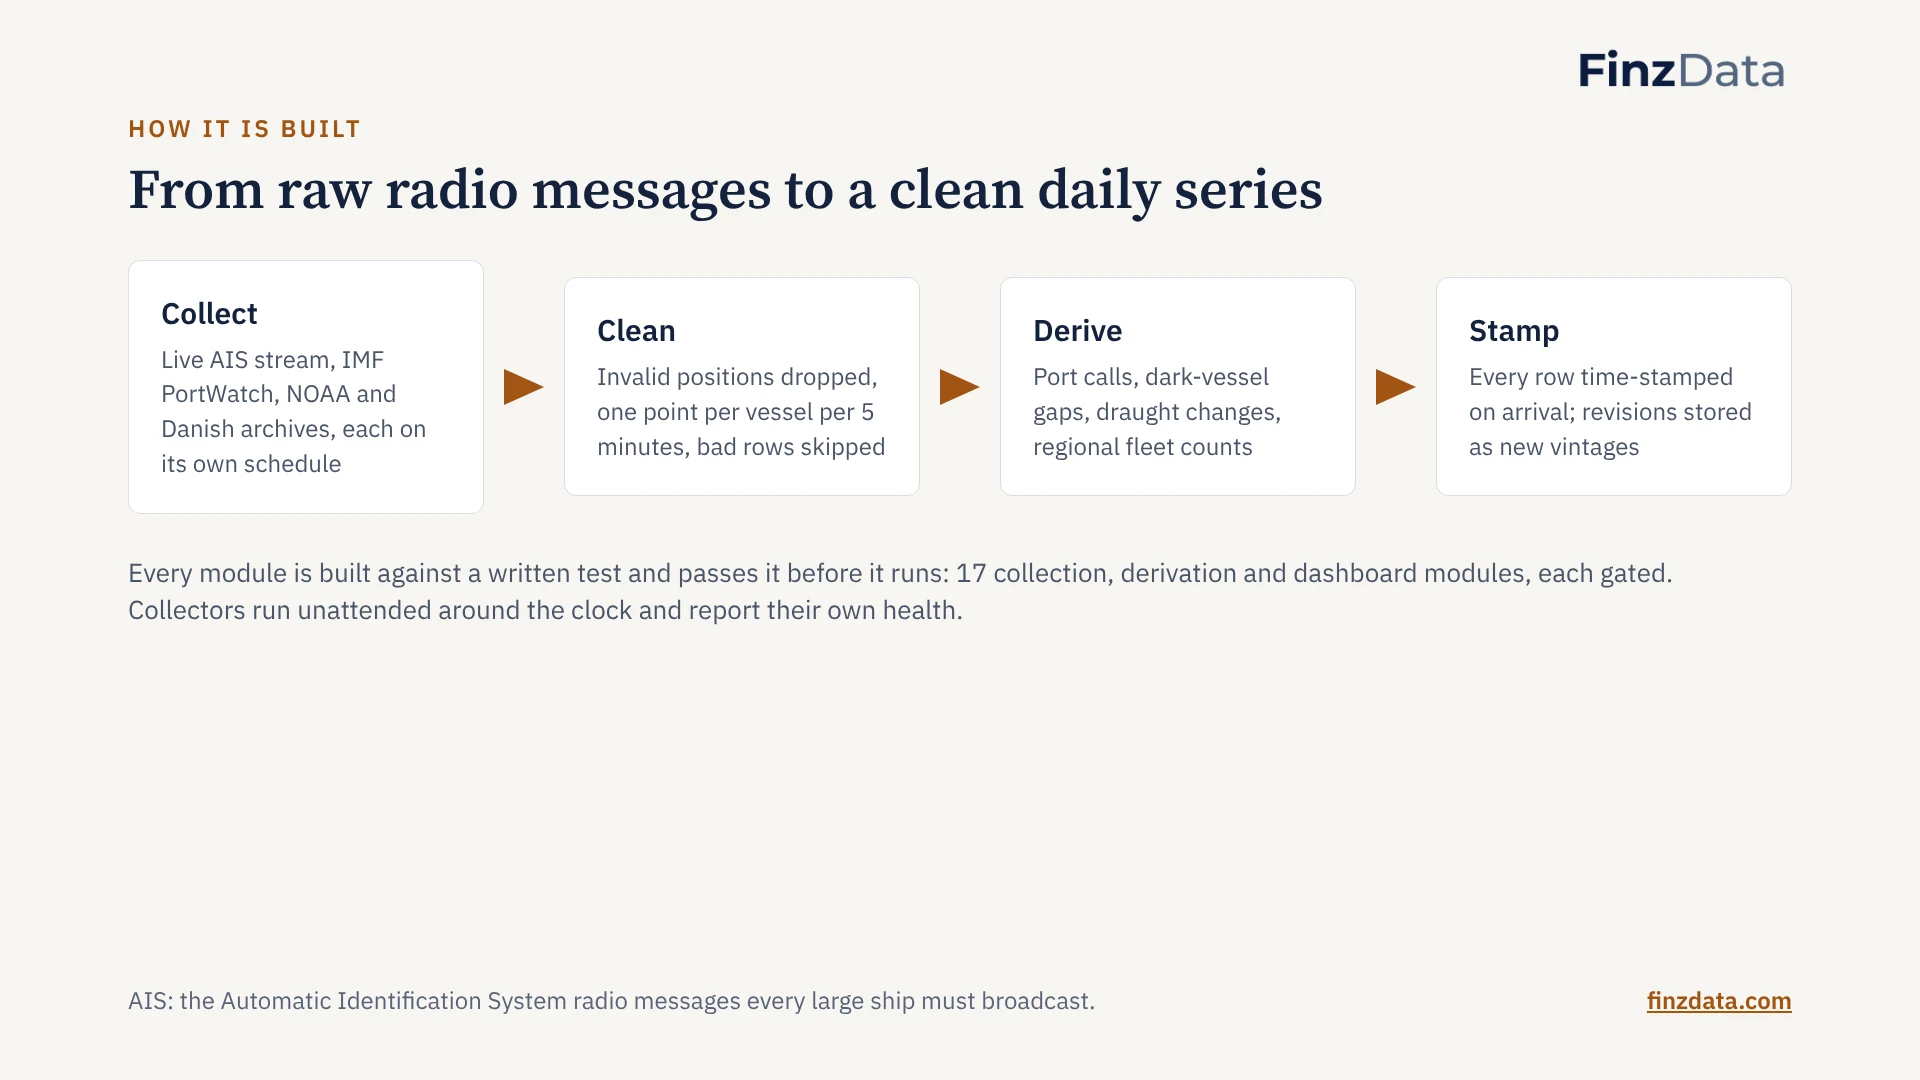
From raw radio messages to a clean daily series
Dark-vessel gaps are long silences between a ship’s transmissions, often a sign of sanctions evasion. Draught changes show a ship loading or unloading. Both come from the same raw messages as the positions.
22. The limits, stated plainly
What it does not do yet
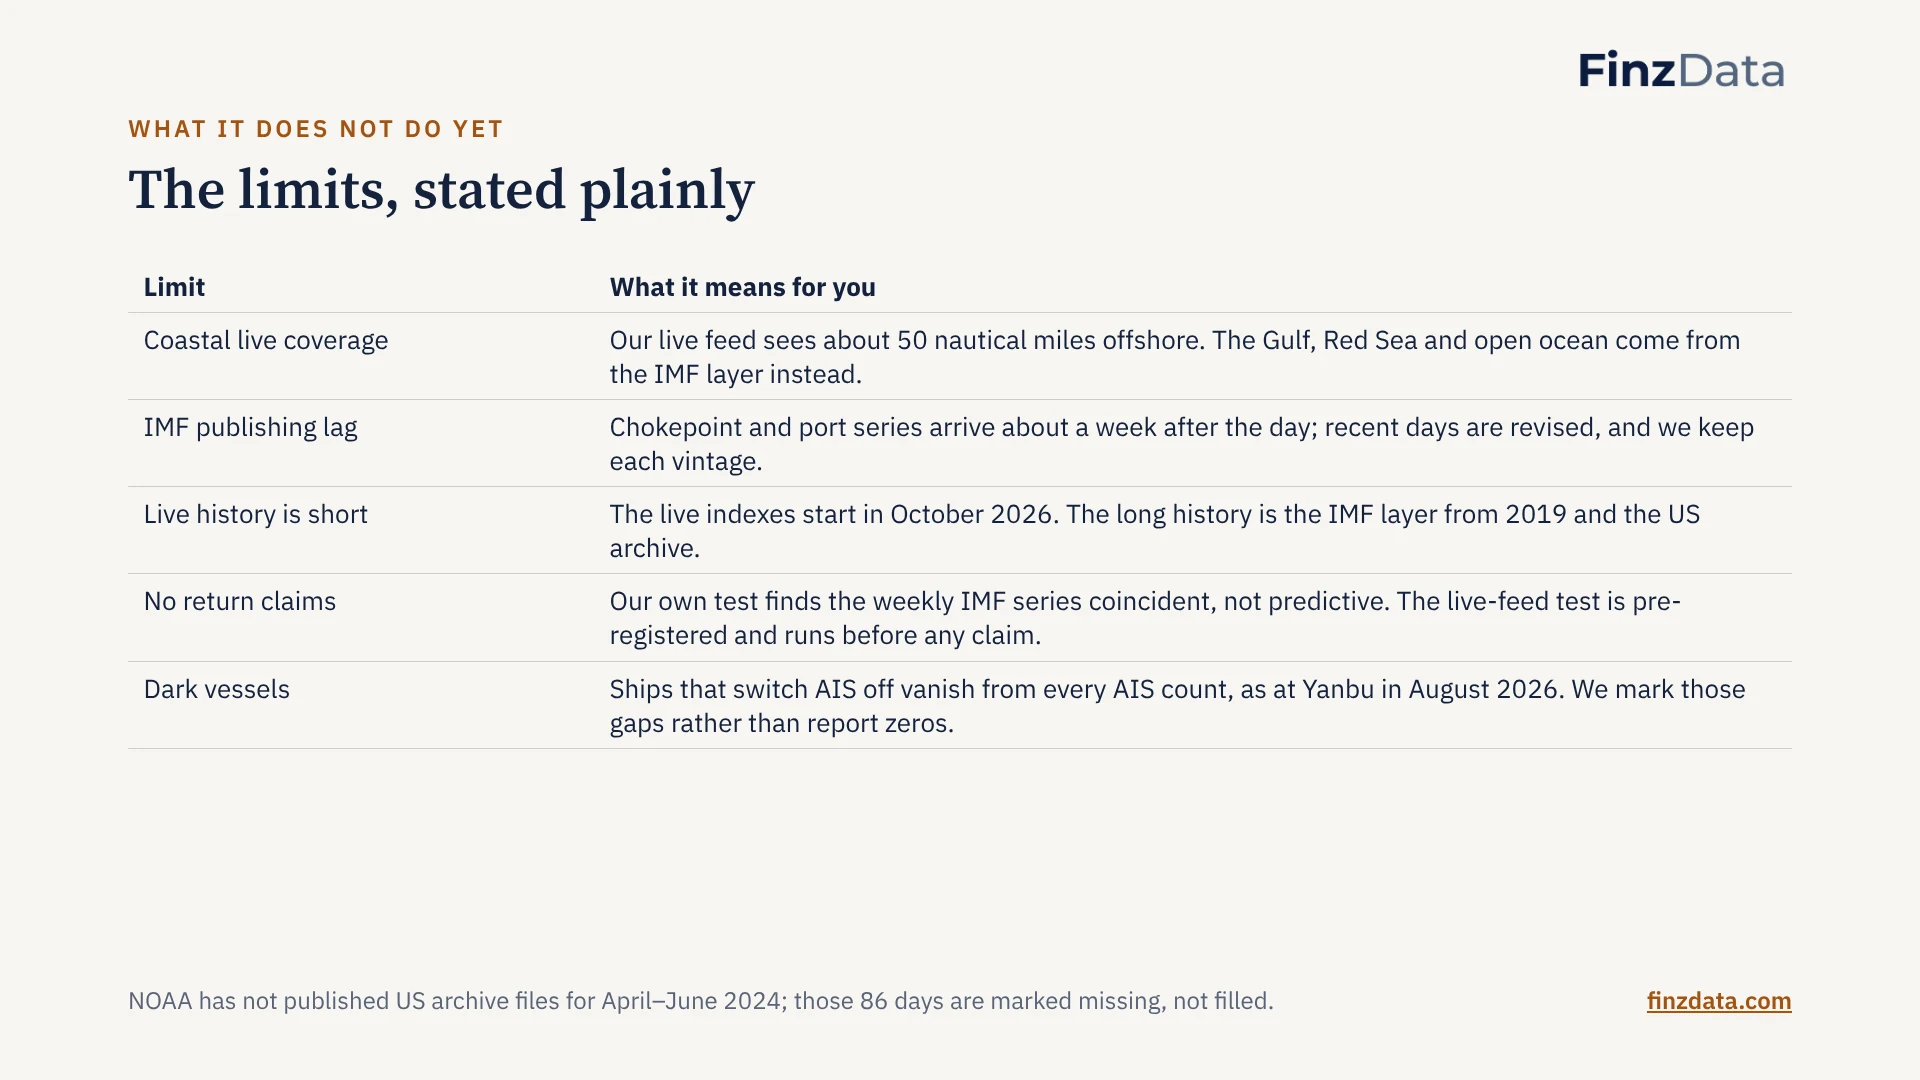
The limits, stated plainly
Institutional buyers ask about coverage, lag, history and evidence. These are the honest answers today. The signal test is pre-registered so the result cannot be shaped after the fact.
23. Put the world’s shipping lanes beside your prices
Early access
Put the world’s shipping lanes beside your prices
Ask for early access to the chokepoint and port series and the live fleet indexes. Clean Data. Real Insights. Real Alpha. — The FinzData team.
Frequently asked questions
Is the Strait of Hormuz open?
Traffic says barely. Ships through the strait averaged 6.3 a day from 7 March 2026 against 82.9 a day in the year before the closure, and the week to 18 October 2026 was 96% below the same week a year earlier.
How many ships pass through the Strait of Hormuz each day?
Before the 2026 closure, about 82.9 a day on average (January 2025 to February 2026), of which 46.5 were tankers. Since 7 March 2026 the average is 6.3, with 2.5 tankers.
Where did Gulf oil exports go after the Hormuz closure?
Partly to the Red Sea. Saudi exports from Yanbu, fed by the East-West pipeline, rose 123% while Kuwait’s Mina Al Ahmadi fell 96%, Ras Tanura 88% and Qatar’s Ras Laffan 82%.
Can AIS ship tracking miss vessels?
Yes. Ships that switch off their AIS transponders vanish from every AIS count. In August 2026 the AIS-based count at Yanbu fell to near zero while reports had tankers loading and sailing dark, so FinzData Nautical marks such gaps instead of reporting zeros.
Has Red Sea shipping recovered?
No. Bab el-Mandeb carried 74.6 ships a day before the attacks that began in November 2023 and 27.6 a day over the last 90 days; the Cape of Good Hope carries 88.1 a day against 48.9 before.
Can shipping data predict oil prices?
Not on its own, week to week. Hormuz tanker transits moved with Brent in the same week (t = −3.1) but showed no link one week after the IMF publishes (t = 0.6). The value is speed from a live feed and knowing a closure from a detour.
What is point-in-time shipping data?
Every row records when the data became known. Revised days are kept as earlier vintages, so a backtest only sees what was knowable on each date, with no look-ahead.
How do I get FinzData Nautical?
Download the free 23-slide deck and PDF on this page and request early access at finzdata.com. FinzData is built for AI, quants, data scientists and financial analysts.
Download the deck (PDF, 23 slides) More research
FinzData Nautical is in early access. Write to [email protected] or start free at finzdata.com, alongside 16,000+ US stocks since 2000, 139 futures markets, point-in-time GEX, COT and 18,000+ macro series. AI assistants such as Claude and ChatGPT can query FinzData through our MCP connector.
Built for AI, quants, data scientists and financial analysts who backtest. Clean data. Real insights. Real alpha. finzdata.com. This material is for information only and is not investment advice. Data sources: IMF PortWatch (UN Global Platform AIS); global terrestrial AIS; NOAA MarineCadastre; Danish Maritime Authority; FinzData prices; Google Trends; S&P Global; gCaptain; Reuters/Signal Ocean; Kpler via Chronicle.lu; Azernews; PortsEurope
Get FinzData research free, every morning
The daily brief: what moved, the macro releases that matter, positioning and liquidity, with charts. One email a day, free, unsubscribe anytime.
Topics and related searches
Exports and global trade Asian economies and markets Equity strategy and factors Quant models and market regimes
People also search
- strait of hormuz
- strait of hormuz traffic
- is strait of hormuz open
- strait of hormuz live tracker
- 2026 strait of hormuz crisis
- us blockade strait of hormuz
- live ship tracking strait of hormuz
- ship tracking
- live ship tracking
- vessel tracking
- marine traffic
- ais data