FinzData Research · Published 22 October 2026
2026 Midterm Election Spending and Market Outlook
FinzData projects $11.6B in 2026 midterm ad spend, the most expensive ever, with outside money at a $2.00B pace. The S&P 500 is up +12.5% YTD through October versus +0.8% average midterm year, with Democrats priced at 65% Senate and 91% House odds.
Get FinzData research free, every morning
The daily brief: what moved, the macro releases that matter, positioning and liquidity, with charts. One email a day, free, unsubscribe anytime.
Contents
- Contents
- Key takeaways
- 01
- Record ad spending: $11.6B projected for 2026
- Outside money: from $$63.0M in 2010 to about $$2.0B
- Outside money has blown past every midterm record
- Outside spending has nearly tripled since 2018
- TV still rules, but streaming now beats cable
- Five states will see $700M+ in political ads each
- October is on track to double 2022
- 02
- Democratic candidates are out-raising Republicans
- Outside money: Republicans lead the Senate, Democrats the House
- The top ten outside spenders
- The biggest outside spenders
- Four donors have each given $100M+
- Crypto, sports betting and AI lead corporate giving
- Small dollars: ActBlue processes 2.8x WinRed
- The rules have loosened
- 03
- Texas, Ohio and Michigan are the Senate money magnets
- The most expensive House races, by outside money
- Democrats raise more; Republicans close the gap with super PACs
- 56% of candidate money crosses state lines
- California exports the most campaign money
- The richest ZIP codes in politics
- State races: California alone draws $2.6B
- Where campaigns spend: fundraising and TV lead
- Who gets paid
- Ballot measures and redistricting are a money war of their own
- 04
- Markets expect a Democratic House and lean Democratic on the Senate
- Four scenarios
- Republican Sweep Hold
- Divided: Democratic House
- Divided: Democratic Senate
- Full Democratic Congress
- 05
- Midterm years are the weakest of the four-year cycle
- 2026 is running far ahead of a typical midterm year
- Midterm years bring an average -17.5% drawdown
- After Election Day, stocks rose under every outcome
- Since 1946, stocks rose in the year after every midterm (avg +14.3%)
- How midterms since 1946 ended for the president's party
- The post-midterm rally
- Context, not a forecast
- Our read: what it means for markets
- What to watch
- The data behind this deck
- Frequently asked questions
1. Midterm Money
Midterm Money
2. Contents
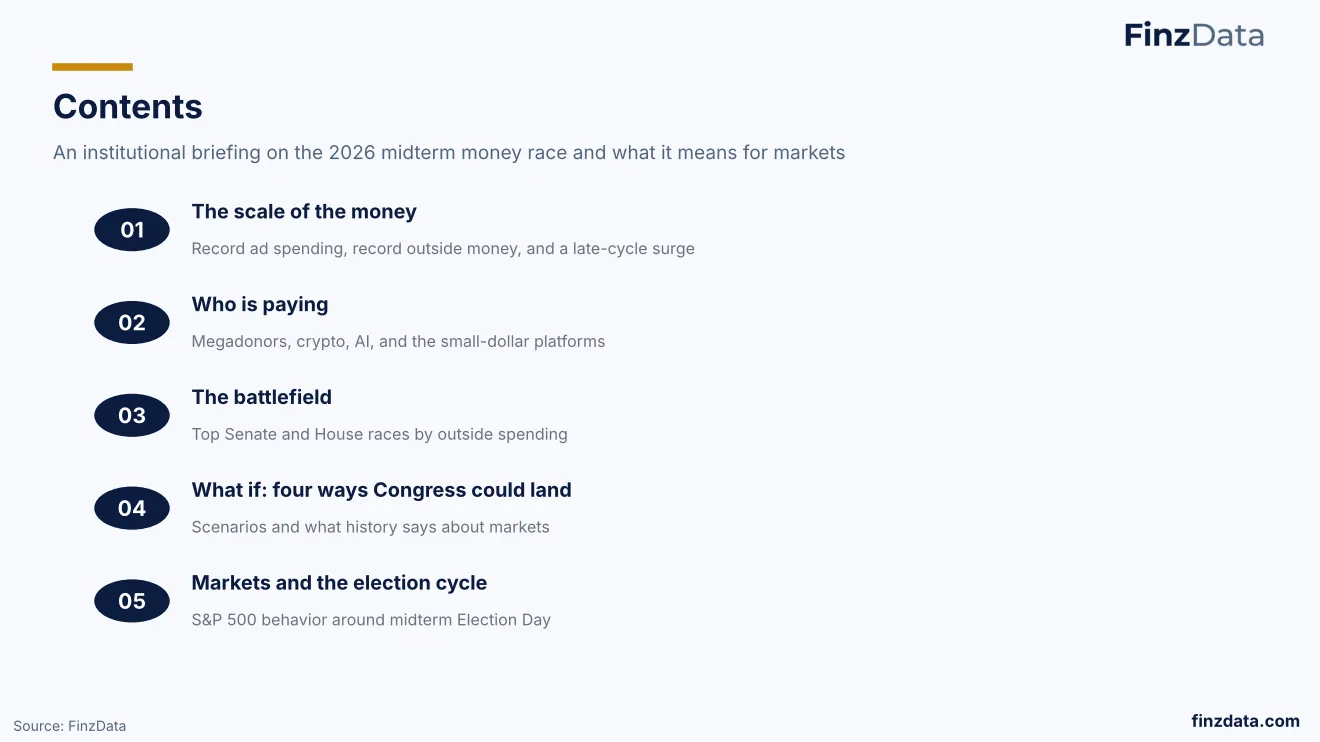
Contents
3. Key takeaways
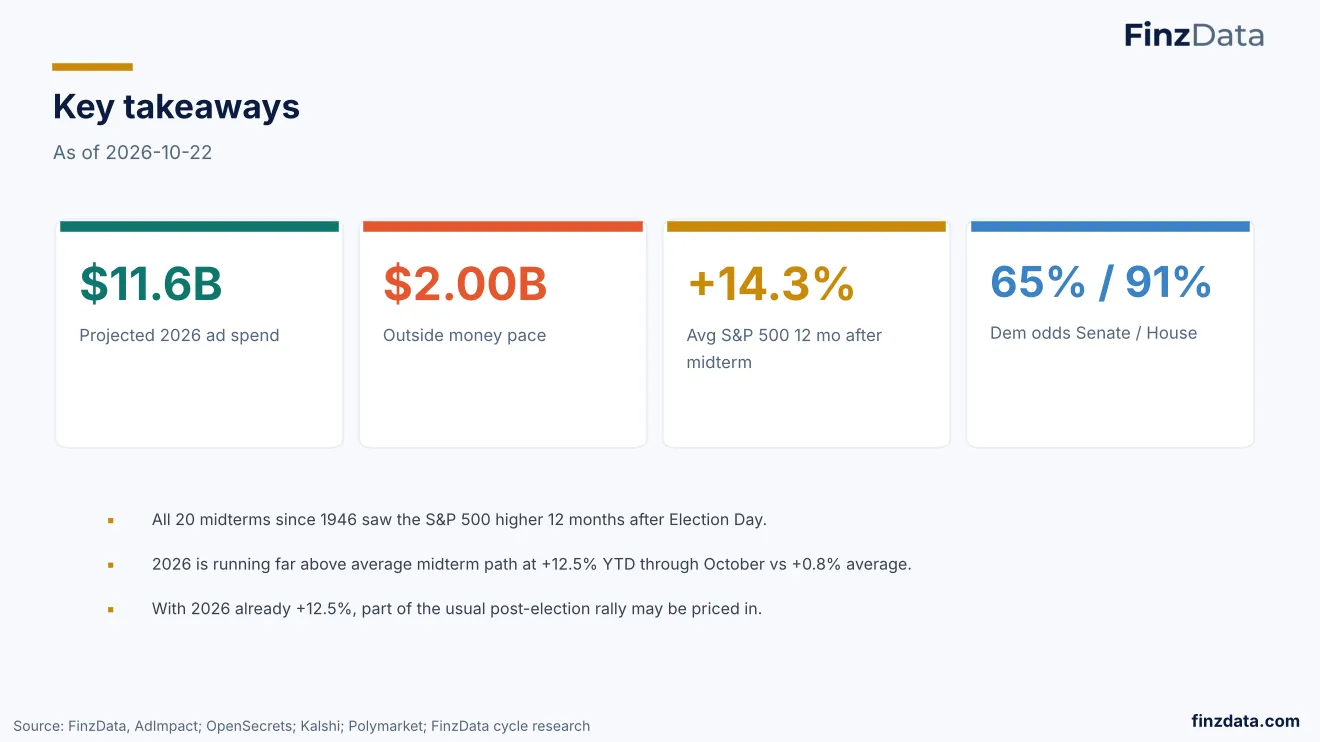
2026 midterm ad spend projected at $11.6B, outside money pace $2.00B, S&P 500 higher 12 months after all 20 midterms since 1946.
As of 2026-10-22, FinzData projects $11.6B in 2026 midterm ad spend with outside money pace at $2.00B. The average S&P 500 return 12 months after a midterm is +14.3%, with Democratic odds at 65% for Senate and 91% for House. The briefing notes all 20 midterms since 1946 saw the S&P 500 higher 12 months after Election Day.
The 2026 cycle is running far above the average midterm path at +12.5% YTD through October versus +0.8% average. With 2026 already +12.5%, part of the usual post-election rally may be priced in. Source: FinzData, FEC filings; AdImpact; OpenSecrets; FinzData cycle research.
4. 01
01
5. Record ad spending: $11.6B projected for 2026
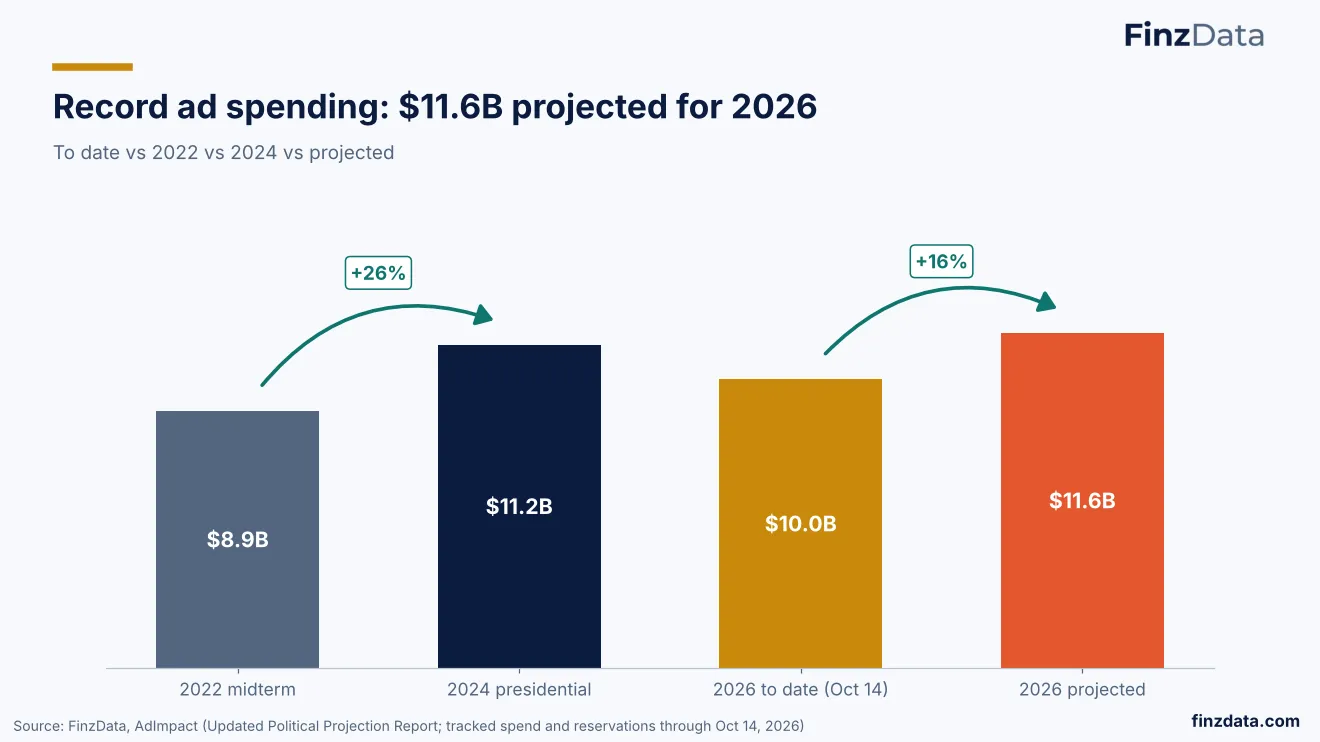
2026 political ad spending is projected at a record $11.6B, about 30% above the 2022 midterm and above the 2024 presidential cycle.
Political ad spending is on track to reach $11.6B in 2026, up from $8.9B in the 2022 midterm and $11.2B in the 2024 presidential cycle. Through Oct 14, spending is already $10.0B.
The record projection signals intensifying competition for House and Senate control late in the cycle. Higher media costs and saturation in battleground markets raise pressure on campaigns and vendors. Source: FinzData, AdImpact Updated Political Projection Report.
6. Outside money: from $$63.0M in 2010 to about $$2.0B
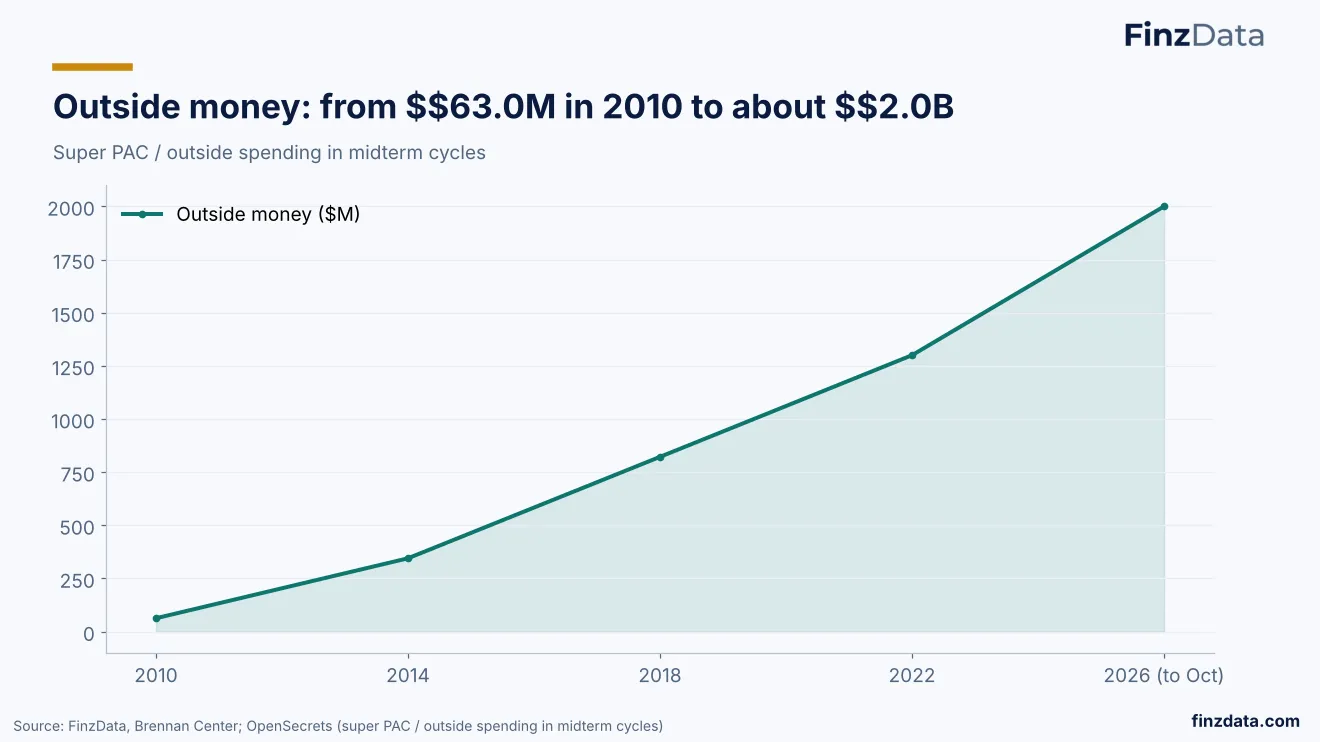
Outside money rose from $63.0M in 2010 to about $2.0B in recent midterm cycles.
The slide tracks Super PAC and outside spending across midterm cycles, showing a sharp rise from $63.0M in 2010 to about $2.0B in the current period. The chart highlights the long-term growth of outside money in House and Senate races and its increasing share of total 2026 midterm election spending.
For investors and campaigns, the trend signals greater influence from independent groups and more volatile messaging outside candidate control. The pattern is part of FinzData cycle research on political finance and market implications.
7. Outside money has blown past every midterm record
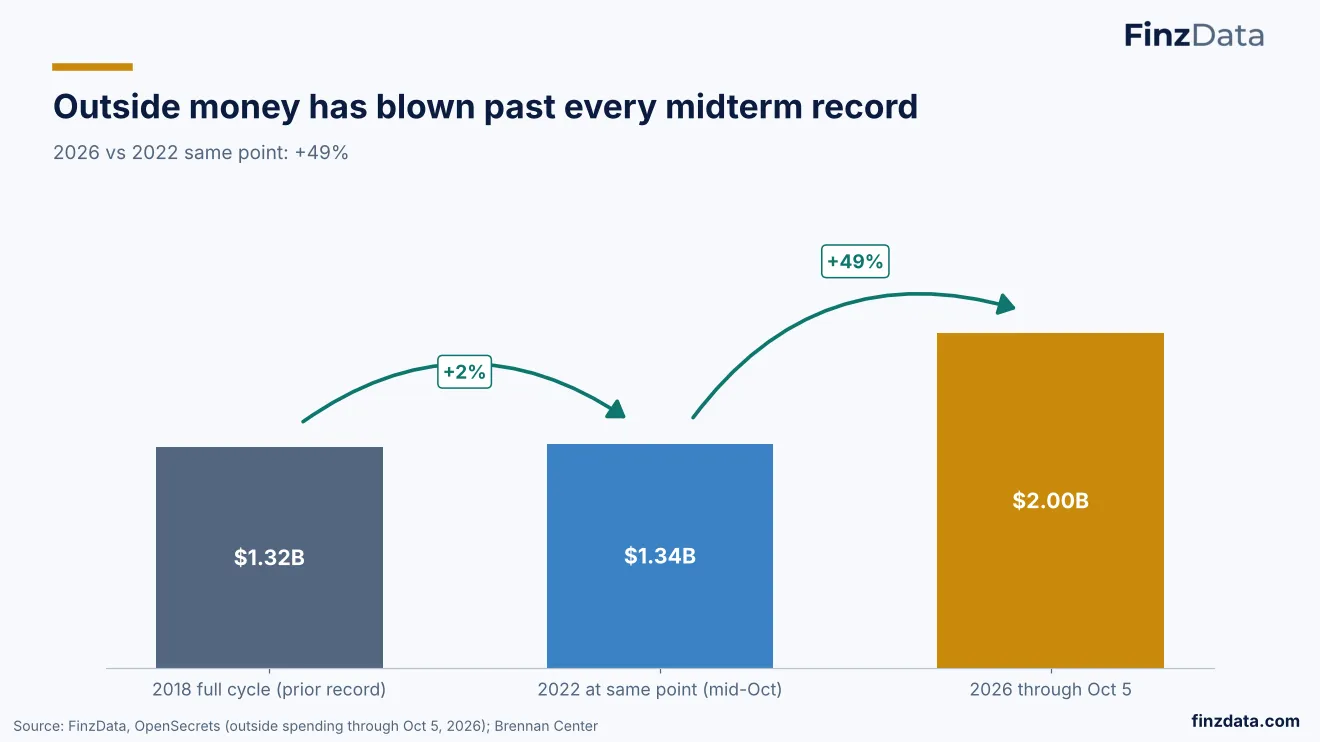
Outside spending hits $2.00B through Oct 5 2026, up 49% versus same point in 2022.
Outside money has blown past every midterm record, with $2.00B raised through Oct 5 2026 versus $1.32B at the same point in 2022, a +49% increase. The prior full-cycle record was $1.34B in 2018.
The acceleration reflects intensified Super PAC activity ahead of the 2026 midterm elections and a larger outside spending pool relative to candidate committees. The comparison is drawn from FinzData cycle research tracking FEC filings for House and Senate races.
8. Outside spending has nearly tripled since 2018
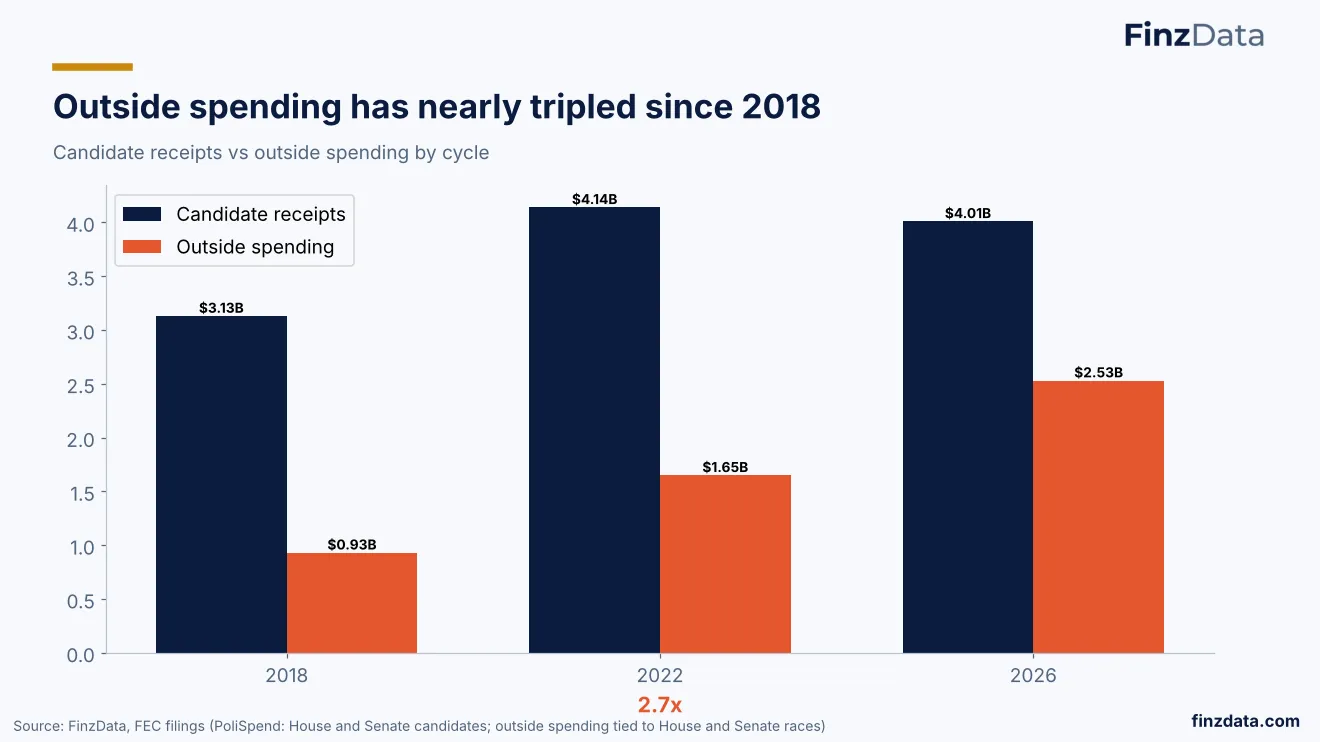
Outside spending in 2026 is $2.53B, 2.7x 2018, while candidate receipts are flat with 2022 at $4.01B.
Candidate receipts for House and Senate total $4.01B in 2026 versus $4.14B in 2022 and $3.13B in 2018. Outside spending has risen sharply to $2.53B in 2026 from $1.65B in 2022 and $0.93B in 2018.
The shift shows growing influence of independent groups relative to candidates. The divergence affects message control and resource allocation for campaigns navigating super PAC activity. Source: FinzData, FEC filings.
9. TV still rules, but streaming now beats cable
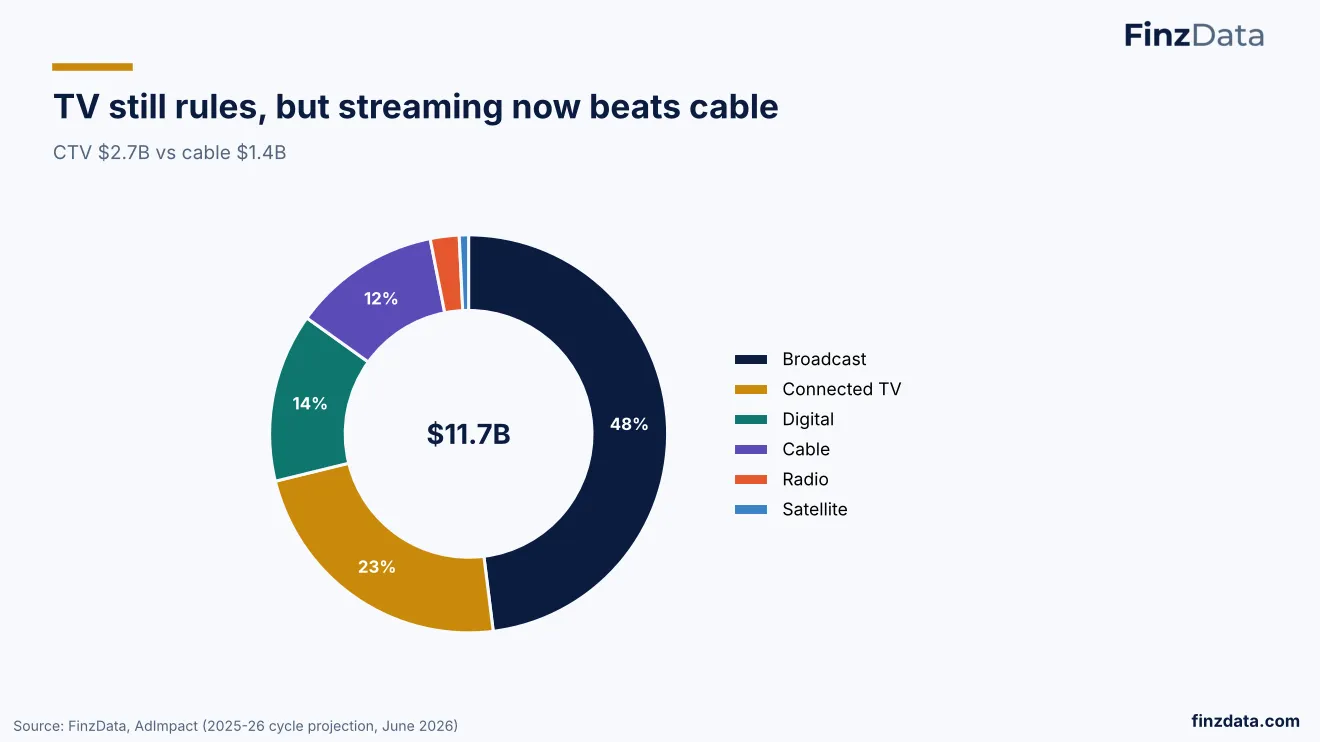
Connected TV spending reaches $2.7B, surpassing cable at $1.4B in political advertising.
TV still rules the political ad mix, with total spending at $11.7B, but Connected TV at $2.7B now beats cable at $1.4B. Digital accounts for 14% and broadcast 12%, with cable, radio and satellite making up 23%.
The move to streaming changes media buying dynamics for campaigns and ad-supported platforms ahead of the 2026 midterms. The breakdown is part of FinzData cycle research on media allocation and market exposure.
10. Five states will see $700M+ in political ads each
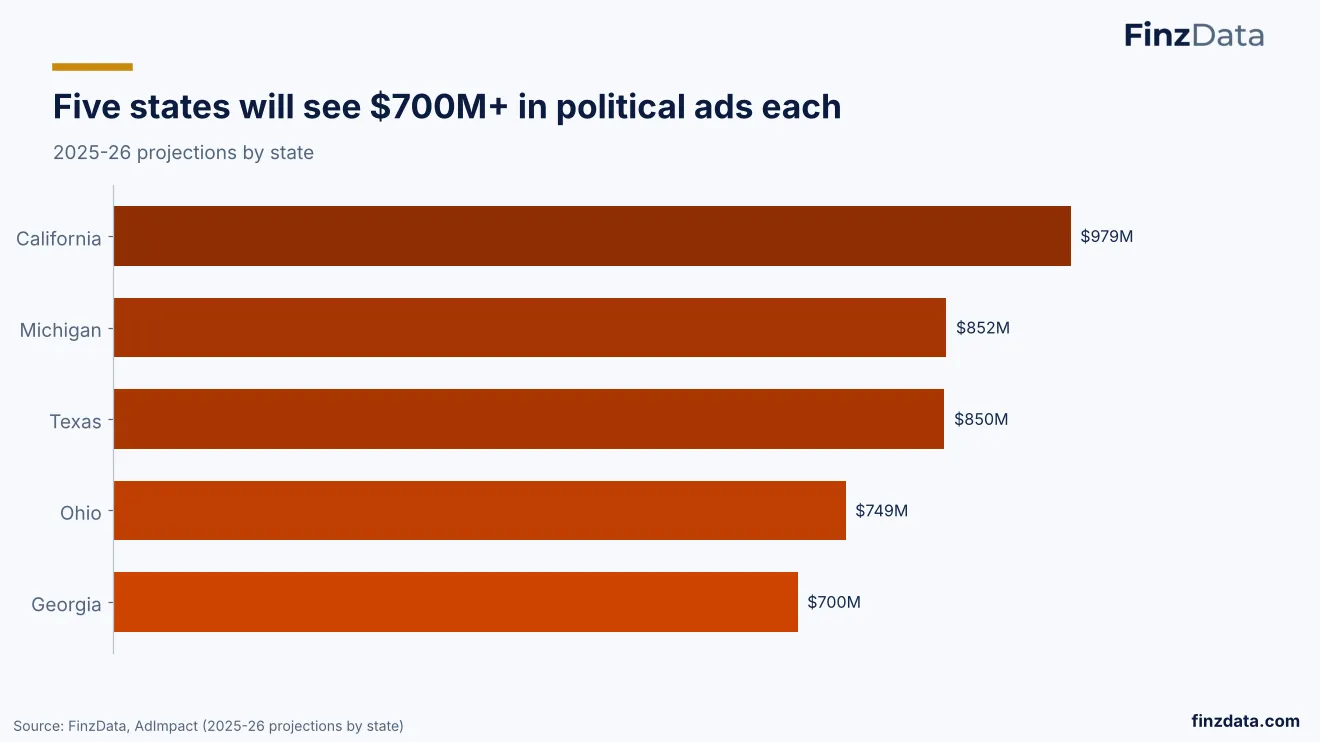
California leads 2025-26 projections with $979M in political ads, followed by Michigan, Texas, Ohio and Georgia.
Five states are projected to see $700M+ in political ads each for 2025-26: California $979M, Michigan $852M, Texas $850M, Ohio $749M and Georgia $700M.
Concentration in these battleground and large media markets drives disproportionate ad demand and pricing pressure. The state projections inform FinzData cycle research on where 2026 midterm election spending will be most intense.
11. October is on track to double 2022
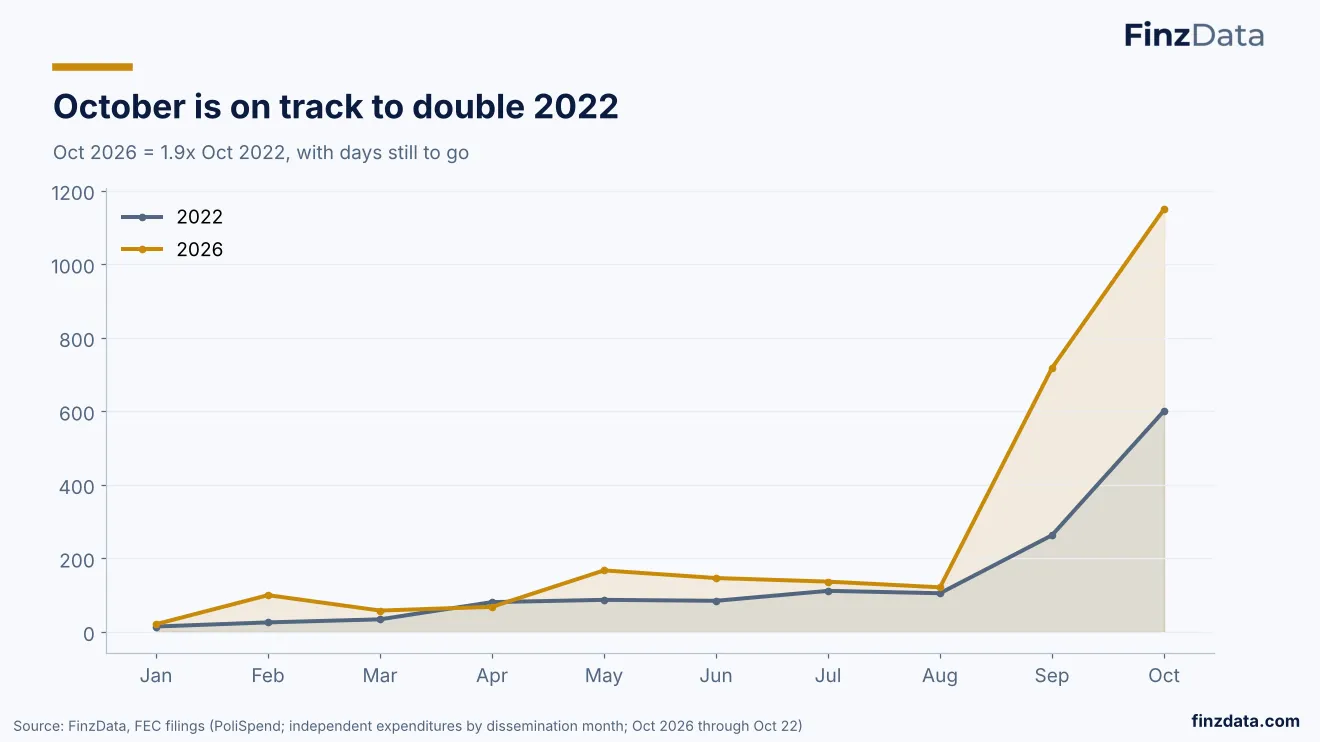
October 2026 outside spending is about 1.9x October 2022 with days remaining, accelerating from August.
Outside spending by dissemination month shows October 2026 already about 1.9x October 2022 with days still to go. The pace accelerates sharply from August into the final weeks.
The late surge concentrates independent expenditures in the decisive voting window, increasing ad clutter and cost pressure in competitive races. Timing matters for voter contact and media buying efficiency. Source: FinzData, FEC independent expenditures by dissemination month, Oct 2026 through Oct 22.
12. 02
2026 midterm funding is supplied by candidates, parties, super PACs, megadonors, industries and small donors.
The slide maps the funding ecosystem for the 2026 midterm election spending cycle. Candidates, parties, super PACs, megadonors, industries and small donors are all identified as payers shaping the race.
Understanding who is paying helps investors assess the durability of outside spending and the influence of independent expenditures on competitive House and Senate contests. The breakdown is drawn from FinzData cycle research on FEC filings.
13. Democratic candidates are out-raising Republicans
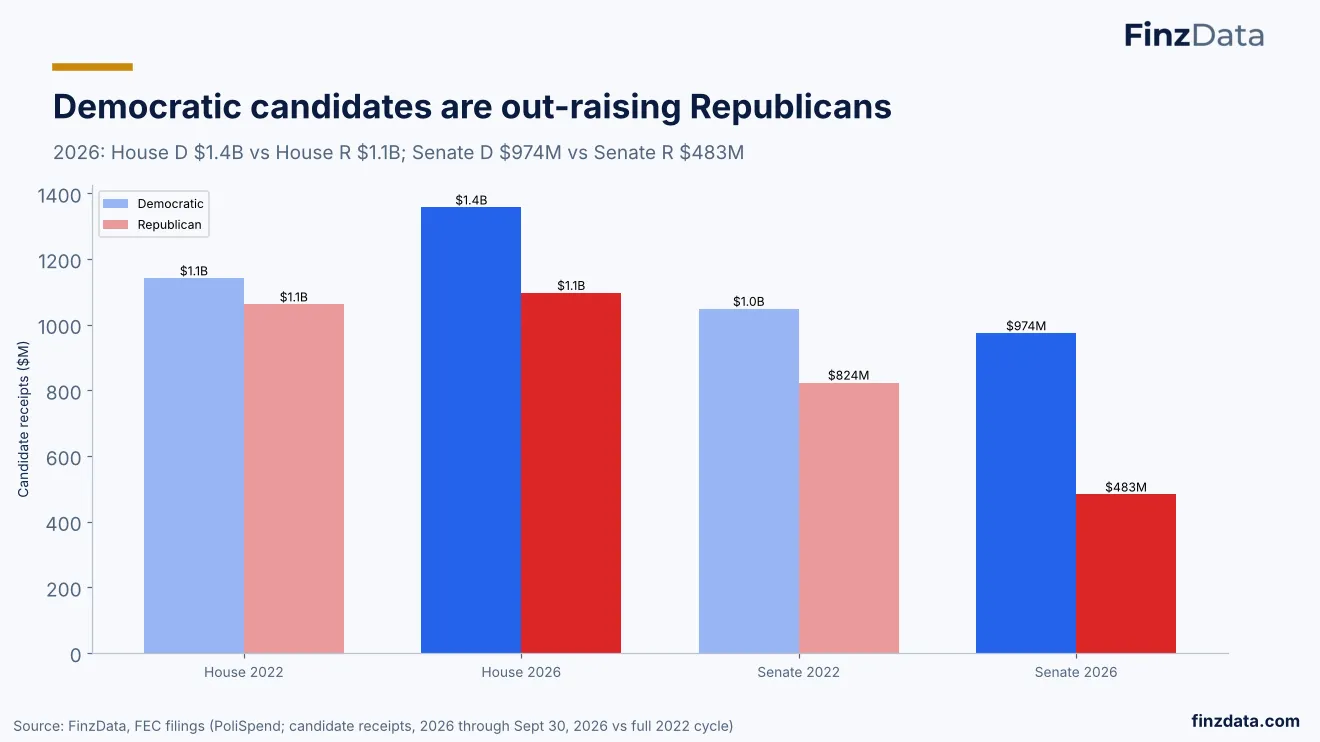
Democratic candidates are out-raising Republicans in House and Senate receipts for 2026.
FinzData shows Democratic candidates leading Republican candidates on receipts in 2026. House Democrats have $1.4B versus House Republicans $1.1B, and Senate Democrats have $974M versus Senate Republicans $483M.
The fundraising gap is relevant for 2026 midterm election spending capacity and for markets monitoring political control risk. Candidate receipts reflect direct fundraising power ahead of the general election. Source is FinzData cycle research based on FEC data.
14. Outside money: Republicans lead the Senate, Democrats the House
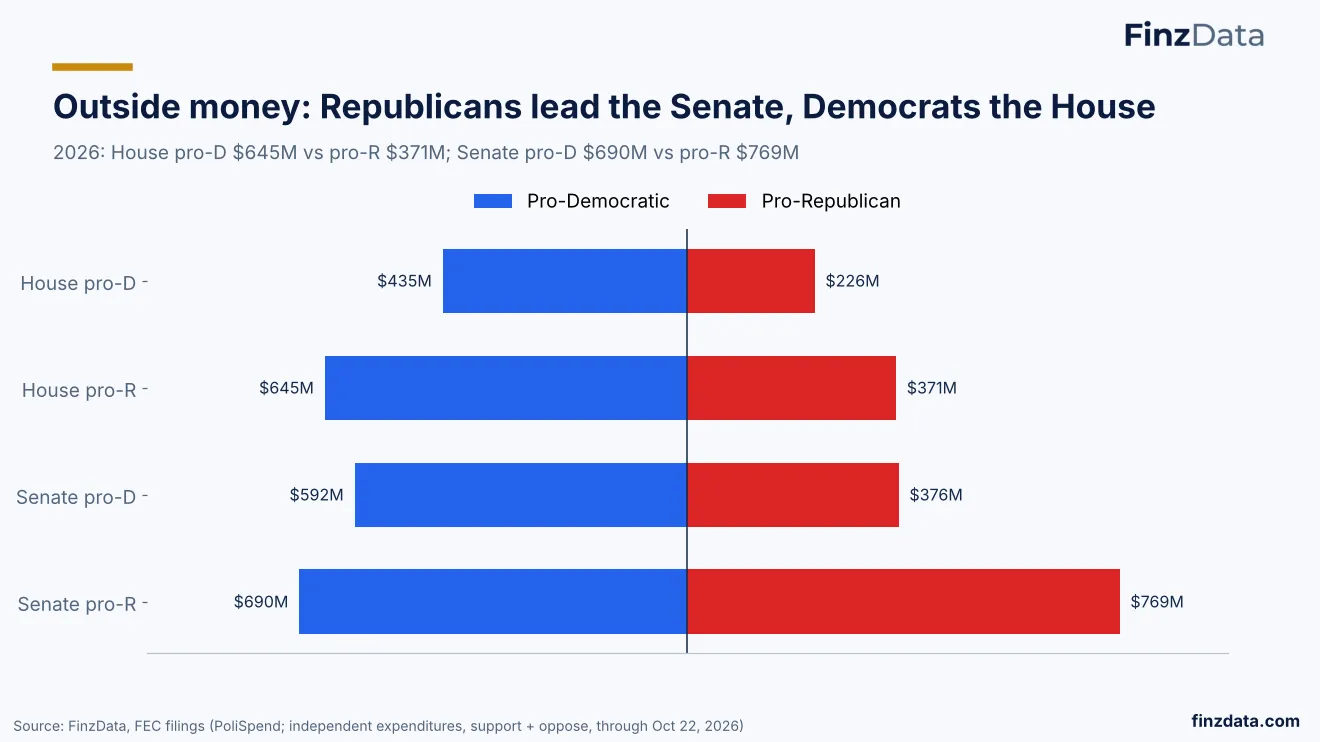
Outside money favors Democrats in the House and Republicans in the Senate for 2026.
Independent expenditures show a split by chamber. House pro-D outside spending is $645M versus pro-R $371M, while Senate pro-D is $690M versus pro-R $769M.
The divergence highlights how super PACs and outside groups allocate resources across the 2026 midterm election spending landscape. Senate Republican outside advantage and House Democratic outside advantage shape competitive race dynamics. Data is FinzData cycle research from FEC independent expenditure reports.
15. The top ten outside spenders
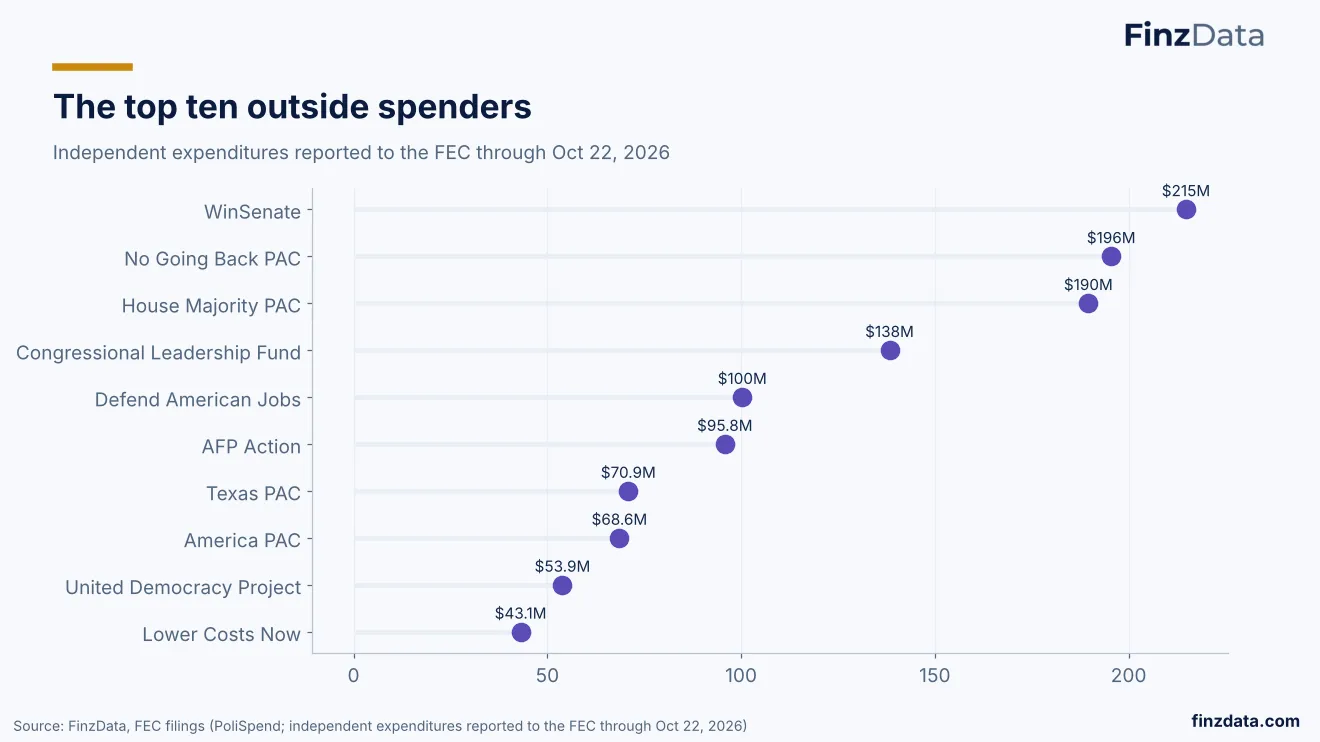
WinSenate tops outside spenders with $215M in independent expenditures through Oct 22, 2026.
FinzData ranks the top ten outside spenders by independent expenditures reported to the FEC through Oct 22, 2026. WinSenate leads with $215M, followed by No Going Back PAC $196M and House Majority PAC $190M.
Other large spenders include Congressional Leadership Fund $138M, Defend American Jobs $100M, AFP Action $95.8M, Texas PAC $70.9M, America PAC $68.6M, United Democracy Project $53.9M and Lower Costs Now $43.1M. The concentration informs expectations for late-cycle outside spending impact.
16. The biggest outside spenders
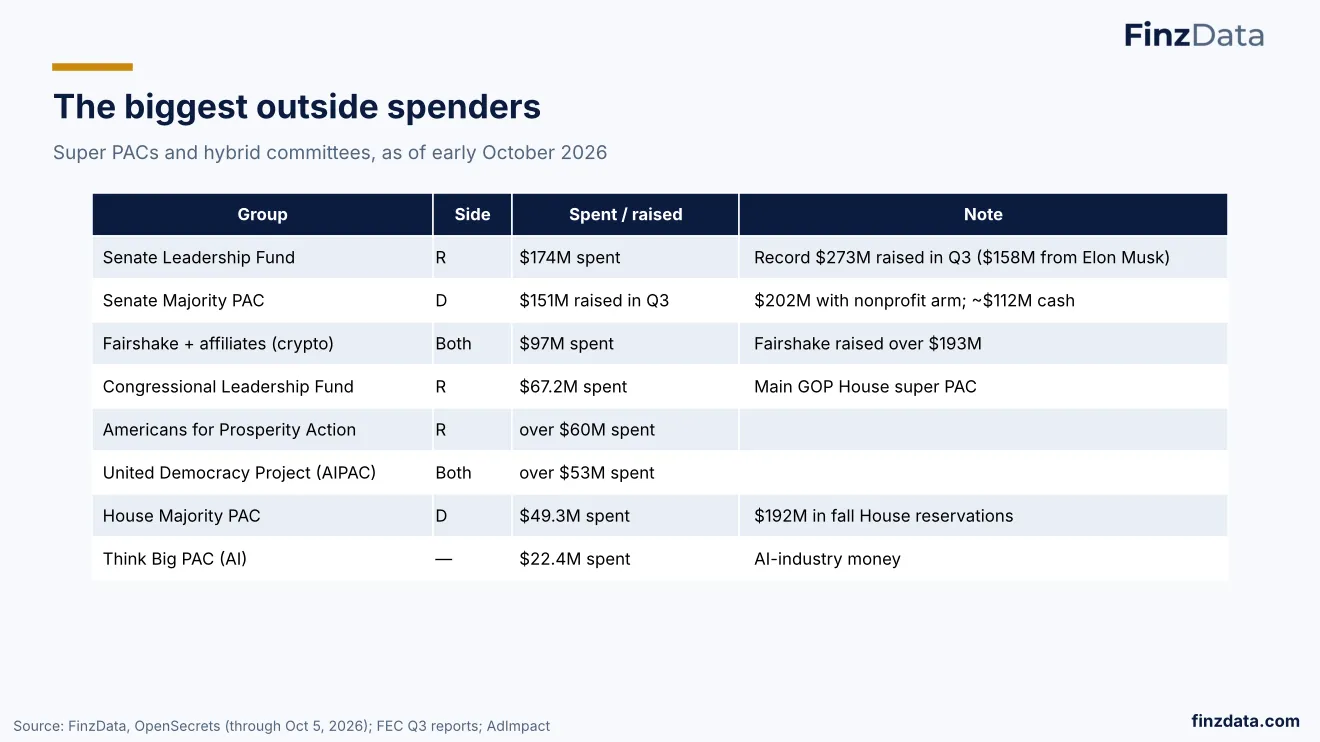
Senate Leadership Fund spent $174M and raised record $273M in Q3, led by $158M from Elon Musk.
Top outside groups in 2026 include Senate Leadership Fund R with $174M spent and a record $273M raised in Q3 including $158M from Elon Musk, and Senate Majority PAC D with $151M raised in Q3.
Fairshake and affiliates spent $97M and raised over $193M, Congressional Leadership Fund spent $67.2M, House Majority PAC spent $49.3M with $192M in fall House reservations, and Think Big PAC spent $22.4M. Source: FinzData, OpenSecrets, FEC Q3 reports, AdImpact.
17. Four donors have each given $100M+
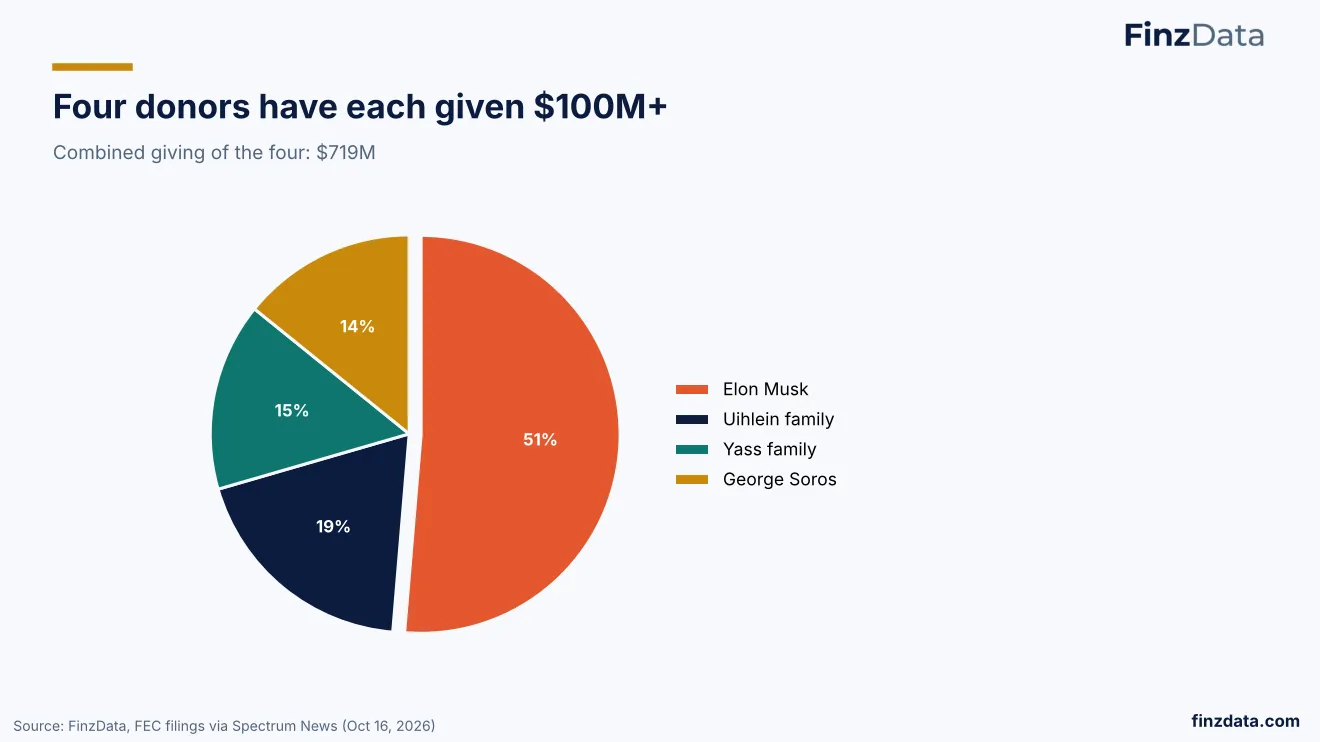
Four megadonors each gave $100M+ in 2026, combining for $719M in midterm giving.
The slide identifies four donors with $100M+ contributions in the 2026 cycle. Combined giving of the four totals $719M, with the Yass family at 51%, Elon Musk at 14%, the Uihlein family at 15%, and George Soros at 19%.
The concentration underscores how a small number of ultra-high-net-worth individuals drive outside spending and super PAC fundraising in the 2026 midterm election. Source: FinzData cycle research.
18. Crypto, sports betting and AI lead corporate giving
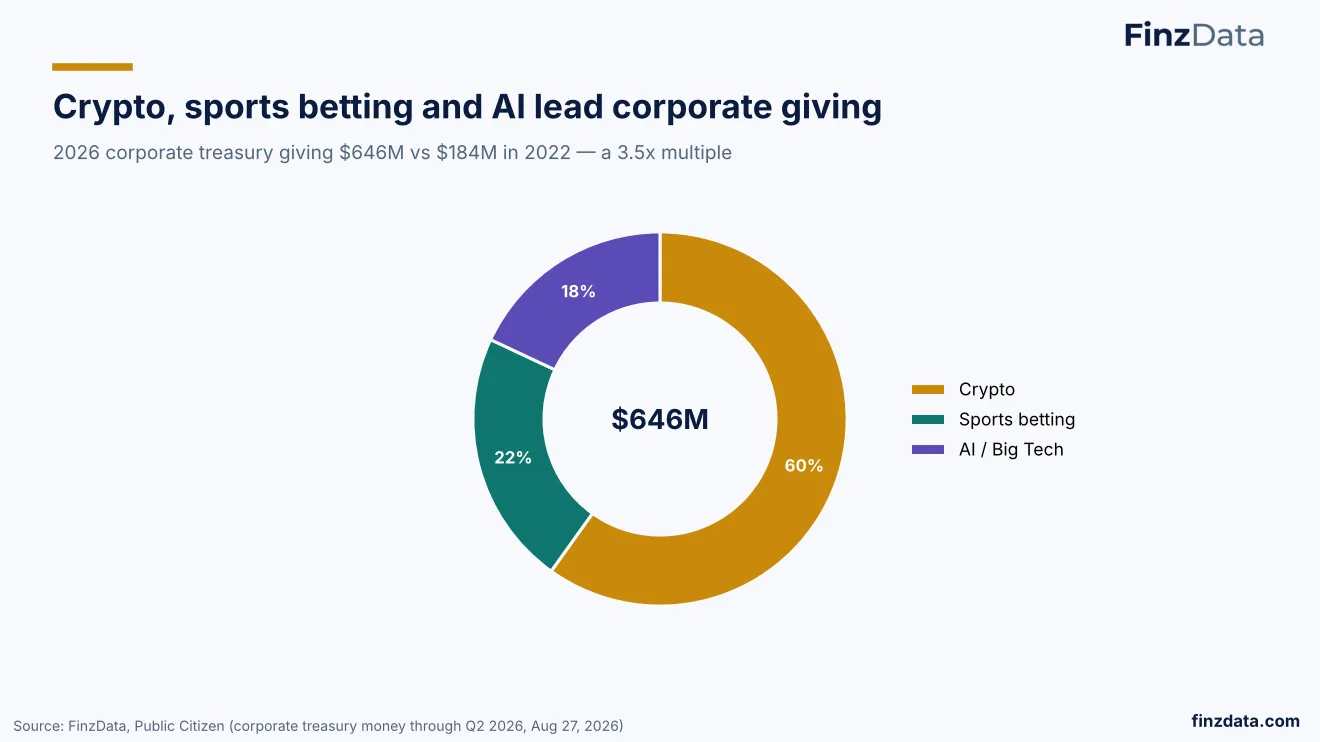
Corporate treasury political giving in 2026 is $646M versus $184M in 2022, a 3.5x increase.
Corporate treasury political giving in the 2026 cycle totals $646M through Q2 2026 versus $184M in 2022, a 3.5x multiple. Crypto accounts for 60%, sports betting 22% and AI / Big Tech 18%.
The rise reflects direct corporate engagement in federal elections and sector-specific policy exposure. Treasury funding changes the composition of outside money and donor visibility. Source: FinzData, Public Citizen (corporate treasury money through Q2 2026).
19. Small dollars: ActBlue processes 2.8x WinRed
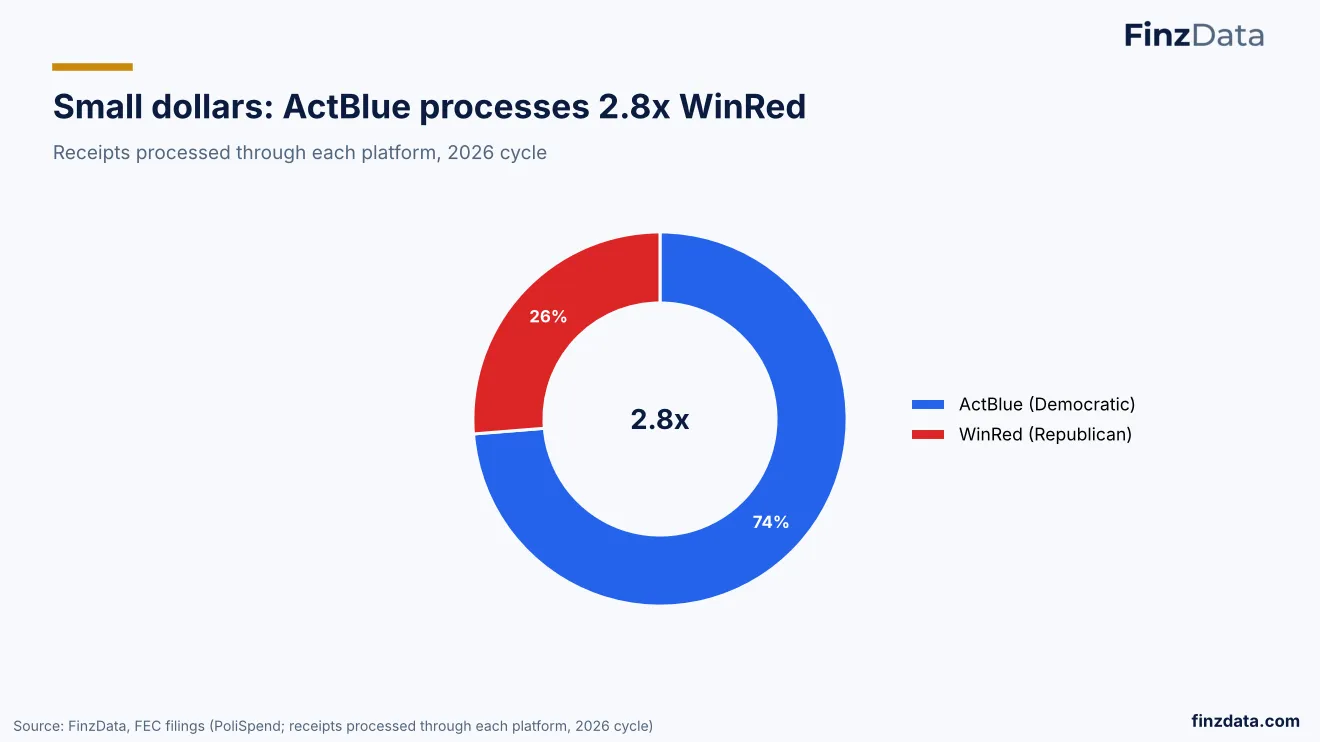
ActBlue processed 2.8x WinRed receipts in the 2026 cycle for small-dollar donations.
The slide compares small-dollar conduit platforms in the 2026 cycle. ActBlue, the Democratic platform, processed 2.8x the receipts of WinRed, the Republican platform, with ActBlue at 26% and WinRed at 74% of the shown split.
The gap illustrates the Democratic small-dollar fundraising advantage in 2026 midterm election spending and the continued reliance on digital conduits for grassroots contributions. Source: FinzData cycle research.
20. The rules have loosened
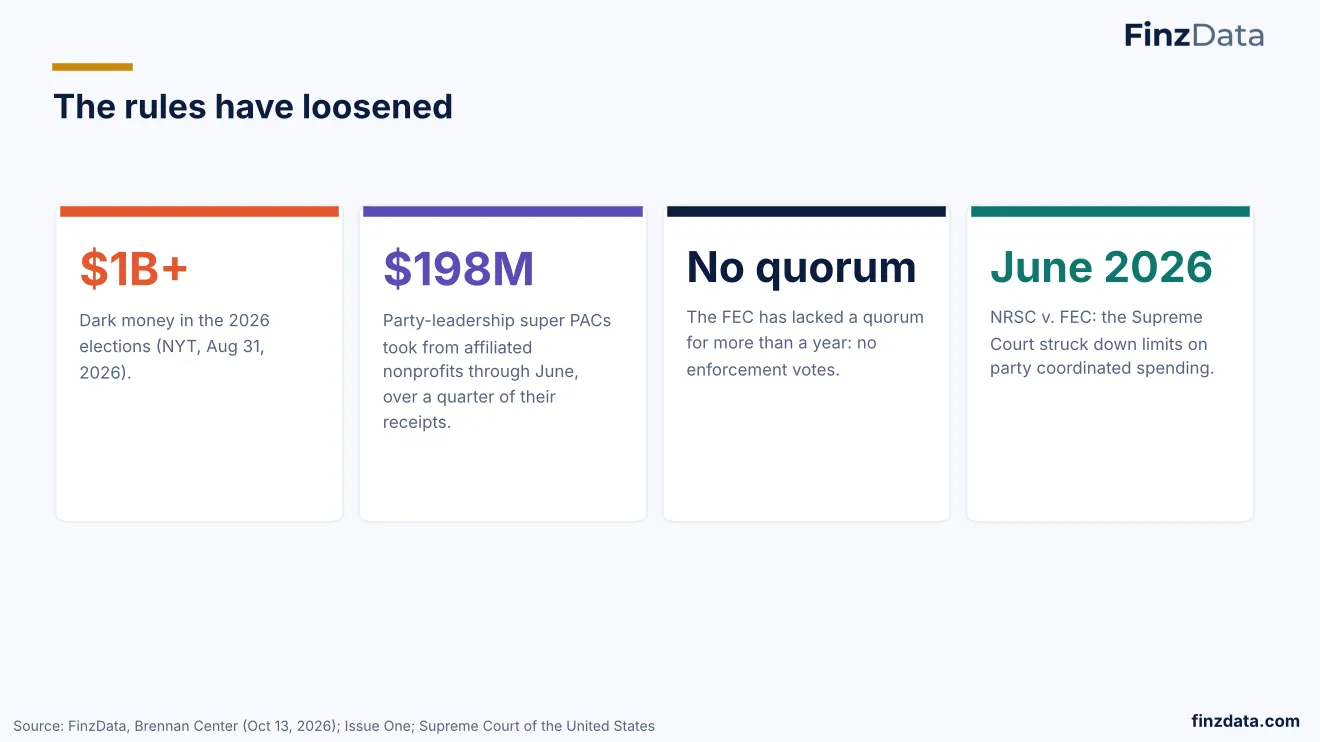
Dark money tops $1B in 2026 as FEC lacks quorum and party spending limits fall.
The slide notes loosening rules for 2026 midterm election spending. Dark money in the 2026 elections is $1B+, party-leadership super PACs took from affiliated nonprofits through June 2026, and the FEC has lacked a quorum for more than a year with no enforcement votes.
In June 2026, NRSC v. FEC saw the Supreme Court strike down limits on party coordinated spending. The environment favors increased outside spending and reduced transparency. Source: FinzData cycle research.
21. 03
03
22. Texas, Ohio and Michigan are the Senate money magnets
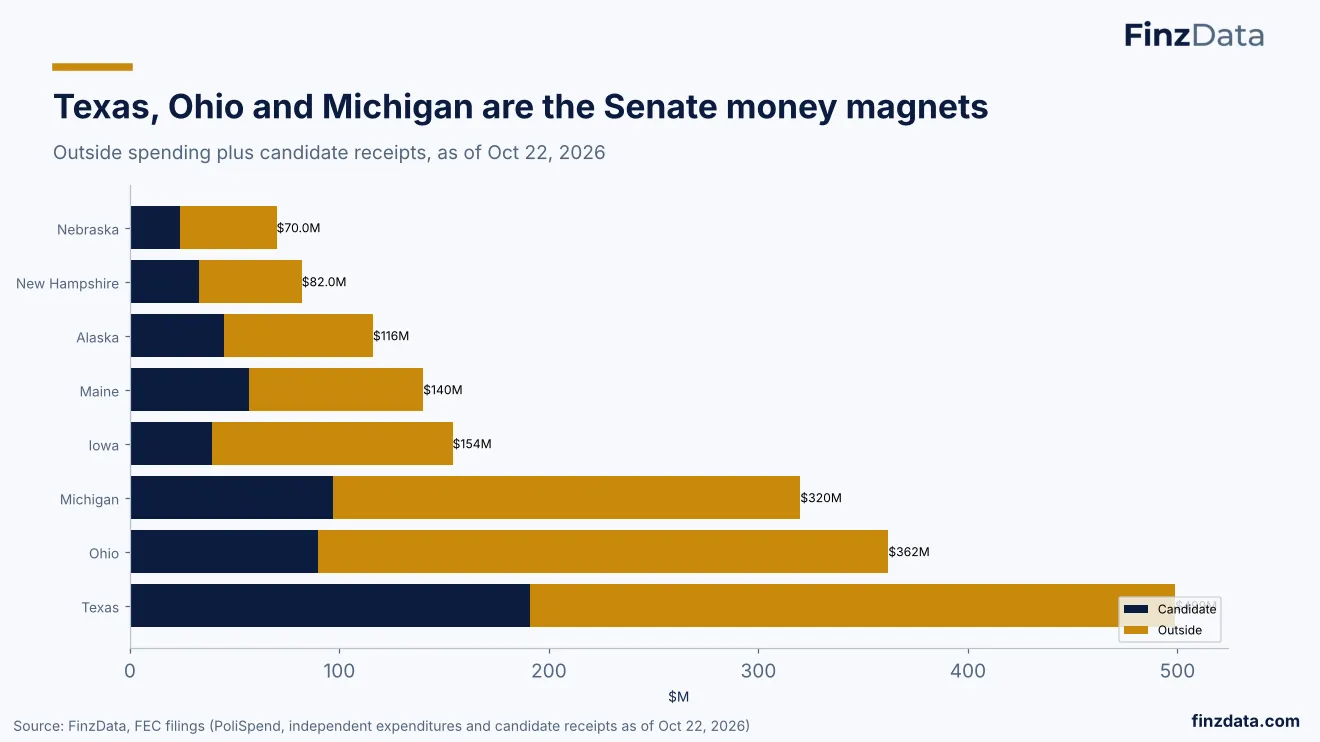
Texas leads Senate fundraising with $499M total as of Oct 22, 2026, followed by Ohio $362M and Michigan $320M.
The slide ranks Senate contests by combined candidate receipts and outside spending as of Oct 22, 2026. Texas tops the list at $499M, ahead of Ohio at $362M and Michigan at $320M, with Iowa $154M, Maine $140M, Alaska $116M, New Hampshire $82.0M and Nebraska $70.0M trailing.
Concentration of 2026 midterm election spending in a few large Senate races signals higher media costs and volatility for market-sensitive states. The distribution highlights where outside spending and candidate war chests are building, a focus of FinzData cycle research for campaigns and investors tracking political risk.
23. The most expensive House races, by outside money
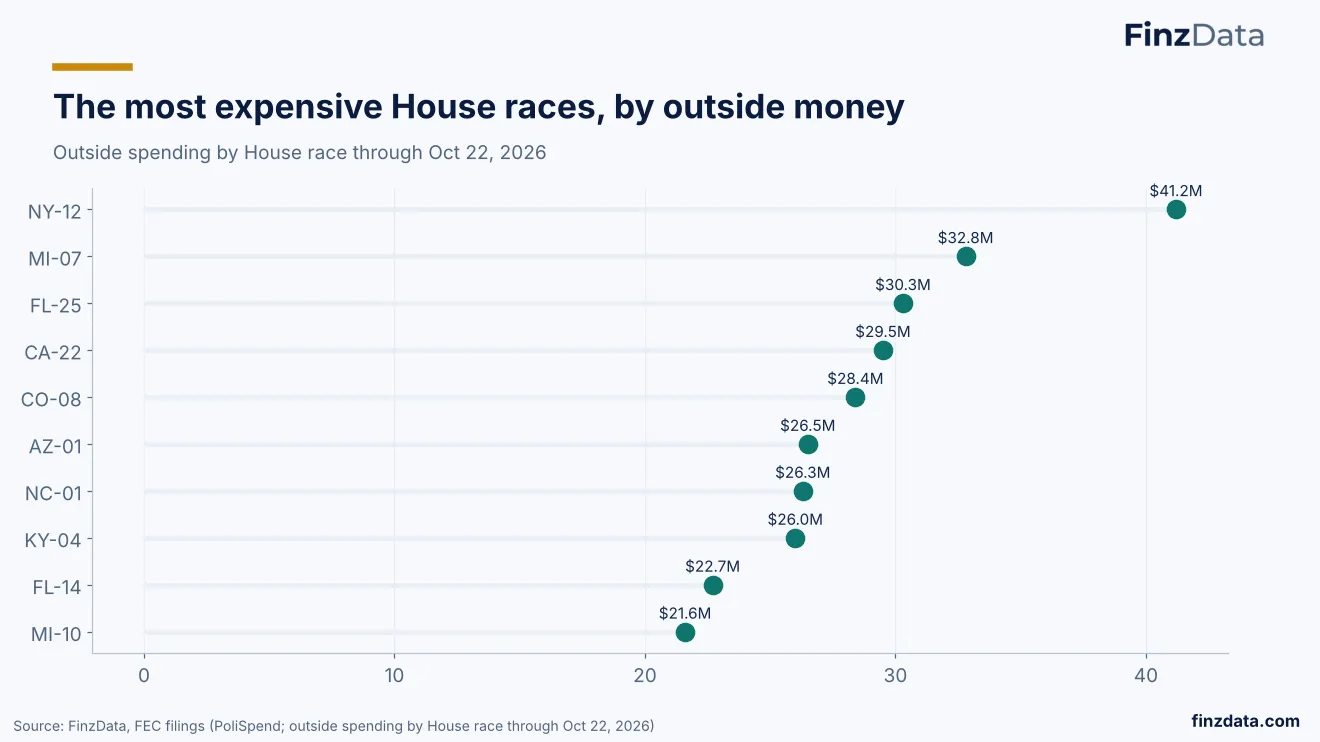
NY-12 tops House outside spending at $41.2M through Oct 22, 2026, with MI-07 $32.8M second.
The chart lists the most expensive House races by outside spending through Oct 22, 2026. NY-12 leads at $41.2M, followed by MI-07 $32.8M, FL-25 $30.3M, CA-22 $29.5M, CO-08 $28.4M, AZ-01 $26.5M, NC-01 $26.3M, KY-04 $26.0M, FL-14 $22.7M and MI-10 $21.6M.
Elevated outside spending in these districts reflects nationalized competition and super PAC activity in the 2026 midterm election spending landscape. For campaigns and investors, the list flags districts where advertising pressure and political attention are most intense, per FinzData cycle research.
24. Democrats raise more; Republicans close the gap with super PACs
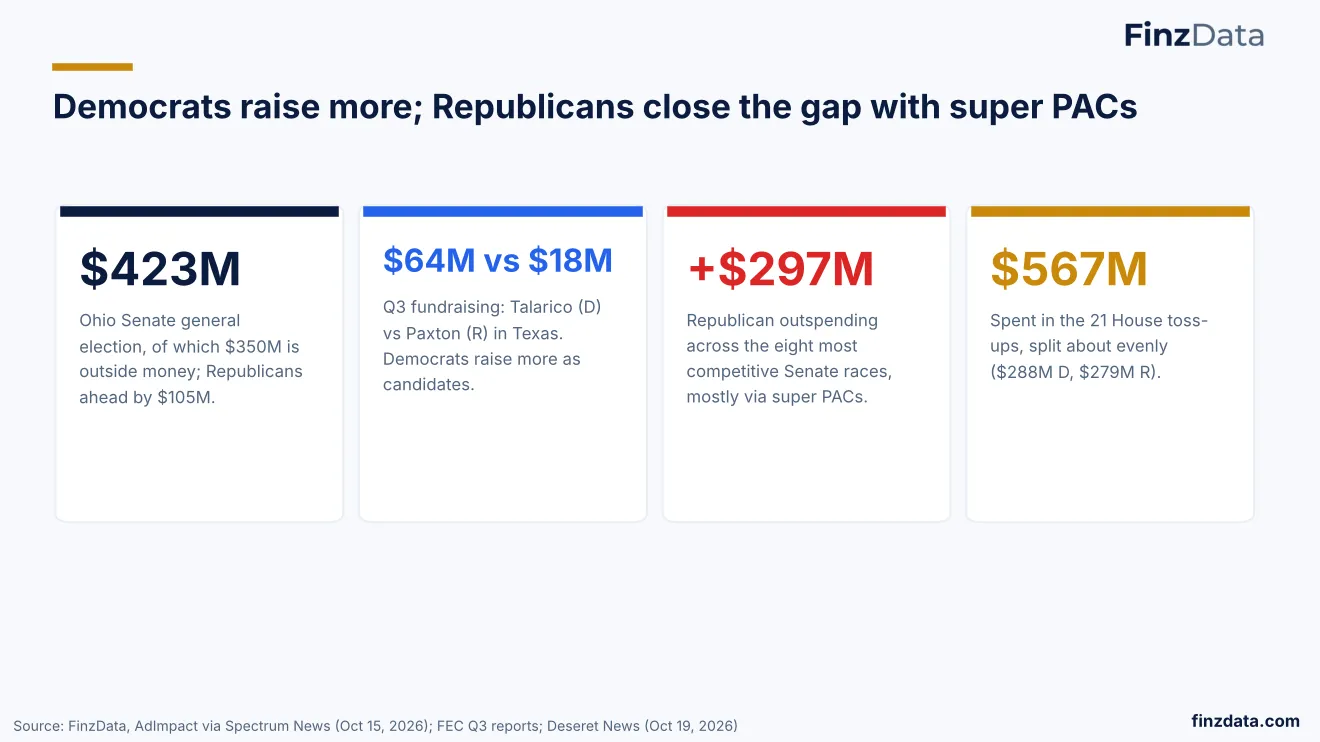
Ohio Senate general election is $423M with $350M outside money; Republicans lead by $105M.
The Ohio Senate general election has $423M in spending, of which $350M is outside money, with Republicans ahead by $105M. Texas Senate Q3 fundraising shows Talarico D $64M vs Paxton R $18M.
Republicans outspend by $297M across the eight most competitive Senate races, mostly via super PACs. $567M has been spent in the 21 House toss-ups, split about evenly $288M D and $279M R. Source: FinzData, AdImpact via Spectrum News, FEC Q3 reports, Cook Political Report.
25. 56% of candidate money crosses state lines
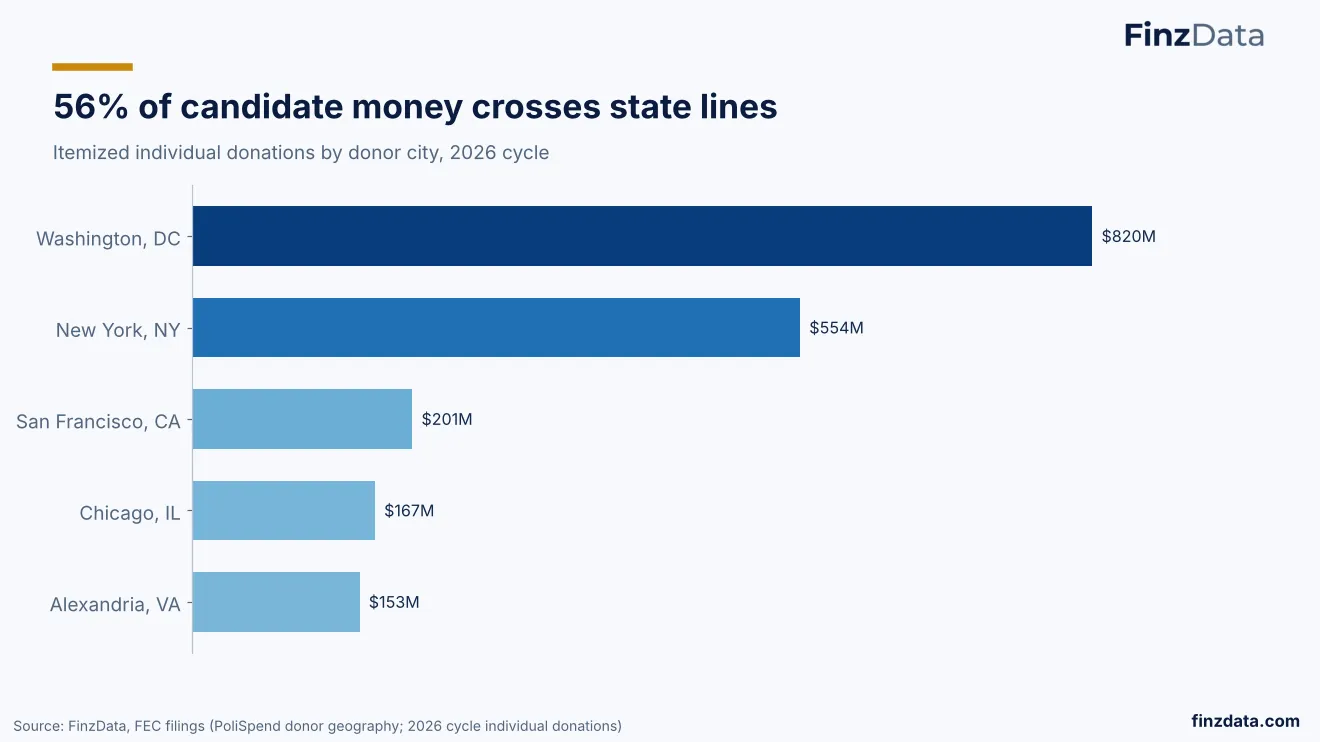
Washington DC leads donor cities with $820M in itemized individual donations for 2026 cycle.
The slide shows 56% of candidate money crosses state lines in the 2026 cycle. Itemized individual donations by donor city are led by Washington, DC $820M, followed by New York, NY $554M, San Francisco, CA $201M, Chicago, IL $167M and Alexandria, VA $153M.
Geographic concentration of donor capital underscores the nationalization of 2026 midterm election spending and the influence of finance hubs on campaigns. The distribution is relevant for investors assessing political risk and for campaigns targeting fundraising, as highlighted in FinzData cycle research.
26. California exports the most campaign money
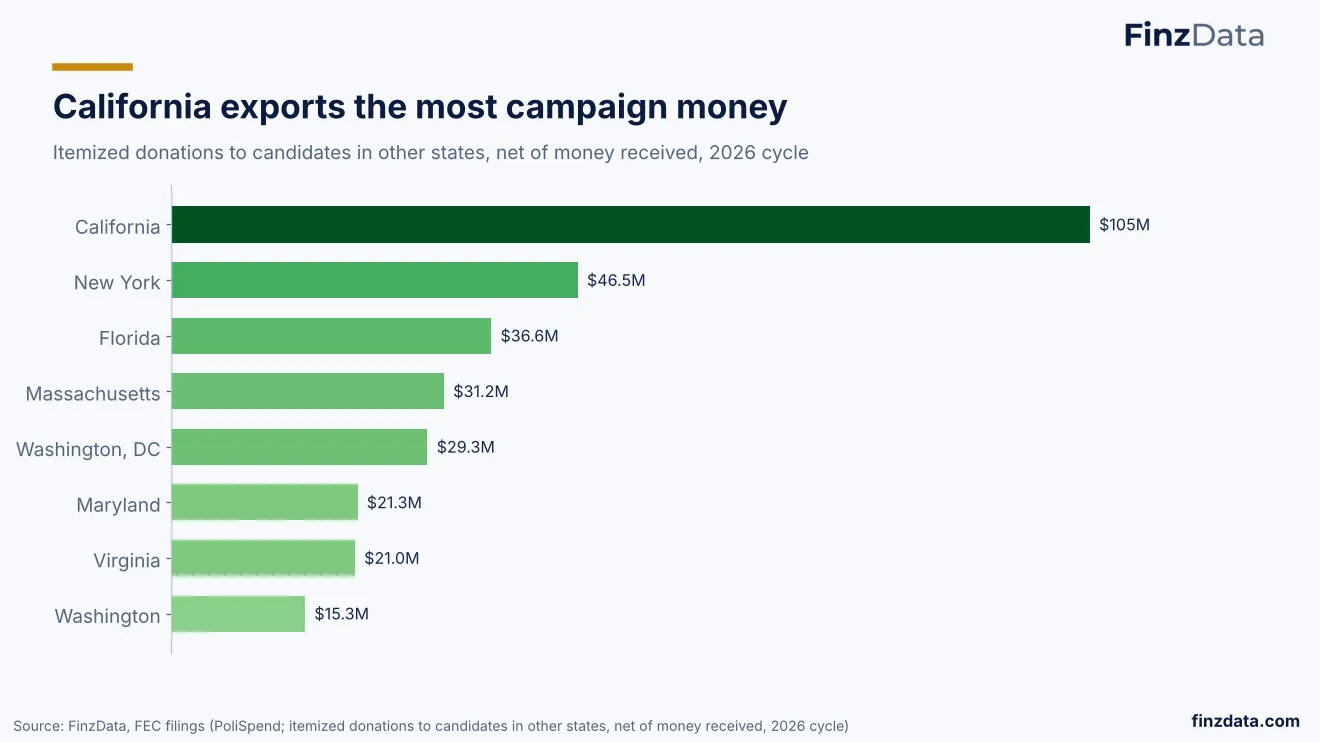
California leads campaign money exporters with $105M net itemized donations to out-of-state candidates in 2026 cycle.
The slide shows itemized donations to candidates in other states net of money received for the 2026 cycle. California tops the list at $105M, followed by New York at $46.5M and Florida at $36.6M. Massachusetts, Washington DC, Maryland, Virginia and Washington also appear as net exporters.
Net export flows highlight donor concentration and cross-state influence in 2026 midterm election spending. For investors tracking political risk and campaigns, the pattern signals where fundraising capacity is generated versus where it is deployed. Source is FinzData cycle research.
27. The richest ZIP codes in politics
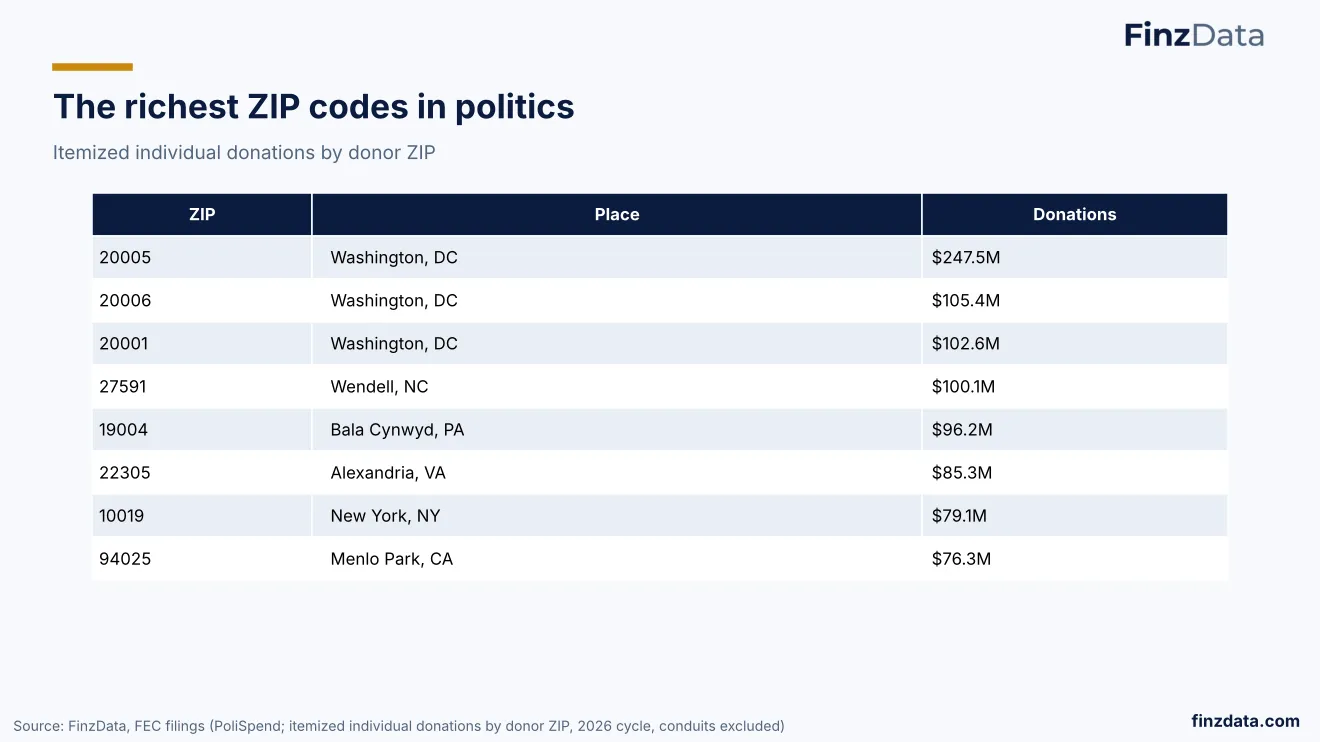
Washington DC ZIP 20005 tops political donor ZIPs with $247.5M in itemized individual donations.
The slide ranks the richest ZIP codes by itemized individual donations. Washington DC ZIP 20005 leads with $247.5M, ahead of 20006 at $105.4M and 20001 at $102.6M. Wendell NC 27591, Bala Cynwyd PA 19004, Alexandria VA 22305, New York NY 10019 and Menlo Park CA 94025 follow.
Geographic concentration of high-value donors informs outside spending and super PACs activity ahead of the 2026 midterms. The DC dominance reflects proximity to federal campaigns and advocacy groups. Source is FinzData cycle research.
28. State races: California alone draws $2.6B
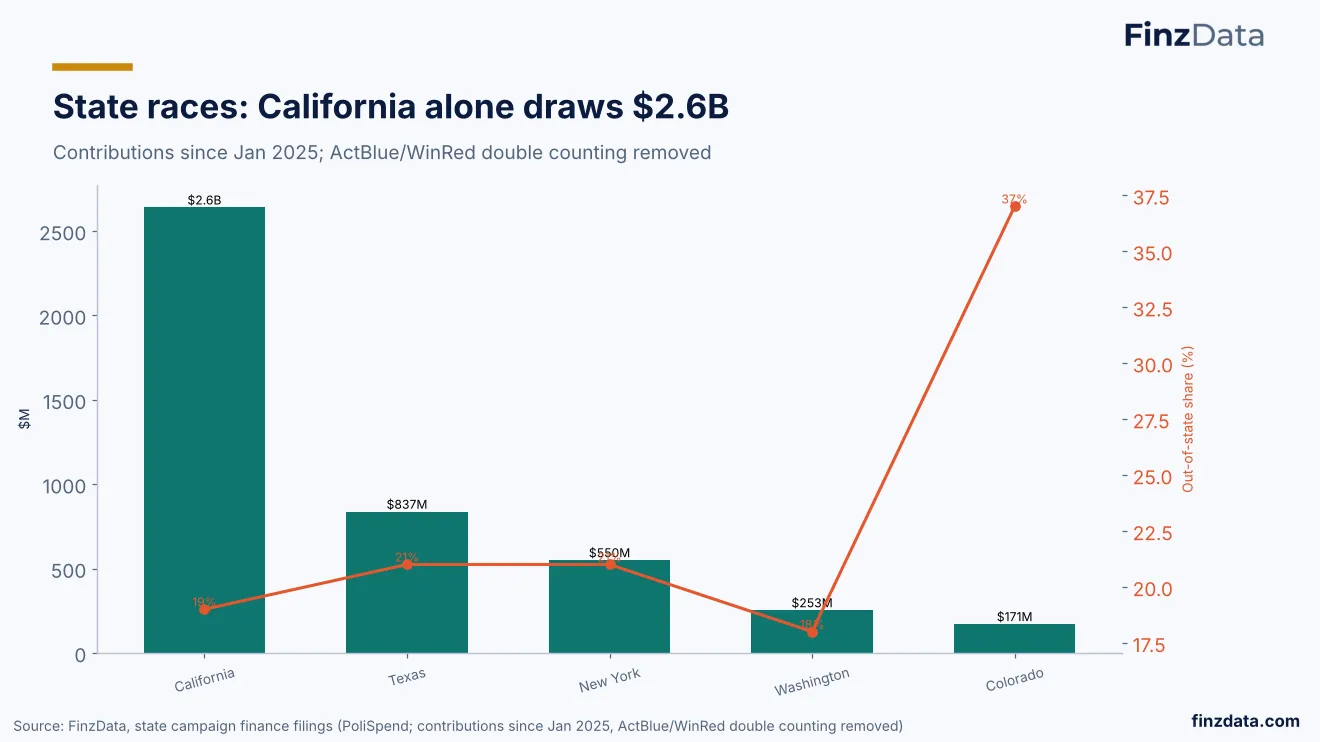
California leads state-race contributions since January 2025 with $2.6B, far ahead of Texas, New York, Washington and Colorado.
State-race contributions since January 2025 show California at $2.6B, well ahead of Texas, New York, Washington and Colorado. The chart also shows the share of money coming from out of state for each state.
The concentration highlights California’s outsized fundraising environment for state contests and the role of out-of-state donors in shaping competitive races. For campaigns and investors tracking political spending, the geographic skew signals where resources and attention are flowing in the 2026 cycle.
Source: FinzData, state campaign finance filings (FinzData PoliSpend).
29. Where campaigns spend: fundraising and TV lead
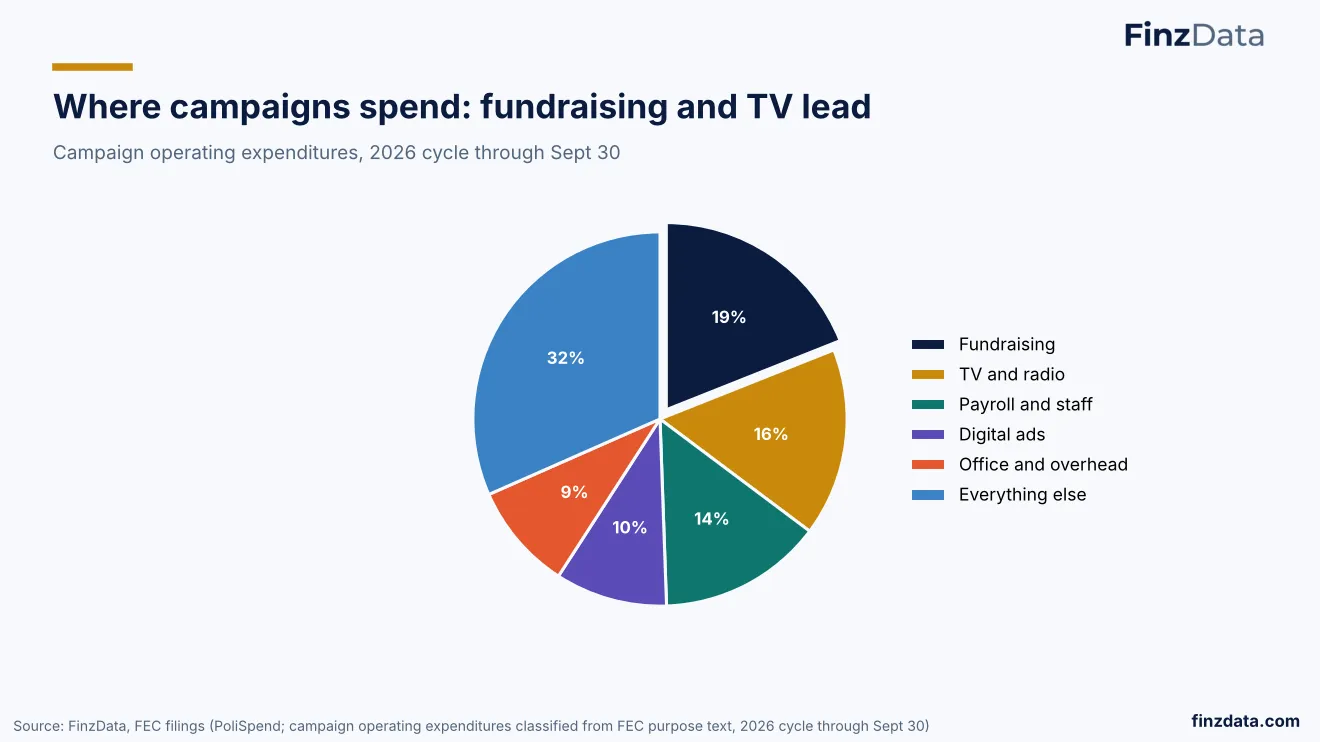
Campaign operating expenditures in 2026 cycle through Sept 30 show fundraising 19%, TV and radio 16%, payroll and staff 14%.
Operating expenditures for the 2026 cycle through Sept 30 are classified from FEC purpose text. Fundraising accounts for 19%, TV and radio 16%, payroll and staff 14%, digital ads 10%, office and overhead 9%, with everything else 32%.
The mix underscores the cost of raising money and communicating with voters as core drivers of campaign budgets. The breakdown helps campaigns benchmark spending priorities and investors assess where political dollars are being deployed across media, personnel and overhead.
Source: FinzData, FEC filings (FinzData PoliSpend).
30. Who gets paid
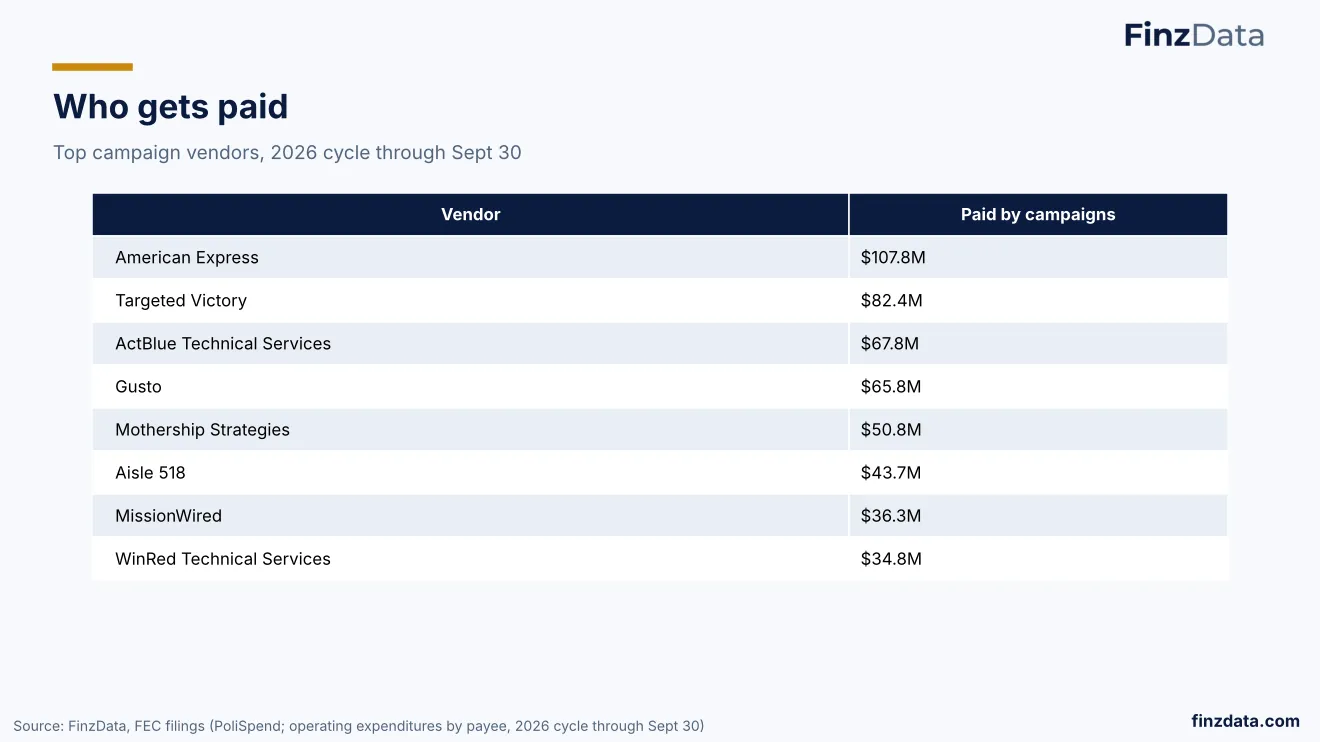
American Express is top campaign vendor with $107.8M in payments through Sept 30 of 2026 cycle.
The slide lists top campaign vendors by payments in the 2026 cycle through Sept 30. American Express leads at $107.8M, followed by Targeted Victory at $82.4M, ActBlue Technical Services at $67.8M, Gusto at $65.8M, Mothership Strategies at $50.8M, Aisle 518 at $43.7M, MissionWired at $36.3M and WinRed Technical Services at $34.8M.
Vendor concentration reflects spending on payments processing, consulting and digital infrastructure in 2026 midterm election spending. The ranking is useful for monitoring services exposure to political cycles. Source is FinzData cycle research.
31. Ballot measures and redistricting are a money war of their own
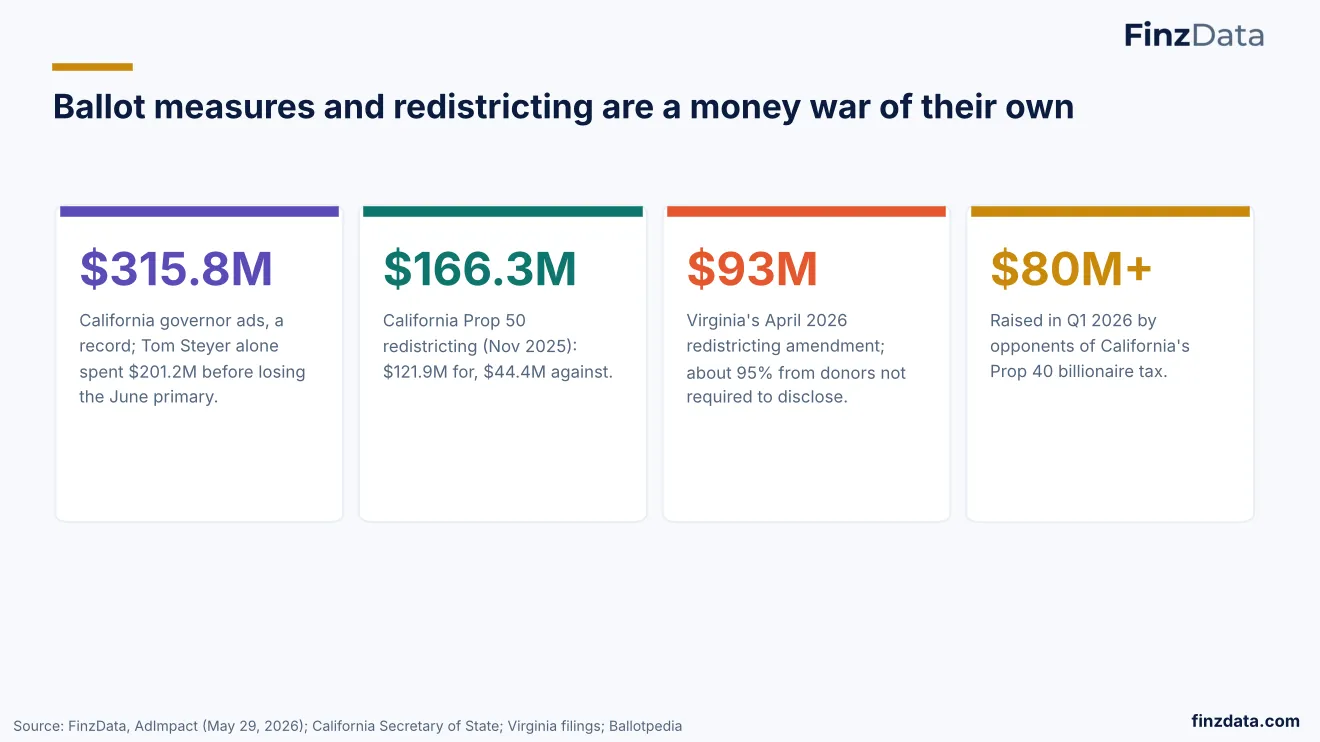
California governor ads hit $315.8M record with Tom Steyer spending $201.2M before losing June primary.
Ballot measures and redistricting spending is elevated in 2026. California governor ads totaled $315.8M, a record, with Tom Steyer alone spending $201.2M before losing the June primary.
California Prop 50 redistricting raised $166.3M, $121.9M for and $44.4M against. Virginia’s April 2026 redistricting amendment totaled $93M, about 85% from donors not required to disclose. $80M+ was raised in Q1 2026 by opponents of California’s Prop 40 billionaire tax.
Source: FinzData, AdImpact, California Secretary of State, Virginia filings, Ballotpedia.
32. 04
Four ways Congress could land on November 3 are linked to historical market outcomes.
The slide frames a what-if analysis for the 2026 midterm election and its market implications. It introduces four ways Congress could land on November 3 and what history says about markets.
The section sets up scenario analysis using calendar and election analogs, noting that analogs are small samples and are not forecasts. The approach is intended to contextualize 2026 midterm election spending and political outcomes for investors.
33. Markets expect a Democratic House and lean Democratic on the Senate
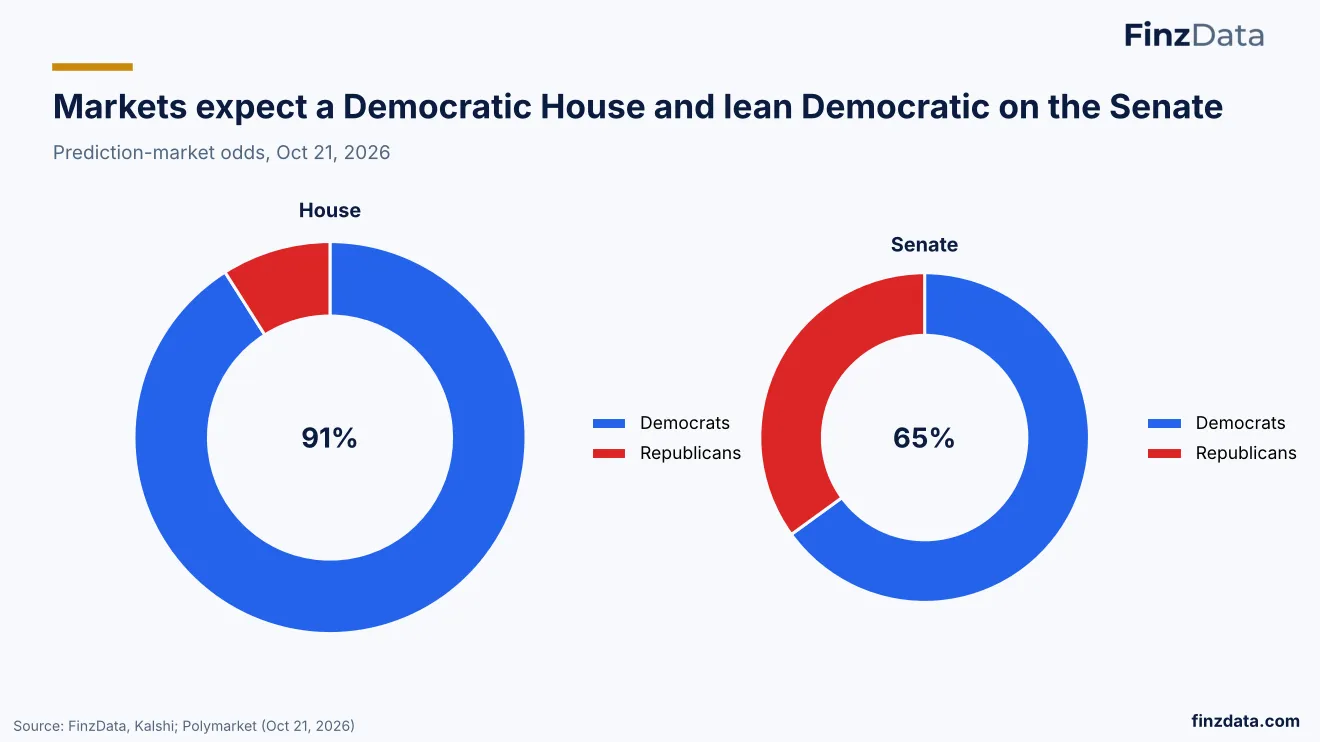
Prediction markets on Oct 21 2026 price Democrats 91% to win House and 65% to win Senate.
Markets expect a Democratic House and lean Democratic on the Senate ahead of the 2026 midterms. Prediction-market odds as of Oct 21, 2026 show Democrats at 91% for the House versus Republicans, and Democrats at 65% for the Senate versus Republicans.
The pricing reflects investor and trader expectations for divided government with a Republican White House. The odds are used as a market-based read on control of Congress and potential policy direction.
34. Four scenarios
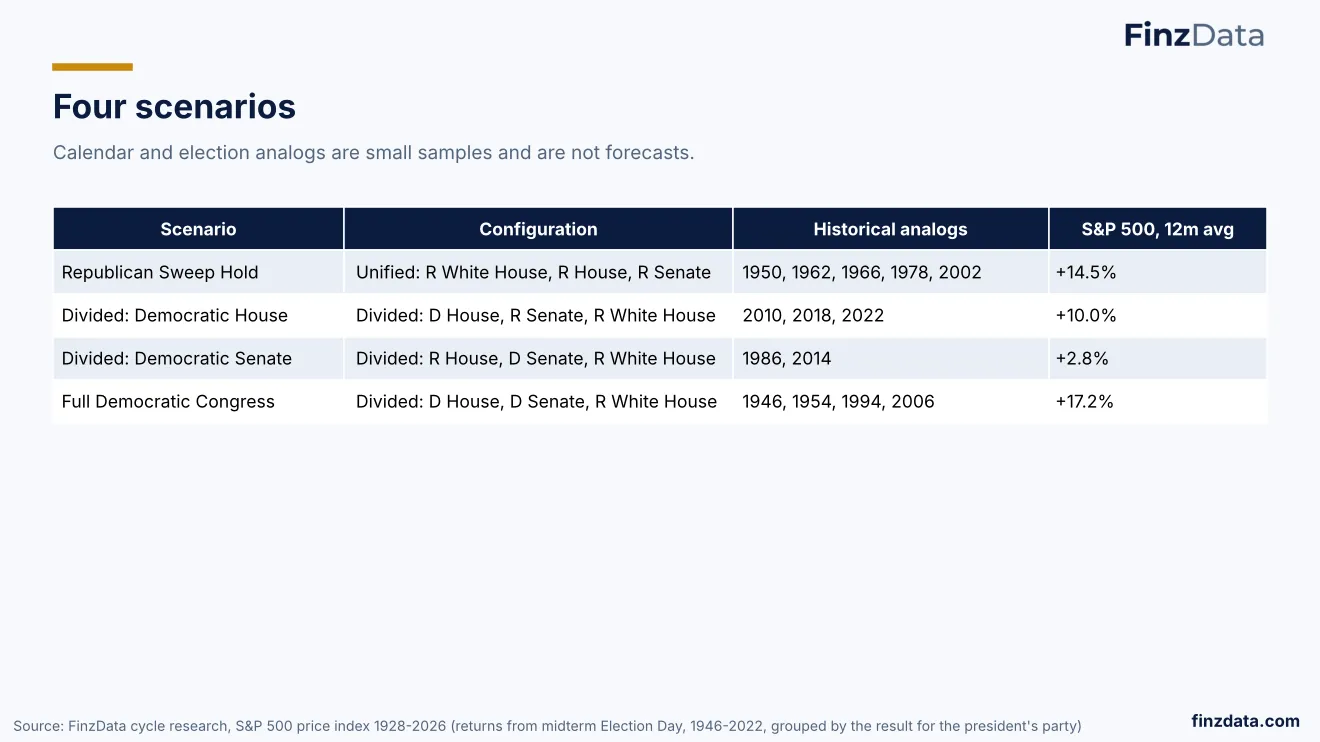
S&P 500 average return 12 months after midterm Election Day ranges from +2.8% to +17.2% across four scenarios.
Four scenarios are shown with the S&P 500’s average return 12 months after midterm Election Day in historical analogs. Republican Sweep Hold averages +14.5%; Divided, Democratic House +10.0%; Divided, Democratic Senate +2.8%; Full Democratic Congress +17.2%.
The analogs illustrate how election outcomes have historically coincided with different market return profiles. Calendar and election analogs are small samples and are not forecasts, but they provide context for how political control has mapped to subsequent market performance.
Source: FinzData, FinzData.
35. Republican Sweep Hold
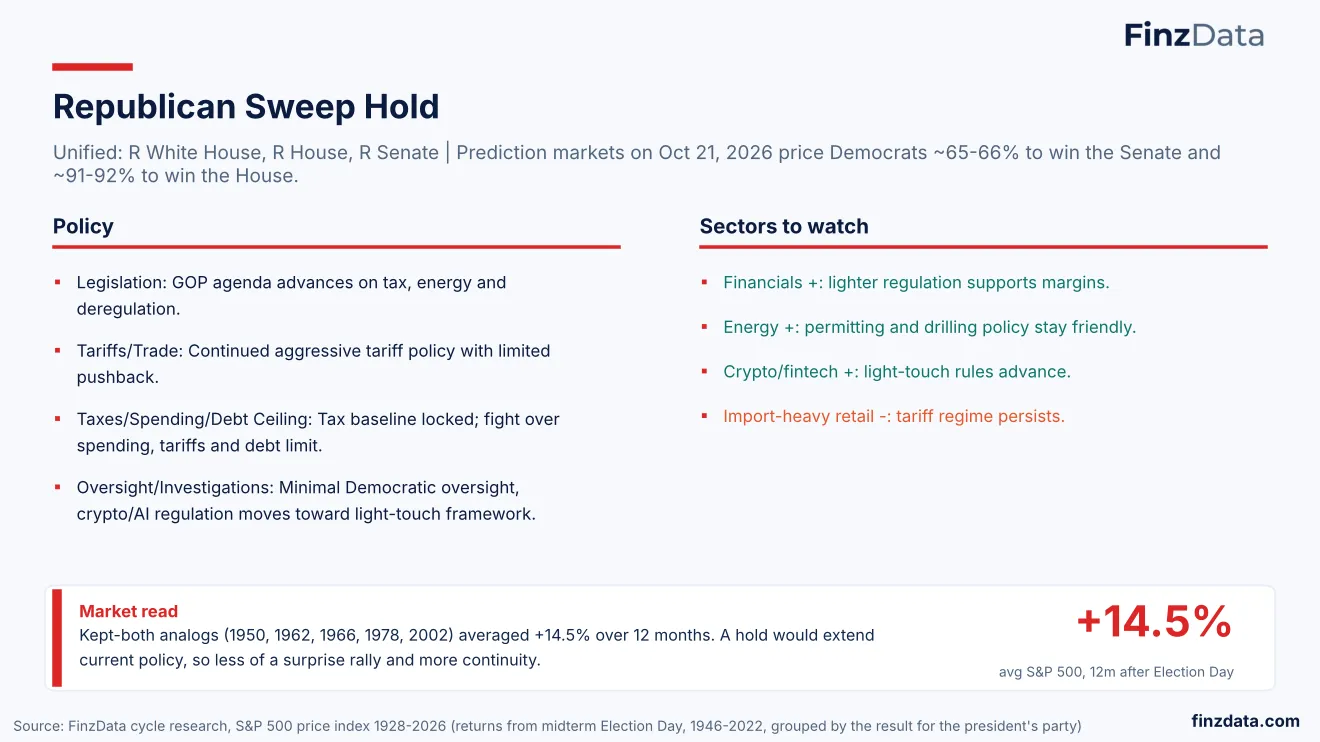
Republican Sweep Hold scenario averaged +14.5% S&P 500 over 12 months in historical analogs.
The Republican Sweep Hold scenario describes unified Republican control of White House, House and Senate. Prediction markets on Oct 21, 2026 price Democrats ~65-66% to win the Senate and ~91-92% to win the House, making the scenario low probability.
Policy implications include GOP agenda advances on tax, energy and deregulation, continued aggressive tariff policy, and light-touch crypto/AI regulation. FinzData cycle research notes kept-both analogs averaged +14.5% over 12 months, with a hold extending current policy and implying continuity for S&P 500 after midterm elections.
36. Divided: Democratic House
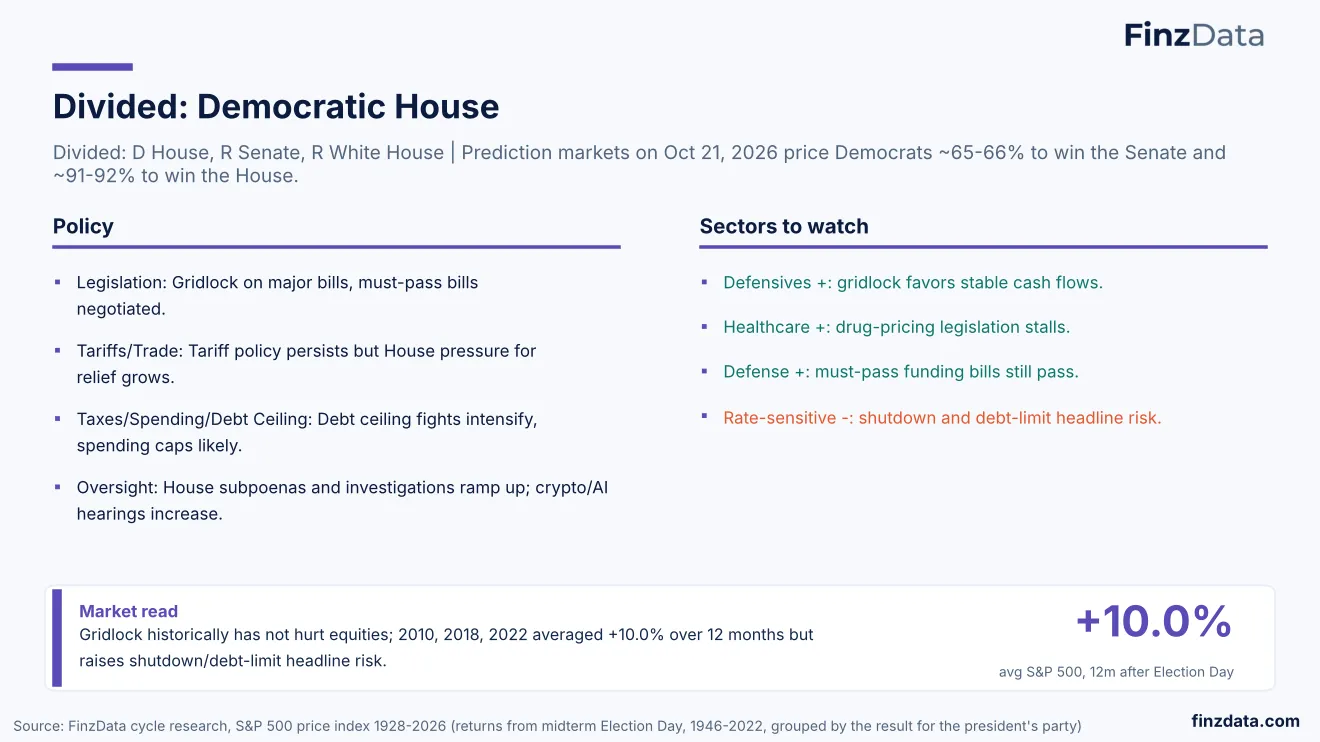
Democratic House with divided government averages +10.0% S&P 500 twelve months after midterm elections.
FinzData analysis of a divided Congress with a Democratic House and Republican Senate and White House shows gridlock on major bills with must-pass legislation negotiated. Prediction markets on Oct 21, 2026 price Democrats ~65-66% to win the Senate and ~91-92% to win the House. Sectors highlighted include defensives, healthcare, defense and rate-sensitive names.
The market read cites 2010, 2018 and 2022 analogs averaging +10.0% over 12 months after Election Day. Gridlock historically has not hurt equities but raises shutdown and debt-limit headline risk. The finding is from the FinzData institutional deck "Midterm Money: Who Is Paying for the 2026 Midterms and What It Means for Markets".
37. Divided: Democratic Senate
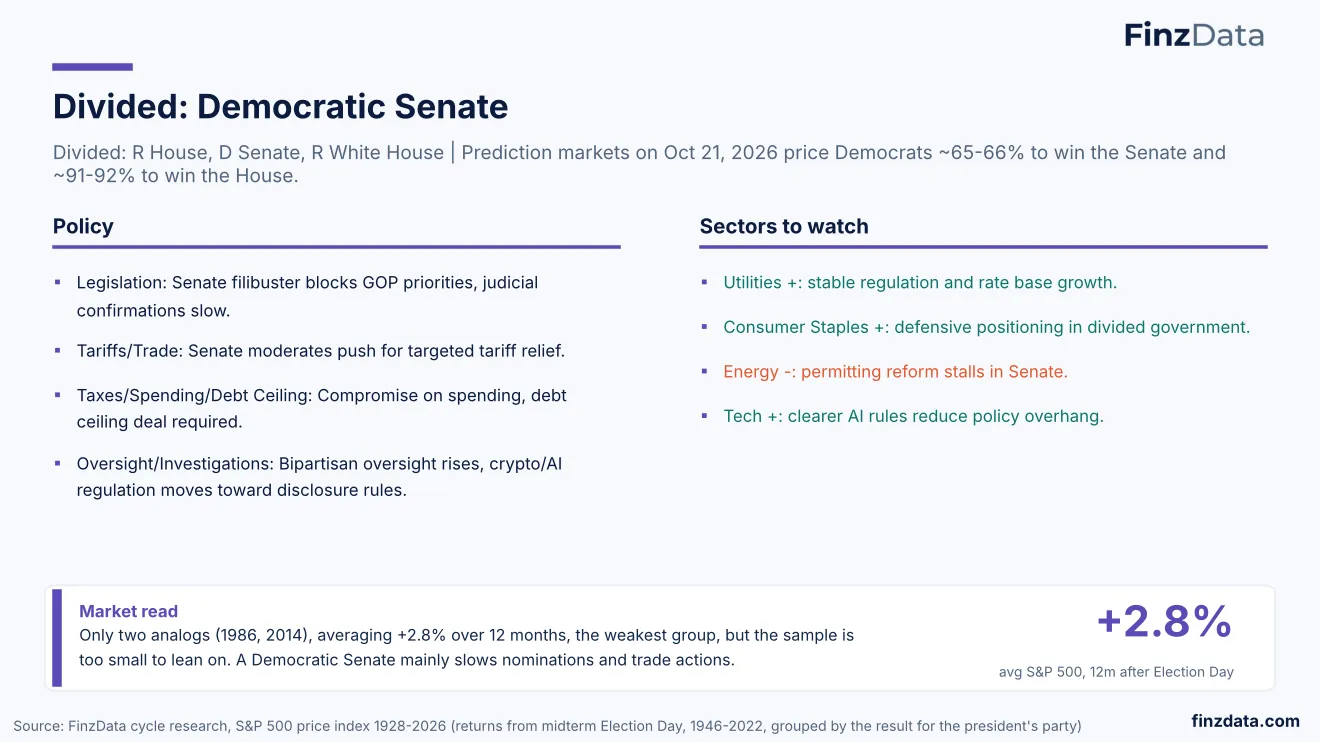
Divided government with Democratic Senate averages +2.8% S&P 500 twelve months after midterm elections.
FinzData outlines a scenario of a Republican House, Democratic Senate and Republican White House with Senate filibuster blocking GOP priorities and slower judicial confirmations. Prediction markets on Oct 21, 2026 price Democrats ~65-66% to win the Senate and ~91-92% to win the House. Policy emphasis includes targeted tariff relief, stalled permitting reform and bipartisan oversight on crypto and AI.
The market read notes only two analogs, 1986 and 2014, averaging +2.8% over 12 months after Election Day, the weakest group in the sample. A Democratic Senate mainly slows nominations and trade actions. The analysis is from the FinzData institutional deck "Midterm Money: Who Is Paying for the 2026 Midterms and What It Means for Markets".
38. Full Democratic Congress
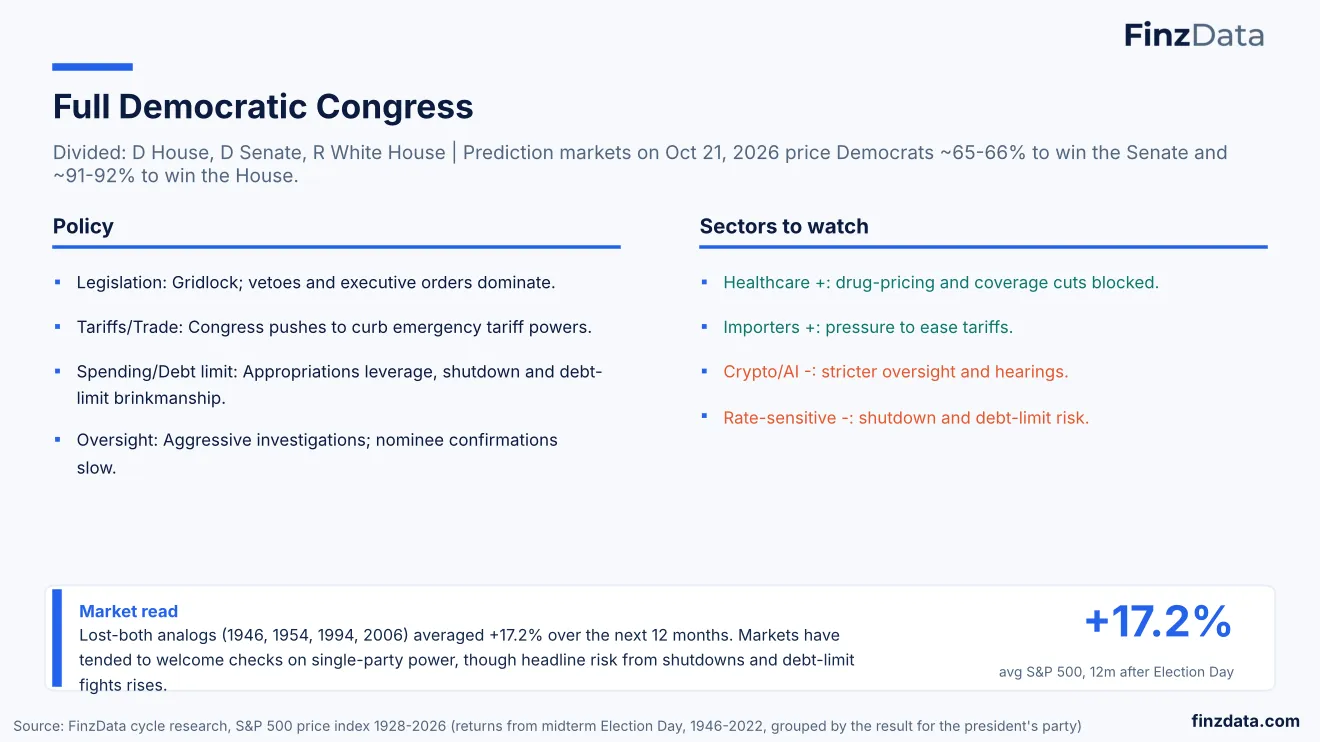
Full Democratic Congress with Republican White House averages +17.2% S&P 500 twelve months after elections.
FinzData examines a full Democratic Congress facing a Republican White House, where gridlock, vetoes and executive orders dominate. Prediction markets on Oct 21, 2026 price Democrats ~65-66% to win the Senate and ~91-92% to win the House. Policy themes include pressure to curb emergency tariff powers, appropriations leverage and aggressive oversight on crypto and AI.
The market read references lost-both analogs 1946, 1954, 1994 and 2006 averaging +17.2% over the next 12 months. Markets have tended to welcome checks on single-party power, though shutdown and debt-limit fights raise headline risk. The data is from the FinzData institutional deck "Midterm Money: Who Is Paying for the 2026 Midterms and What It Means for Markets".
39. 05
05
40. Midterm years are the weakest of the four-year cycle
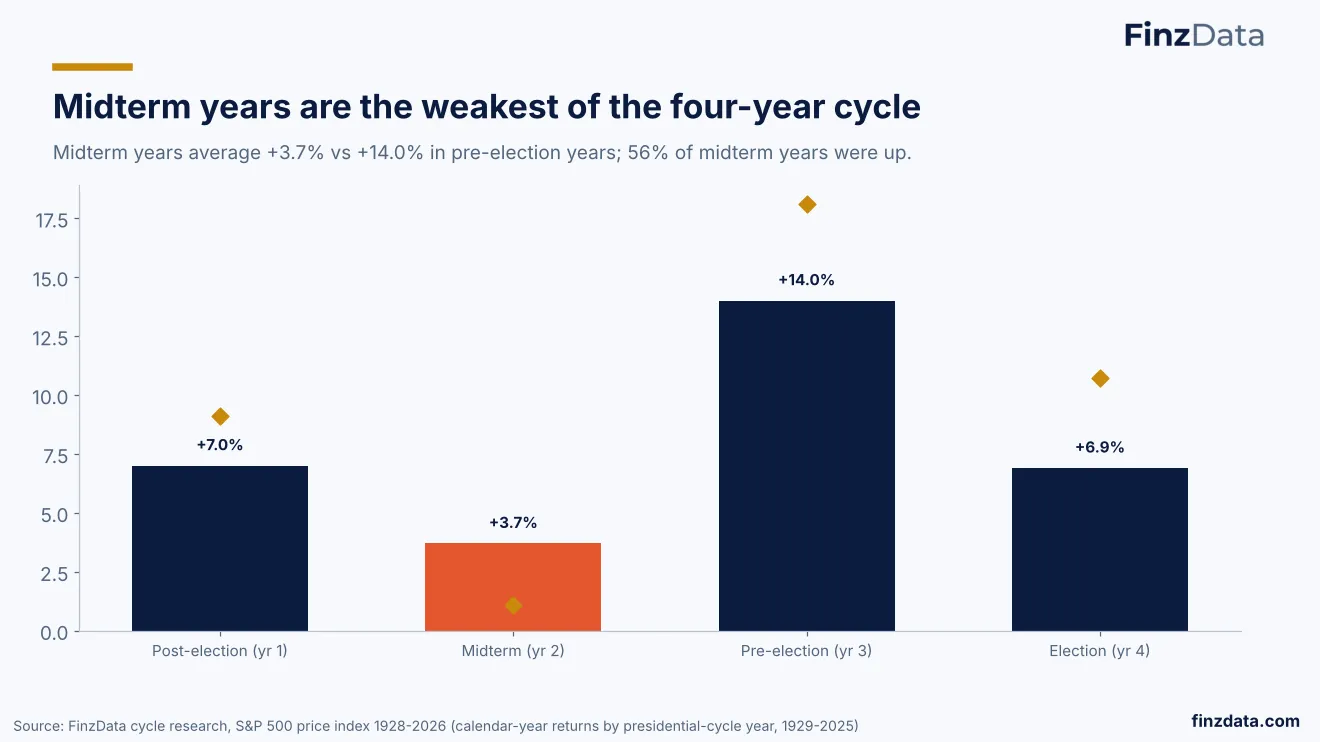
Midterm years average +3.7% versus +14.0% in pre-election years in the election cycle.
FinzData cycle research shows midterm years are the weakest of the four-year cycle. Midterm years average +3.7% versus +14.0% in pre-election years, with 56% of midterm years up. The chart compares post-election year 1, midterm year 2, pre-election year 3 and election year 4 returns.
The analysis highlights the historical performance pattern for the 2026 midterm election spending environment and its relevance for campaigns and markets. The finding is from the FinzData institutional deck "Midterm Money: Who Is Paying for the 2026 Midterms and What It Means for Markets" dated October 22, 2026.
41. 2026 is running far ahead of a typical midterm year
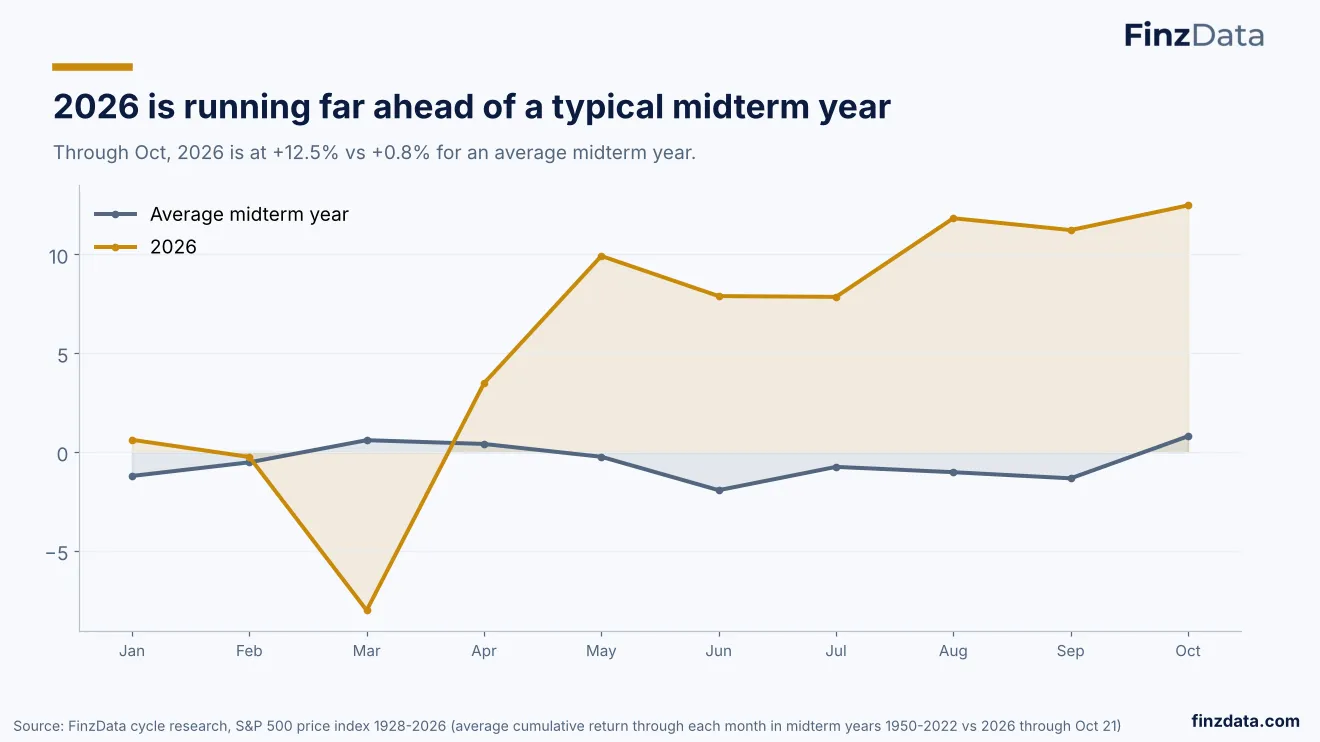
2026 S&P 500 is up 12.5% through October versus 0.8% average midterm year.
FinzData cycle research shows 2026 is running far ahead of a typical midterm year through October. The S&P 500 is at +12.5% year-to-date, compared with +0.8% for an average midterm year, with the outperformance visible across Jan to Oct.
The divergence matters for investors tracking the 2026 midterm election spending cycle and for campaigns assessing market backdrop. The chart compares cumulative performance month by month. Source is FinzData institutional deck "Midterm Money: Who Is Paying for the 2026 Midterms and What It Means for Markets" dated October 22, 2026.
42. Midterm years bring an average -17.5% drawdown
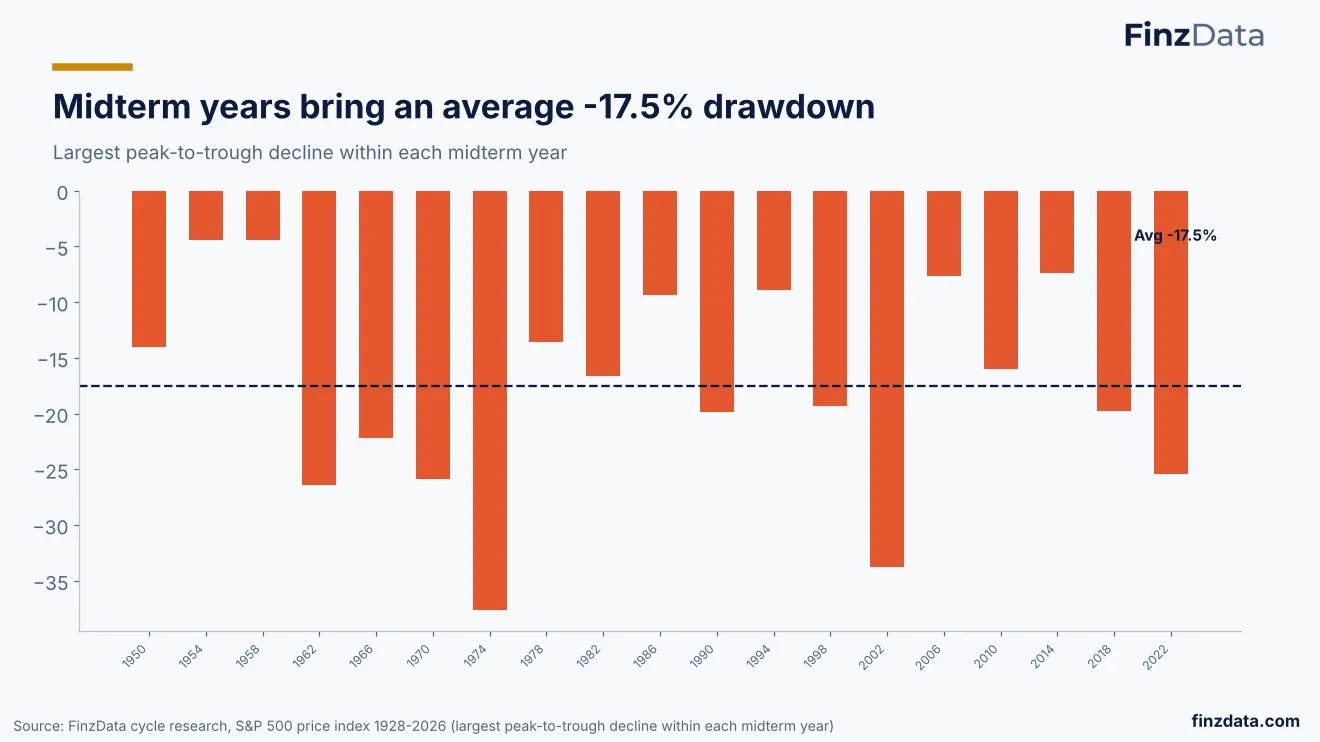
Midterm years average a 17.5% peak-to-trough drawdown.
FinzData cycle research highlights drawdown risk in midterm years. The largest peak-to-trough decline within each midterm year averages -17.5%, illustrating the typical volatility investors face around the 2026 midterm election spending period.
The chart displays the distribution of maximum declines across midterm years. The average -17.5% drawdown is a key reference for risk management and for campaigns monitoring market sentiment. Source is FinzData institutional deck "Midterm Money: Who Is Paying for the 2026 Midterms and What It Means for Markets" dated October 22, 2026.
43. After Election Day, stocks rose under every outcome
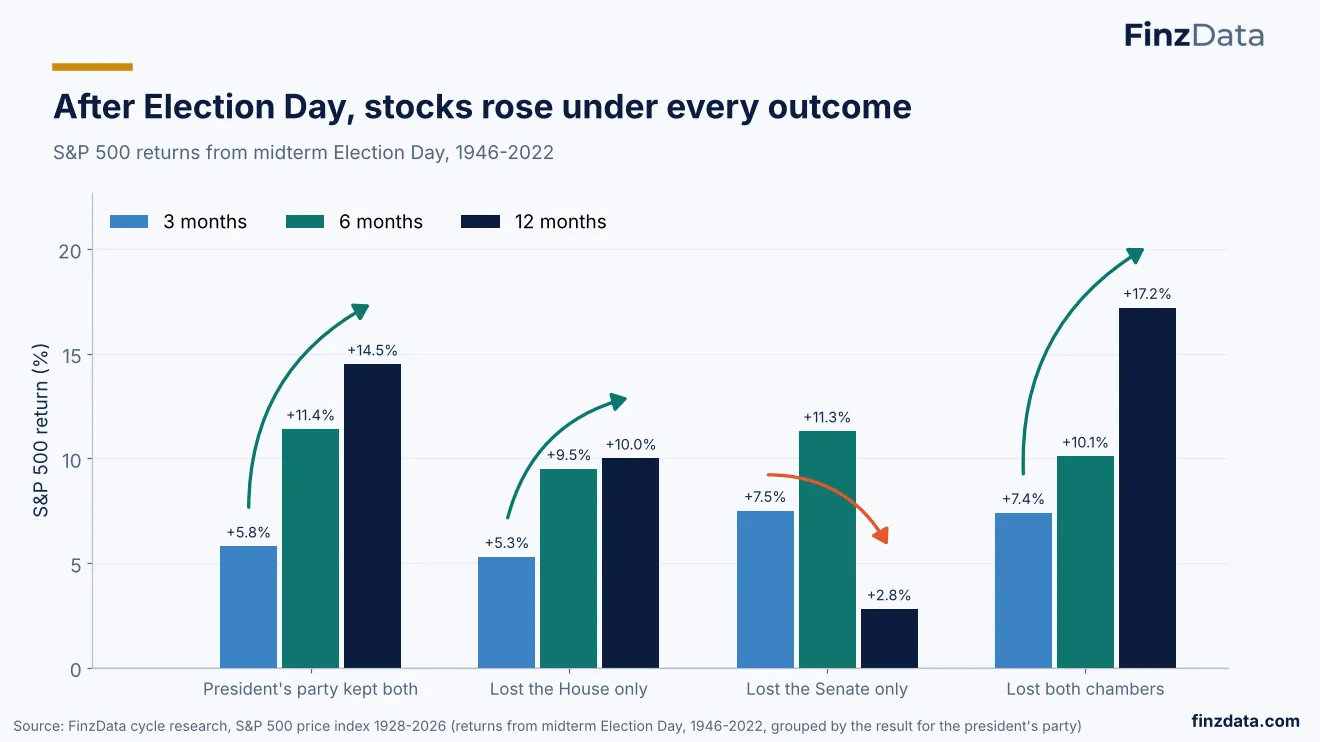
S&P 500 rose after every midterm Election Day outcome from 1946 to 2022.
FinzData cycle research finds S&P 500 returns were positive from midterm Election Day under every outcome for the president's party between 1946 and 2022. Three, six and twelve month returns are shown for kept both, lost House only, lost Senate only and lost both chambers.
The data show post-election gains across outcomes, with 12-month returns ranging from +2.8% to +17.2% and 3-month returns up to +14.5%. The pattern informs discussion of S&P 500 after midterm elections and market behavior around outside spending and super PACs. Source is FinzData institutional deck "Midterm Money: Who Is Paying for the 2026 Midterms and What It Means for Markets" dated October 22, 2026.
44. Since 1946, stocks rose in the year after every midterm (avg +14.3%)
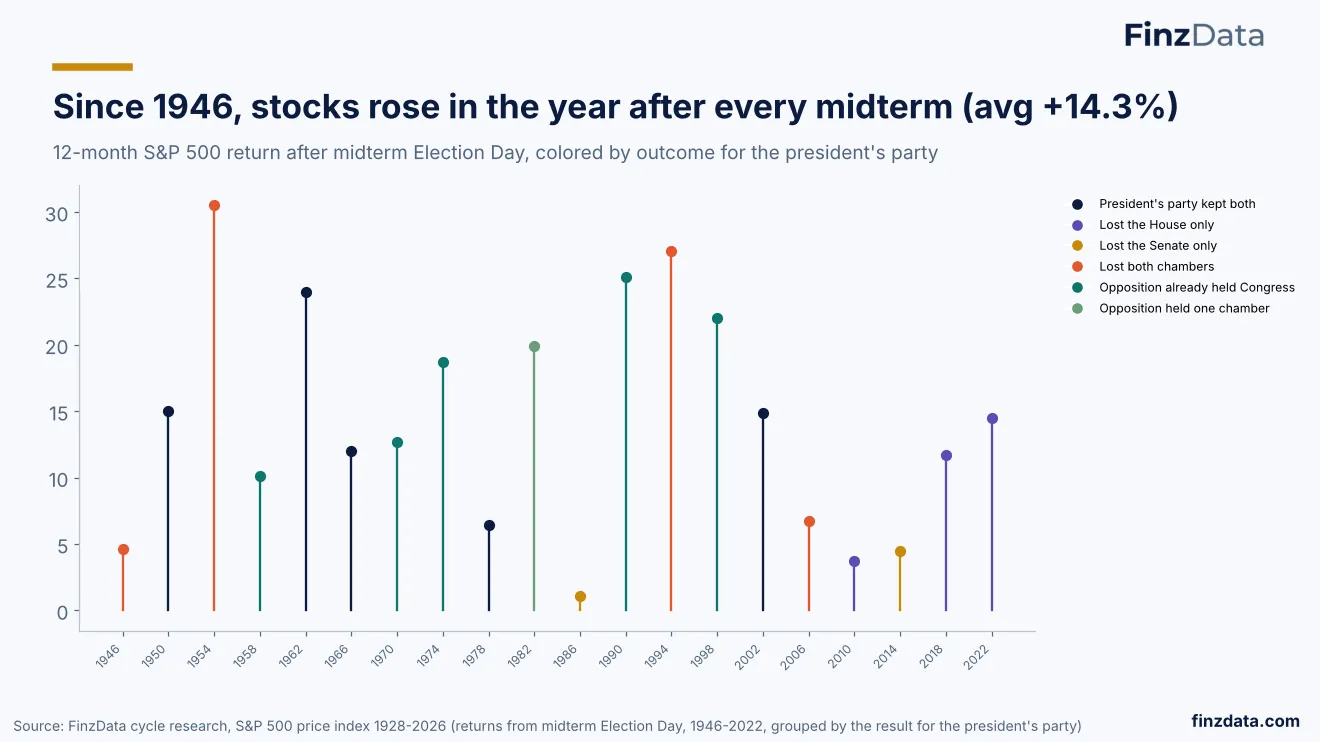
S&P 500 rose in the year after every midterm since 1946, averaging 14.3%.
Since 1946, stocks rose in the year after every midterm election, with an average 12-month S&P 500 return of +14.3% after Election Day. FinzData cycle research colors outcomes by whether the president's party kept both chambers, lost the House only, lost the Senate only, lost both chambers, or faced opposition control.
The chart shows 12-month returns after midterm Election Day across elections. The consistent positive year is relevant for investors evaluating S&P 500 after midterm elections and for campaigns tracking market context amid 2026 midterm election spending. Source is FinzData institutional deck "Midterm Money: Who Is Paying for the 2026 Midterms and What It Means for Markets" dated October 22, 2026.
45. How midterms since 1946 ended for the president's party
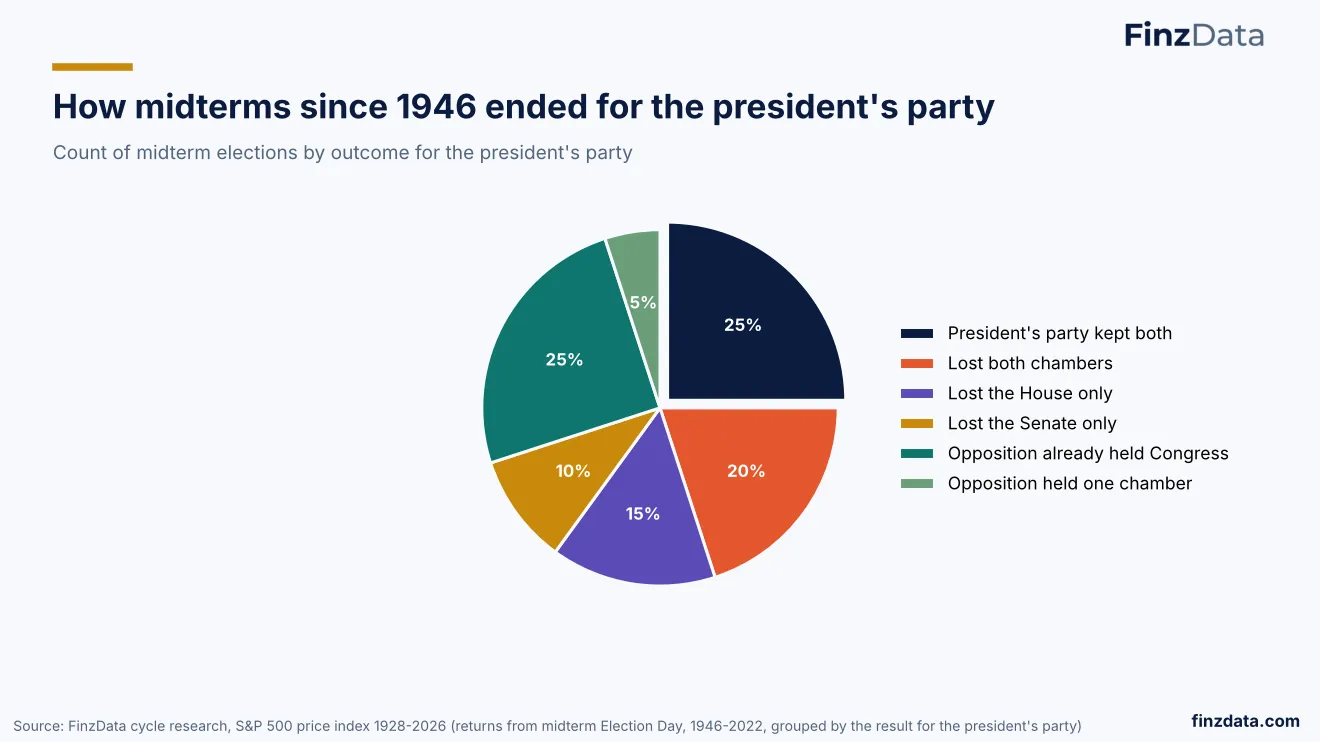
Since 1946, president’s party kept both chambers 25% of midterms and lost both chambers 20%.
Outcome for the president’s party in midterms since 1946 shows kept both chambers 25%, lost both chambers 20%, lost the House only 15%, lost the Senate only 10%, opposition already held Congress 25%, opposition held one chamber 5%.
The distribution highlights the historical frequency of losses for the president’s party and the range of possible congressional outcomes. For campaigns and market participants, the record underscores the variability of midterm results and the importance of chamber-specific dynamics.
Source: FinzData, FinzData.
46. The post-midterm rally
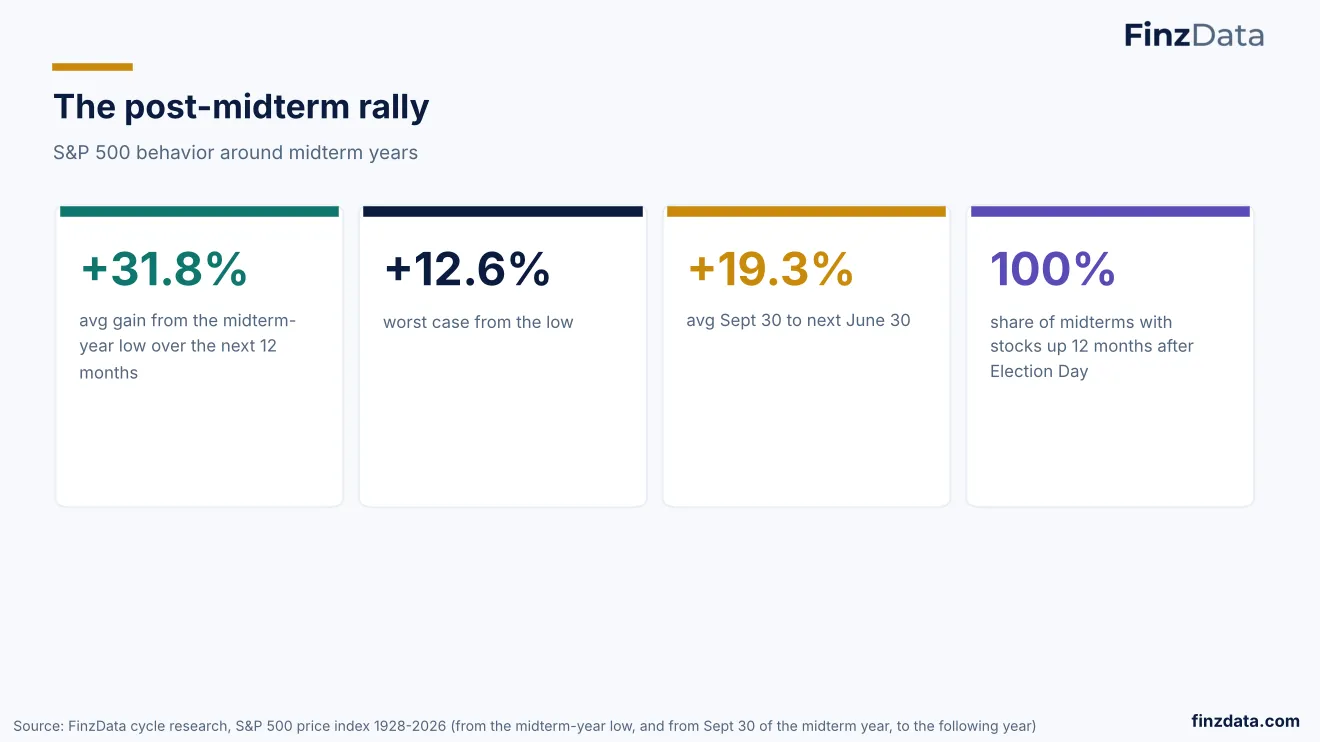
S&P 500 gained +31.8% on average from midterm-year low over next 12 months, with 100% up 12 months after Election Day.
The post-midterm rally shows the S&P 500 gained +31.8% on average from the midterm-year low over the next 12 months, with the worst case +12.6%. From Sept 30 of the midterm year to the following June 30 it averaged +19.3%.
100% of midterms saw stocks up 12 months after Election Day. The pattern reflects the historical tendency for markets to recover and advance in the year following midterm elections, providing a reference point for timing and sentiment.
Source: FinzData, FinzData.
47. Context, not a forecast
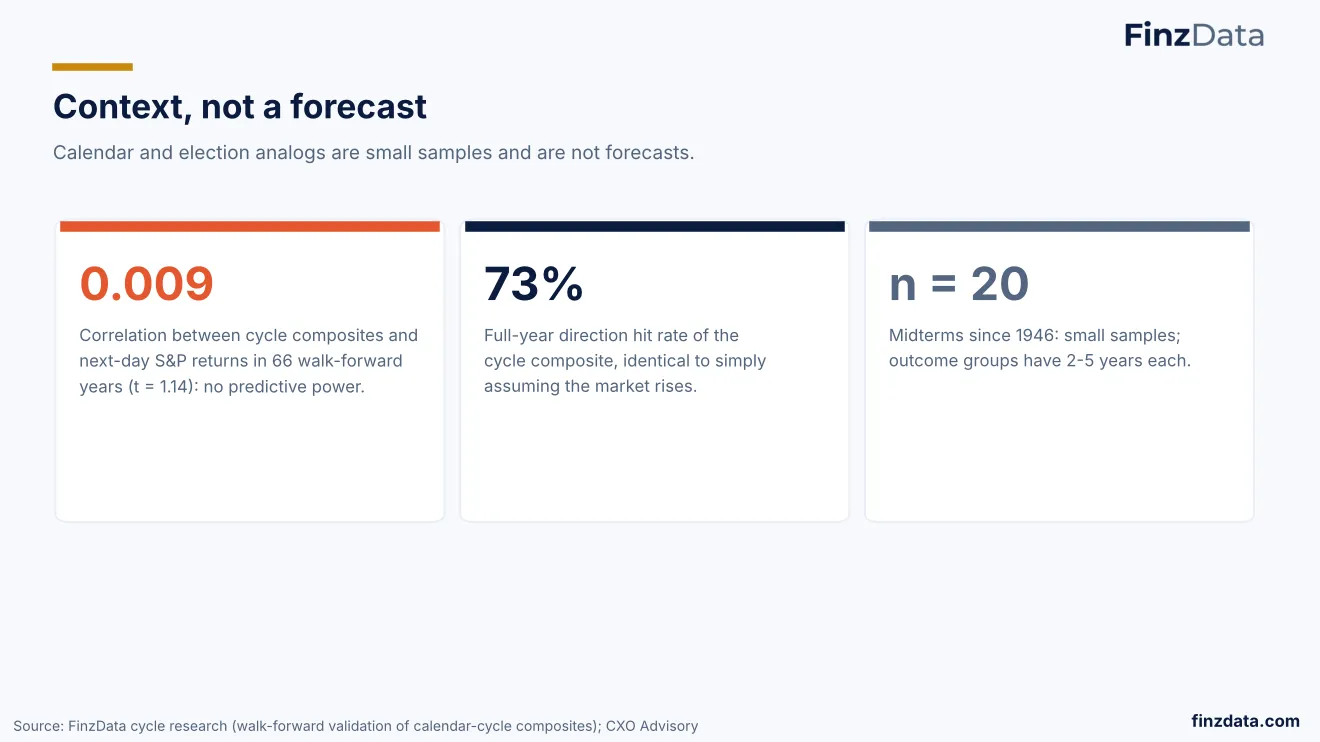
Calendar and election analogs show no predictive power with 0.009 correlation and 73% hit rate.
The slide frames calendar and election analogs as context, not a forecast, noting small samples and limited predictive value for S&P 500 returns.
FinzData cycle research reports a 0.009 correlation between cycle composites and next-day S&P returns in 66 walk-forward years with t = 1.14, and a 73% full-year direction hit rate identical to simply assuming the market rises. The sample covers n = 20 midterms since 1946.
48. Our read: what it means for markets
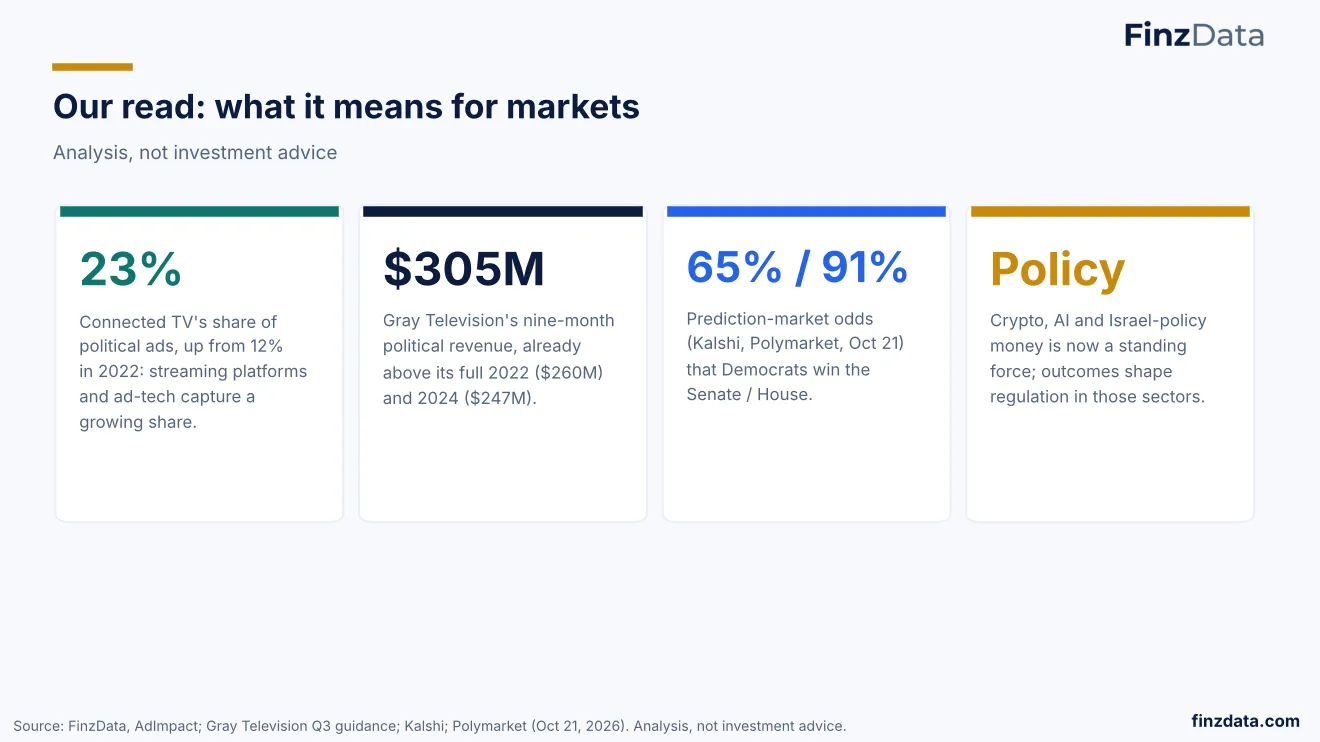
Connected TV is 23% of political ads and Gray Television political revenue reached $305M.
The read highlights shifts in 2026 midterm election spending, with Connected TV’s share of political ads at 23%, up from 12% in 2022, as streaming platforms and ad-tech capture more spend.
Gray Television’s nine-month political revenue is $305M, already above full 2022 $260M and 2024 $247M. Prediction-market odds on Oct 21 show 65% / 91% for Democrats winning the Senate / House, and policy money in crypto, AI and Israel-policy is noted as a standing force.
49. What to watch
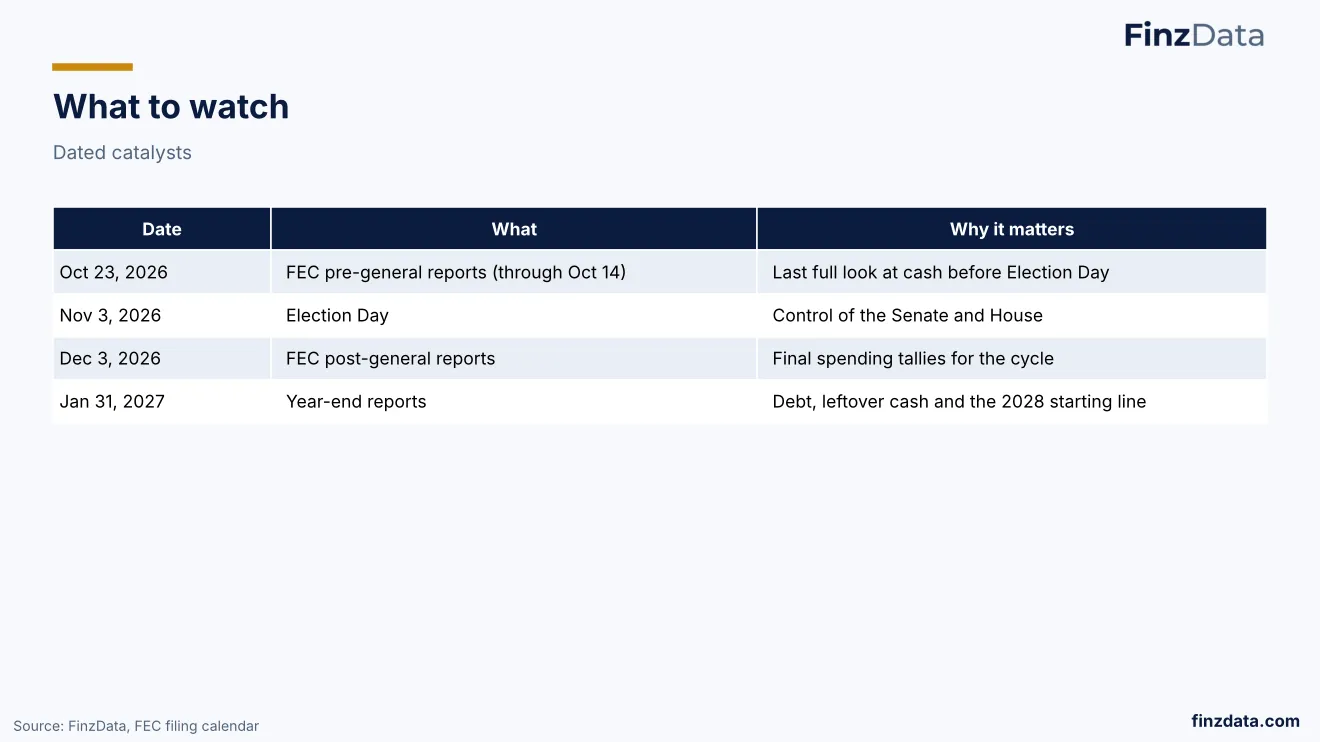
Key 2026 midterm dates include FEC reports on Oct 23 and Dec 3, Election Day Nov 3.
The watch list outlines dated catalysts for the 2026 midterm election cycle. FEC pre-general reports through Oct 14 are due Oct 23, 2026, providing the last full look at cash before Election Day.
Election Day is Nov 3, 2026 for control of the Senate and House, followed by FEC post-general reports Dec 3, 2026 and year-end reports Jan 31, 2027 for debt and 2028 starting positions.
50. The data behind this deck
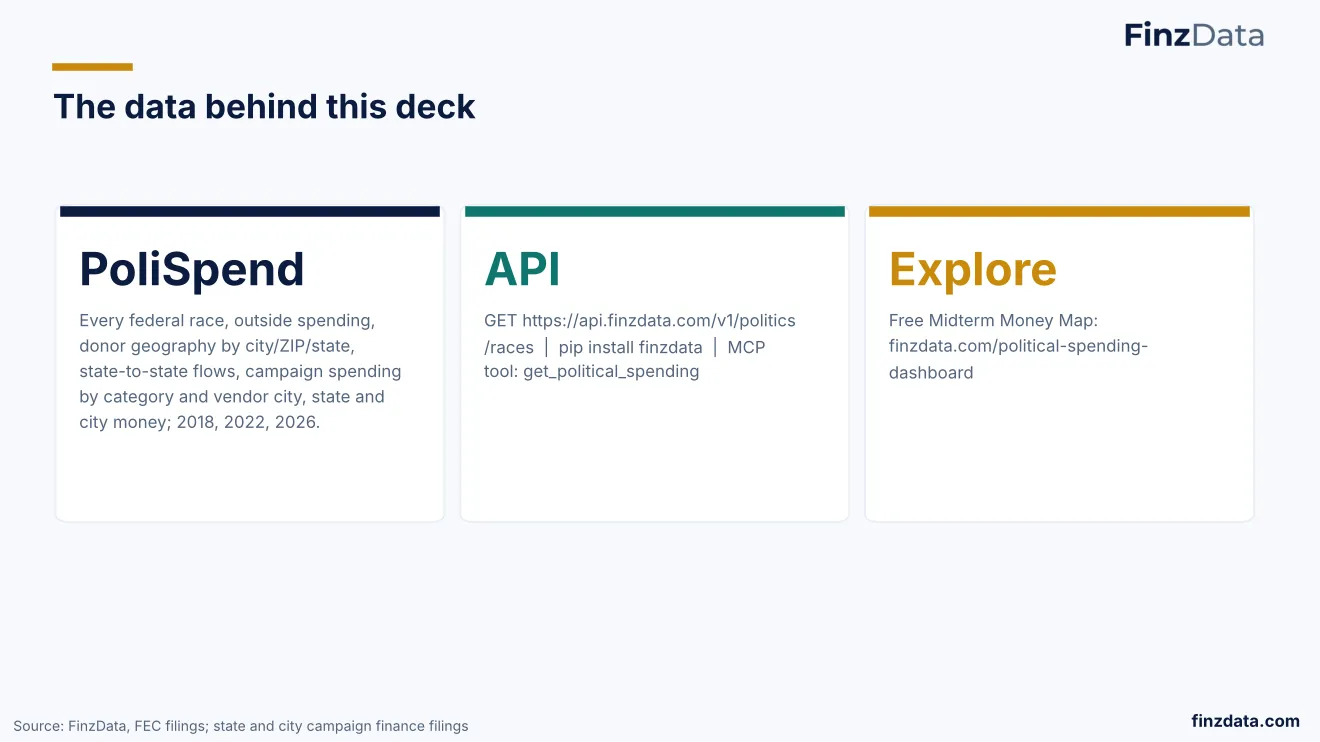
PoliSpend provides state-to-state flows and campaign spending data for 2018, 2022, 2026.
The data slide describes PoliSpend as the source behind the deck, covering state-to-state flows, campaign spending by category and vendor, and city and state money for 2018, 2022 and 2026.
Access is via API tool get_political_spending and an explore dashboard. The data underpins analysis of 2026 midterm election spending, outside spending and super PACs in the FinzData institutional research.
Frequently asked questions
How much is being spent on the 2026 midterm elections?
FinzData analysis of FEC filings and AdImpact projects $11.6B in 2026 midterm ad spend, up from $8.9B in 2022. Outside money is on pace for $2.00B through October, +49% vs 2022 at same point.
How does the stock market perform after midterm elections?
FinzData cycle research shows the S&P 500 was higher 12 months after Election Day in all 20 midterms since 1946, averaging +14.3%. Midterm years average +3.7% vs +14.0% in pre-election years.
What are the odds Democrats win the Senate and House in 2026?
Prediction-market odds cited by FinzData on Oct 21, 2026 price Democrats at 65% to win the Senate and 91% to win the House. The briefing notes markets expect a Democratic House and lean Democratic Senate.
How much outside money is in the 2026 midterms?
FinzData tracks outside spending at $2.00B pace through Oct 5, 2026, vs $1.32B at same point in 2022. 2026 outside money has blown past every midterm record, nearly tripling since 2018.
What is the projected ad spending by state in 2026?
FinzData projections show California $979M, Michigan $852M, Texas $850M, Ohio $749M and Georgia $700M will each see $700M+ in political ads. Five states will see $700M+ each.
Do stocks rise after a Republican sweep or divided Congress?
FinzData historical analogs show Republican Sweep Hold averaged +14.5% S&P 500 12 months after Election Day, Divided Democratic House +10.0%, Divided Democratic Senate +2.8%, Full Democratic Congress +17.2%.
Download the deck (PDF, 50 slides) More research
Explore the data behind this deck: the Midterm Money Map (free, searchable by state, race, donor ZIP and spender), the FinzData PoliSpend dataset with every federal race, outside spending, state and city money for 2018, 2022 and 2026, and the API (GET https://api.finzdata.com/v1/politics/races).
Built for AI, quants, data scientists and financial analysts who backtest. Clean data. Real insights. Real alpha. finzdata.com. This material is for information only and is not investment advice. Data sources: FEC filings; AdImpact; OpenSecrets; Brennan Center; Public Citizen; state campaign finance filings (California, Texas, New York, Washington, Colorado); Kalshi; Polymarket; FinzData cycle research on the S&P 500 price index, 1928-2026.
Get FinzData research free, every morning
The daily brief: what moved, the macro releases that matter, positioning and liquidity, with charts. One email a day, free, unsubscribe anytime.
Topics and related searches
Elections and political spending Equity strategy and factors Volatility
People also search
- how much is being spent on 2026 midterm ads
- who is spending the most outside money in 2026 midterms
- what is projected political ad spend for 2026
- s&p 500 performance 12 months after midterm elections
- are democrats out raising republicans in 2026
- which states have the most political ad spending 2026
- how much outside money is in 2026 midterms vs 2022
- crypto and ai political donations 2026
- actblue vs winred receipts 2026
- what are prediction market odds for senate and house 2026
- top super pacs spending 2026 midterms
- midterm year stock market average return