FinzData Research · Published 12 November 2026
AI Jobs, AI Adoption and AI Productivity: what the data shows
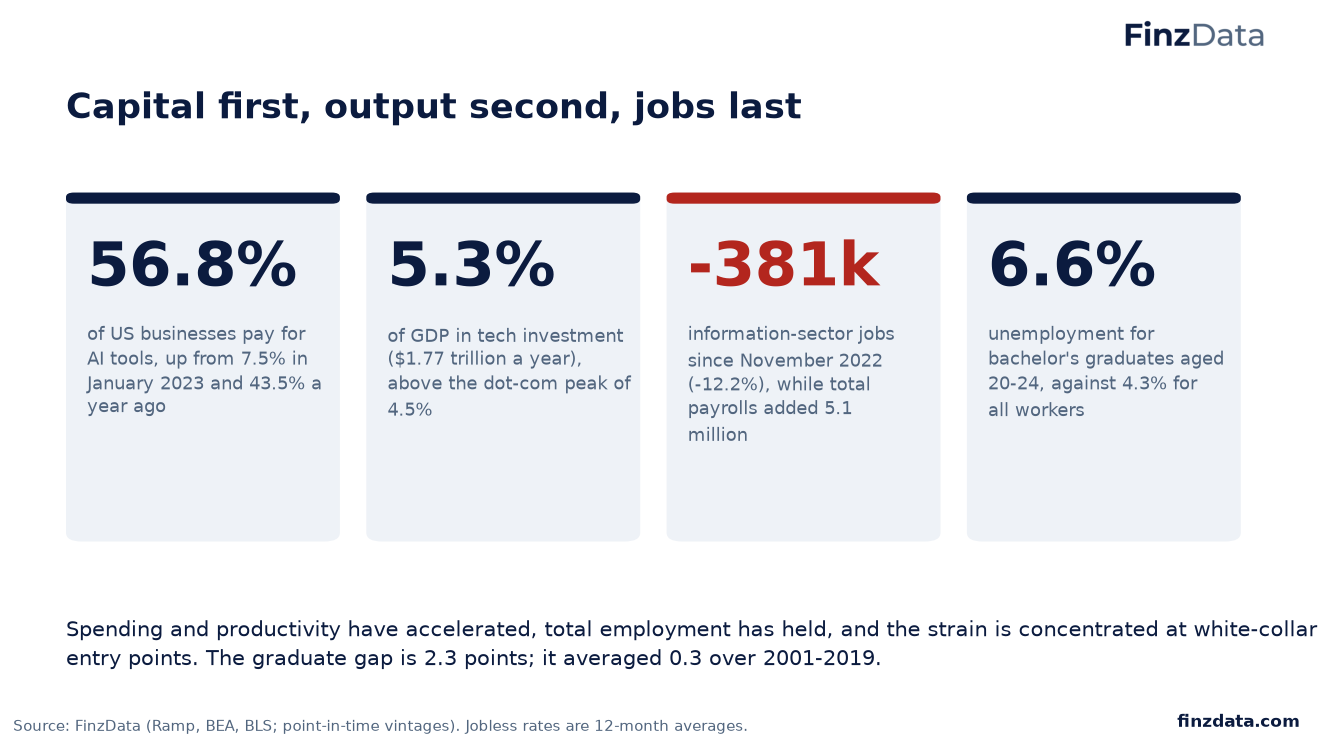
Four years after generative AI went mainstream, 56.8% of US businesses pay for it, tech investment is a record 5.3% of GDP and productivity is growing 2.7% a year. Total employment has held, but information-sector jobs are down 381 thousand and bachelor's graduates aged 20-24 face a 6.6% jobless rate against 4.3% for all workers. Capital first, output second, jobs last.
Get FinzData research free, every morning
The daily brief: what moved, the macro releases that matter, positioning and liquidity, with charts. One email a day, free, unsubscribe anytime.
Contents
- Scorecard: where the AI economy stands
- The AI economy in six charts
- More than half of US businesses now pay for AI
- Adoption is still accelerating
- Four in ten workers use generative AI on the job
- Time saved is largest in management and knowledge work
- Gains are spreading unevenly: some fields doubled, some slipped
- Tech investment has passed its dot-com share of GDP
- Hardware is leading the build-out; software trails
- The hardware trail runs through Taiwan and Korea
- AI hardware has rewired Taiwan's trade toward the US
- Demand reaches beyond GPUs into storage and components
- Data centers show up in the power bill
- Output and productivity have pulled away from payrolls
- Productivity growth has more than doubled its 2010s pace
- The gains so far have accrued to capital
- Jobs are shifting from screens to sites
- Hiring is concentrated where AI saves the least time
- Sectors that save more time with AI have added fewer jobs
- White-collar work is splitting, not collapsing
- Hiring demand has cooled well below its 2022 peak
- Young graduates now fare worse than the average worker
- The graduate penalty has persisted for years, not months
- The first rung is harder to reach
- Unemployment has risen most, in relative terms, for degree holders
- A degree still protects, but by less than it used to
- Job searches are taking longer
- The Street still expects the build-out to grow
- Three paths from here
- What could make this read wrong
- Our read
- What to watch
- Method
- The data behind this deck
- Frequently asked questions
1. Capital first, output second, jobs last
Capital first, output second, jobs last
56.8% of US businesses pay for AI tools, up from 7.5% in January 2023 and 43.5% a year ago 5.3% of GDP in tech investment ($1.77 trillion a year), above the dot-com peak of 4.5% -381k information-sector jobs since November 2022 (-12.2%), while total payrolls added 5.1 million 6.6% unemployment for bachelor's graduates aged 20-24, against 4.3% for all workers Spending and productivity have accelerated, total employment has held, and the strain is concentrated at white-collar entry points. The graduate gap is 2.3 points; it averaged 0.3 over 2001-2019.
2. Scorecard: where the AI economy stands
Scorecard: where the AI economy stands
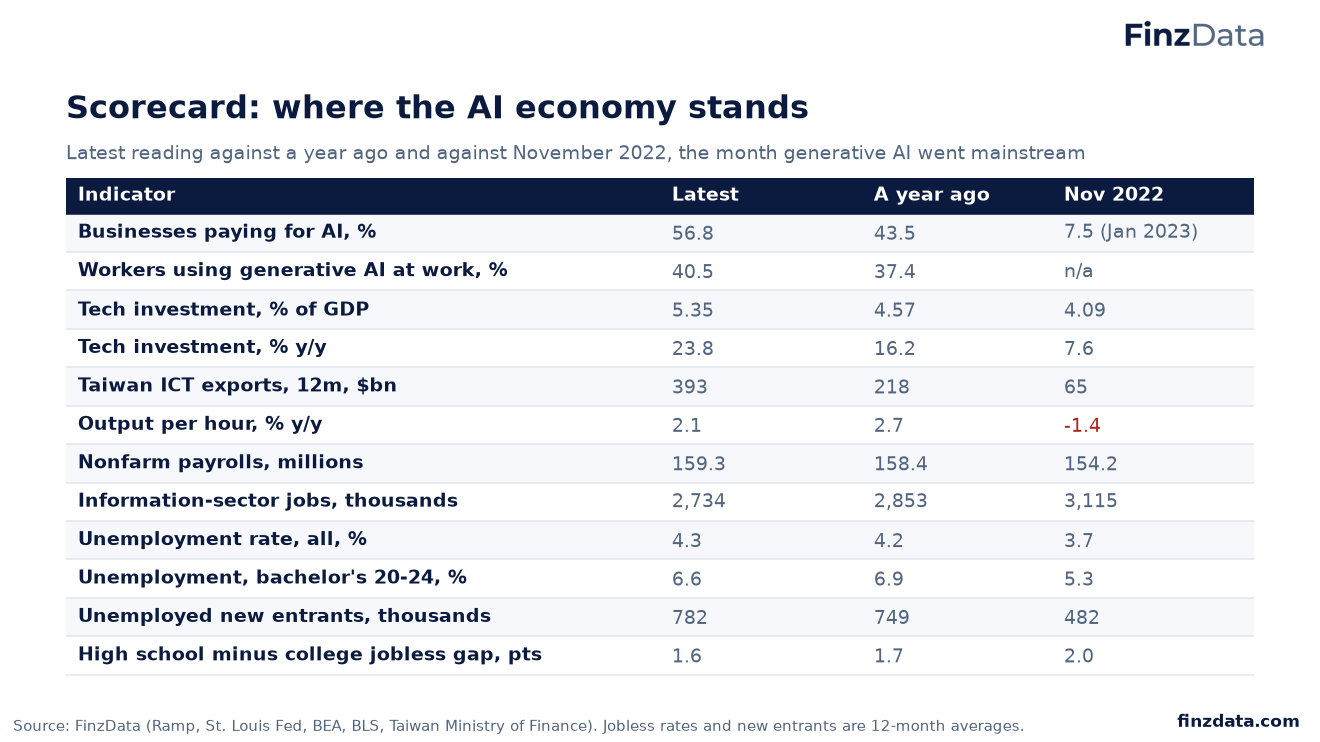
Twelve indicators, each shown at its latest reading, a year ago and in November 2022.
3. The AI economy in six charts
The AI economy in six charts
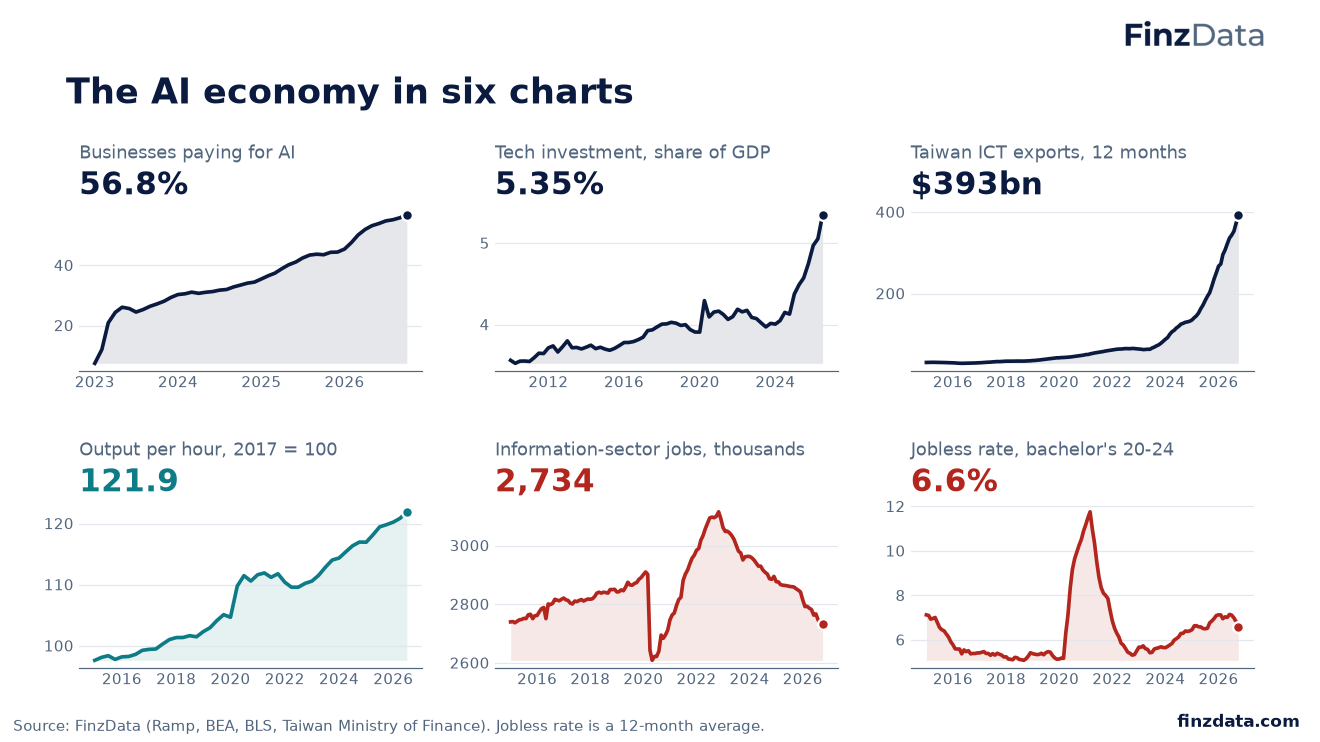
Six of the deck's core series at a glance.
4. More than half of US businesses now pay for AI
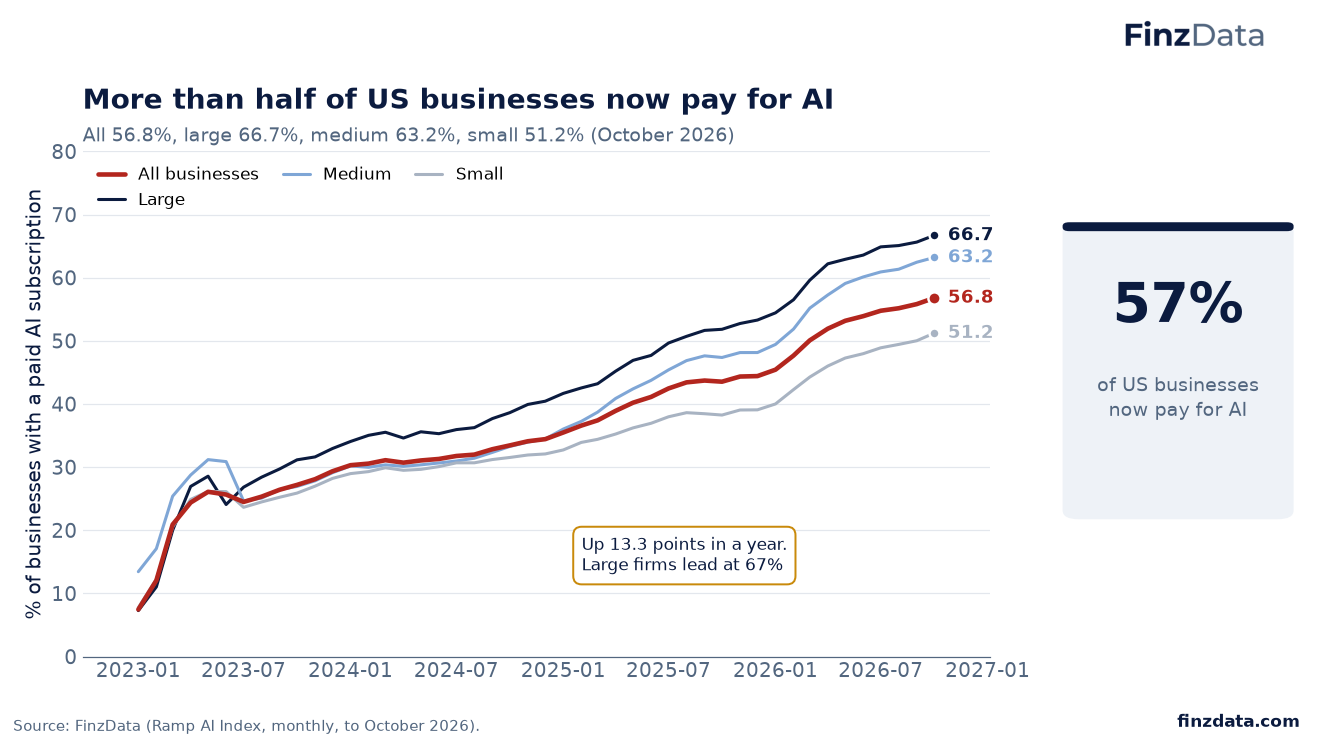
57% of US businesses now pay for AI
All 56.8%, large 66.7%, medium 63.2%, small 51.2% (October 2026).
Up 13.3 points in a year. Large firms lead at 67%.
5. Adoption is still accelerating
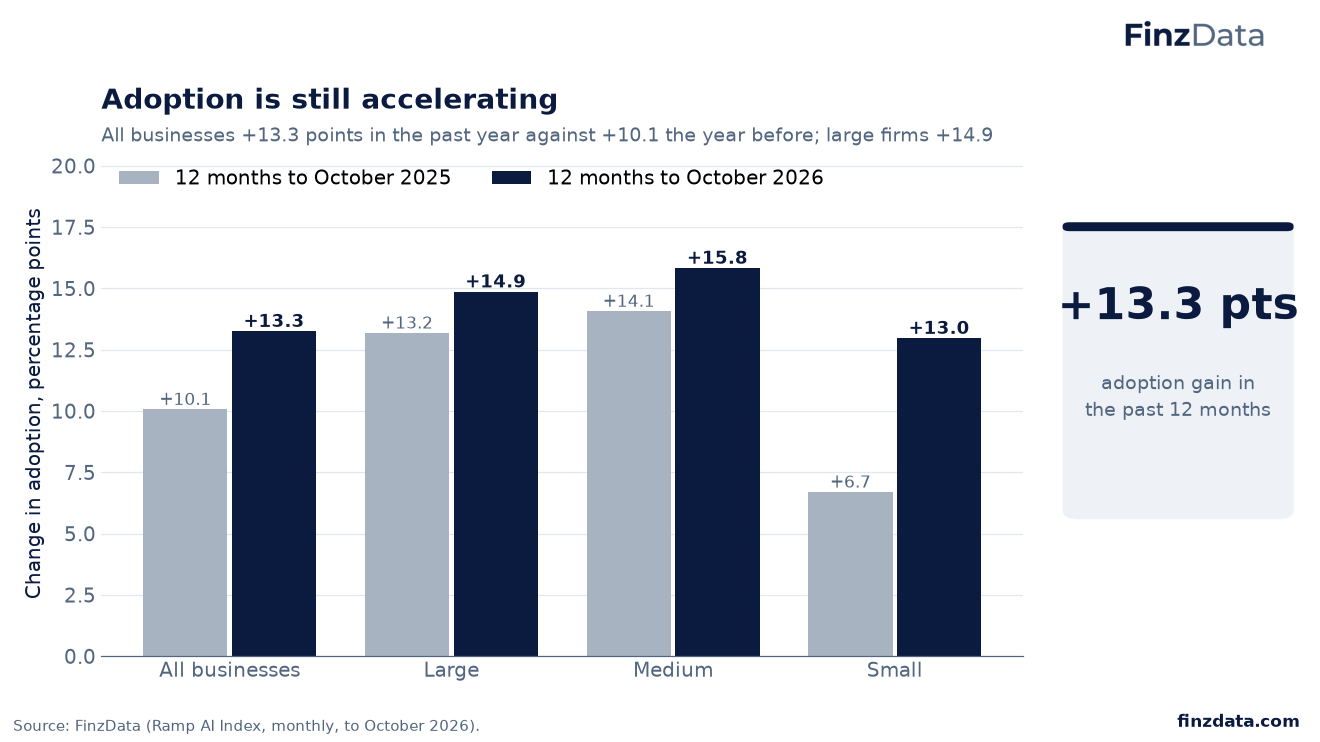
+13.3 pts adoption gain in the past 12 months
All businesses +13.3 points in the past year against +10.1 the year before; large firms +14.9.
6. Four in ten workers use generative AI on the job
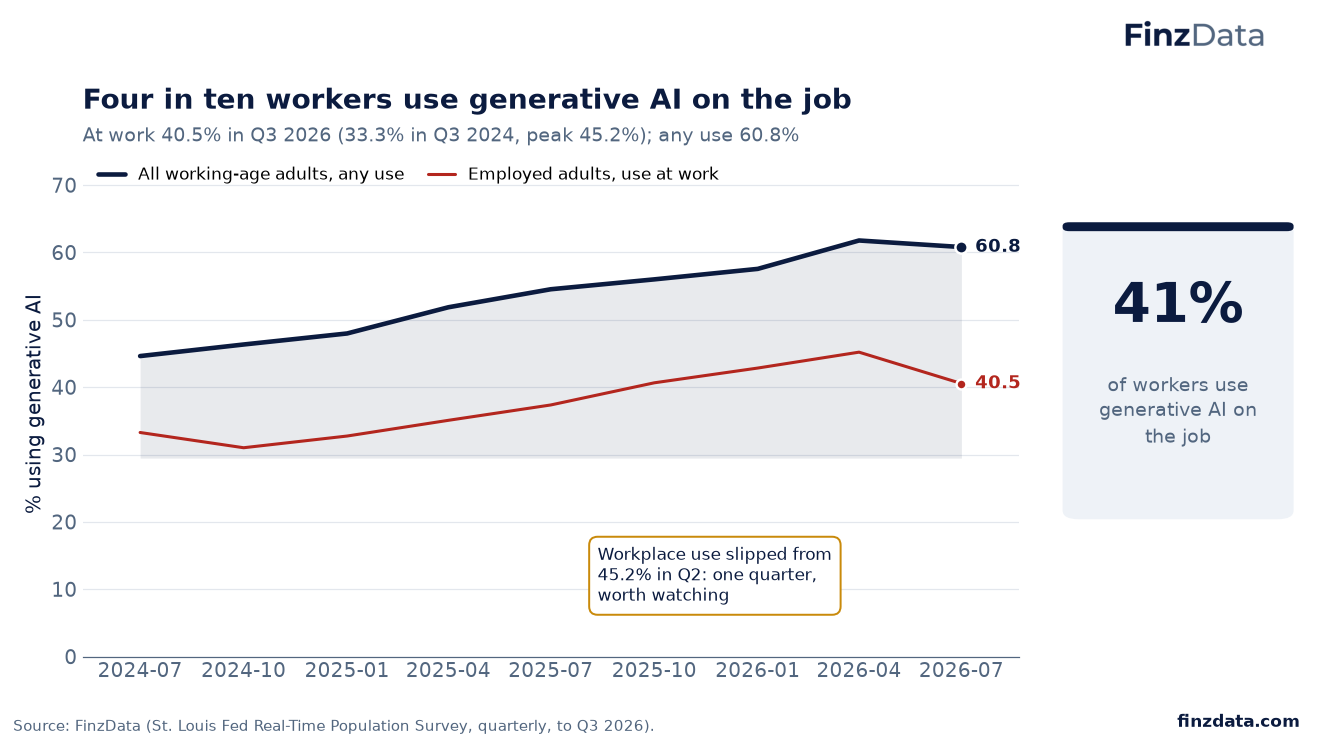
41% of workers use generative AI on the job
At work 40.5% in Q3 2026 (33.3% in Q3 2024, peak 45.2%); any use 60.8%.
Workplace use slipped from 45.2% in Q2: one quarter, worth watching.
7. Time saved is largest in management and knowledge work
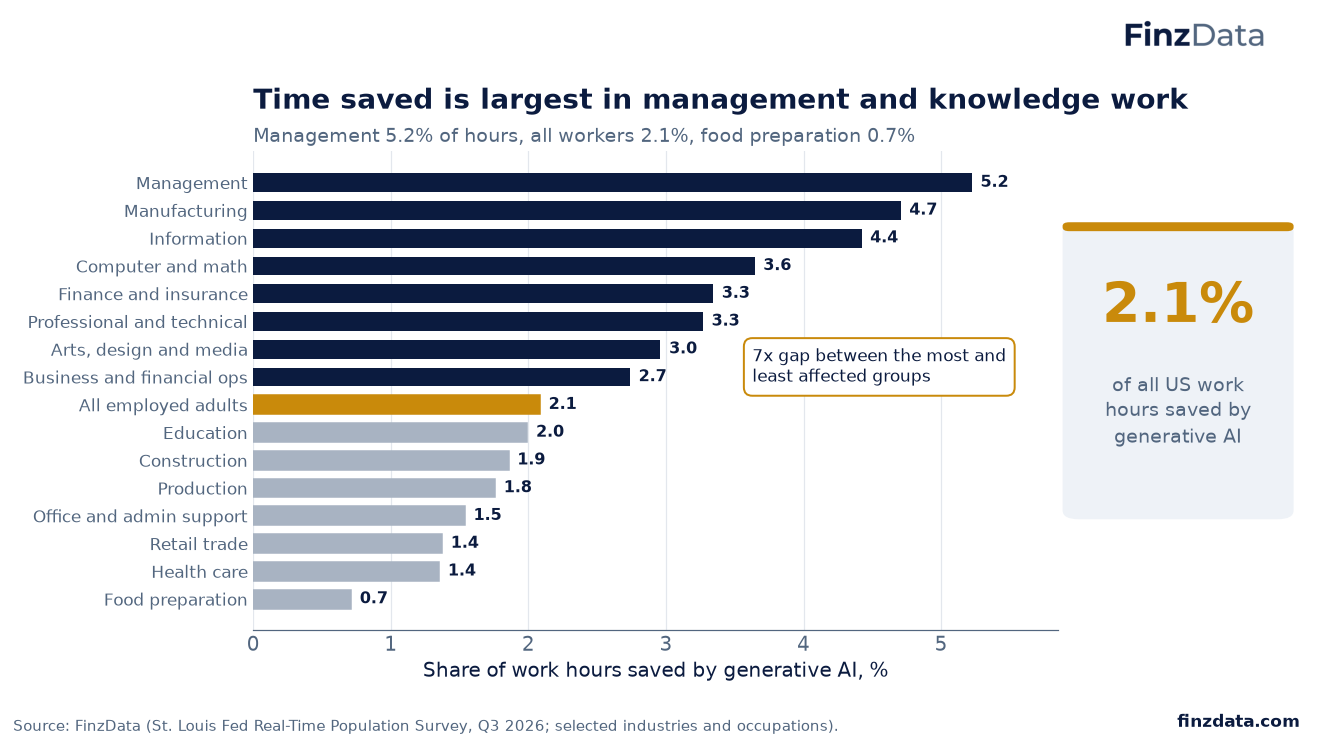
2.1% of all US work hours saved by generative AI
Management 5.2% of hours, all workers 2.1%, food preparation 0.7%.
7x gap between the most and least affected groups.
8. Gains are spreading unevenly: some fields doubled, some slipped
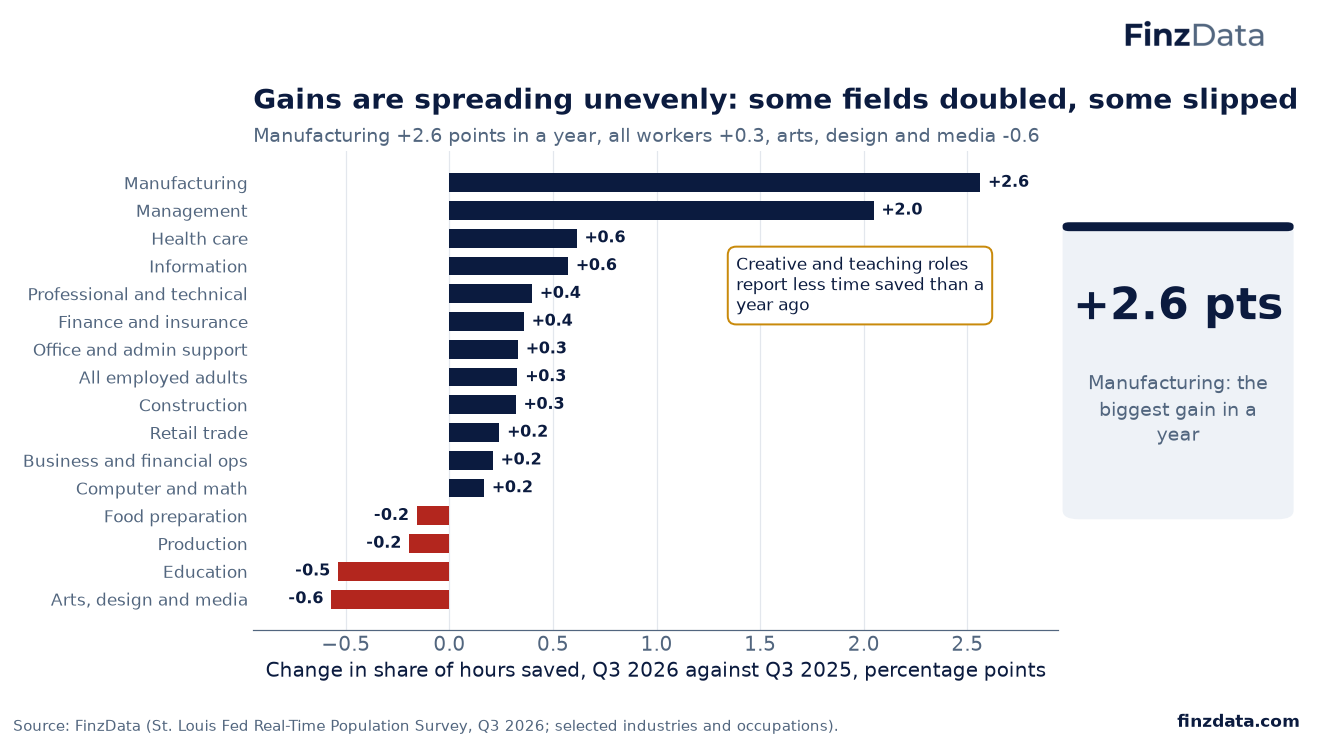
+2.6 pts Manufacturing: the biggest gain in a year
Manufacturing +2.6 points in a year, all workers +0.3, arts, design and media -0.6.
Creative and teaching roles report less time saved than a year ago.
9. Tech investment has passed its dot-com share of GDP
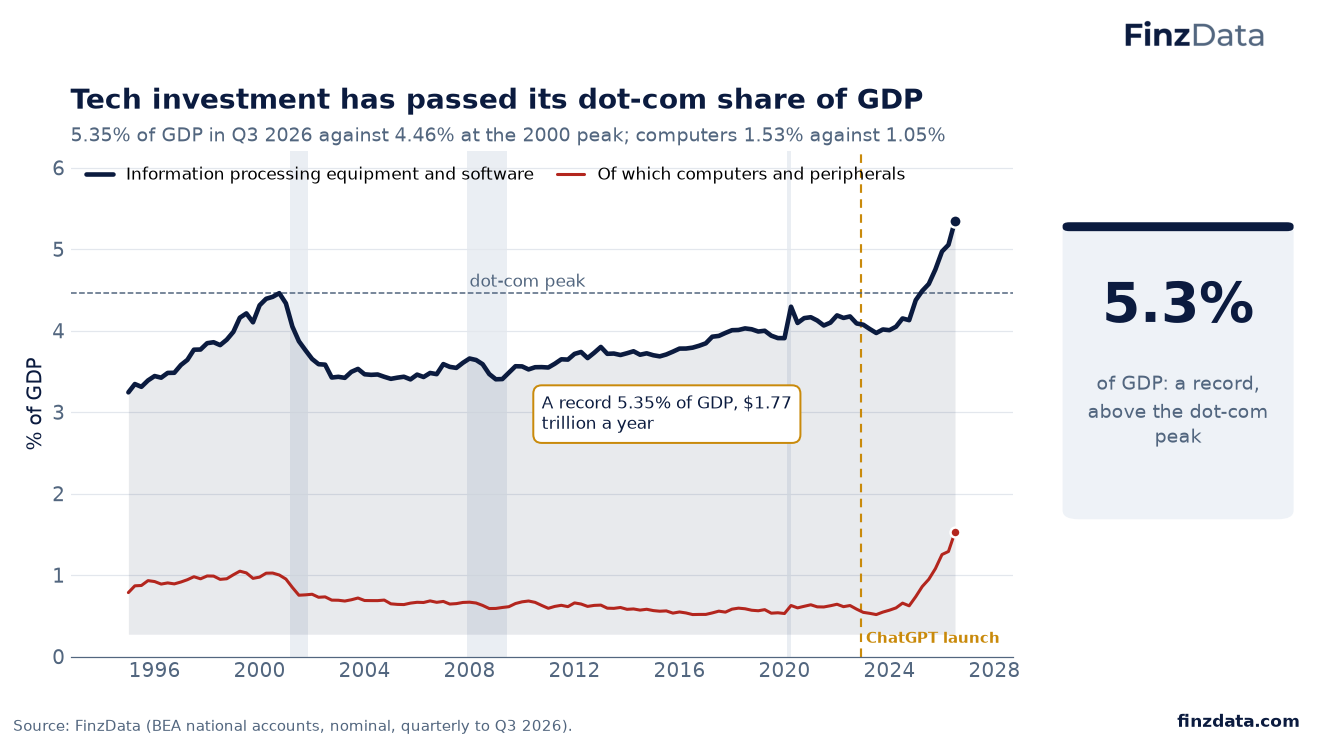
5.3% of GDP: a record, above the dot-com peak
5.35% of GDP in Q3 2026 against 4.46% at the 2000 peak; computers 1.53% against 1.05%.
A record 5.35% of GDP, $1.77 trillion a year.
10. Hardware is leading the build-out; software trails
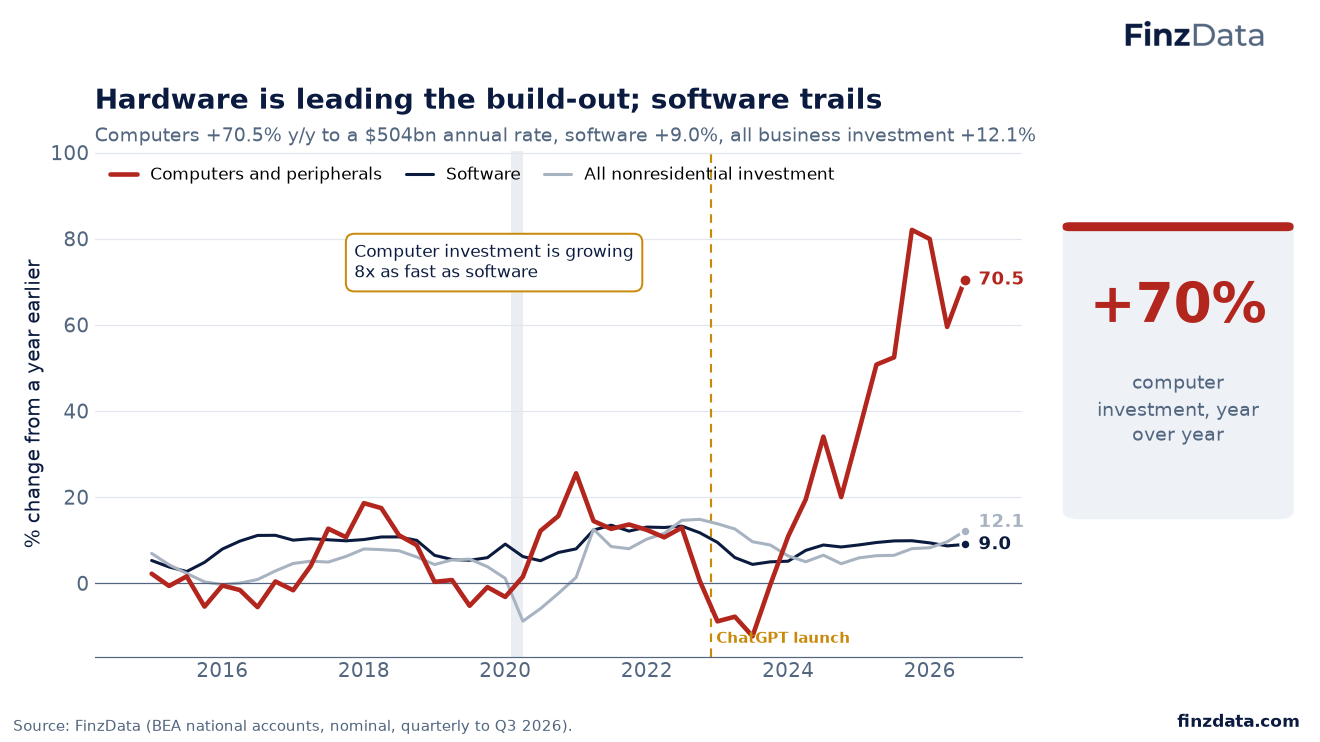
+70% computer investment, year over year
Computers +70.5% y/y to a $504bn annual rate, software +9.0%, all business investment +12.1%.
Computer investment is growing 8x as fast as software.
11. The hardware trail runs through Taiwan and Korea
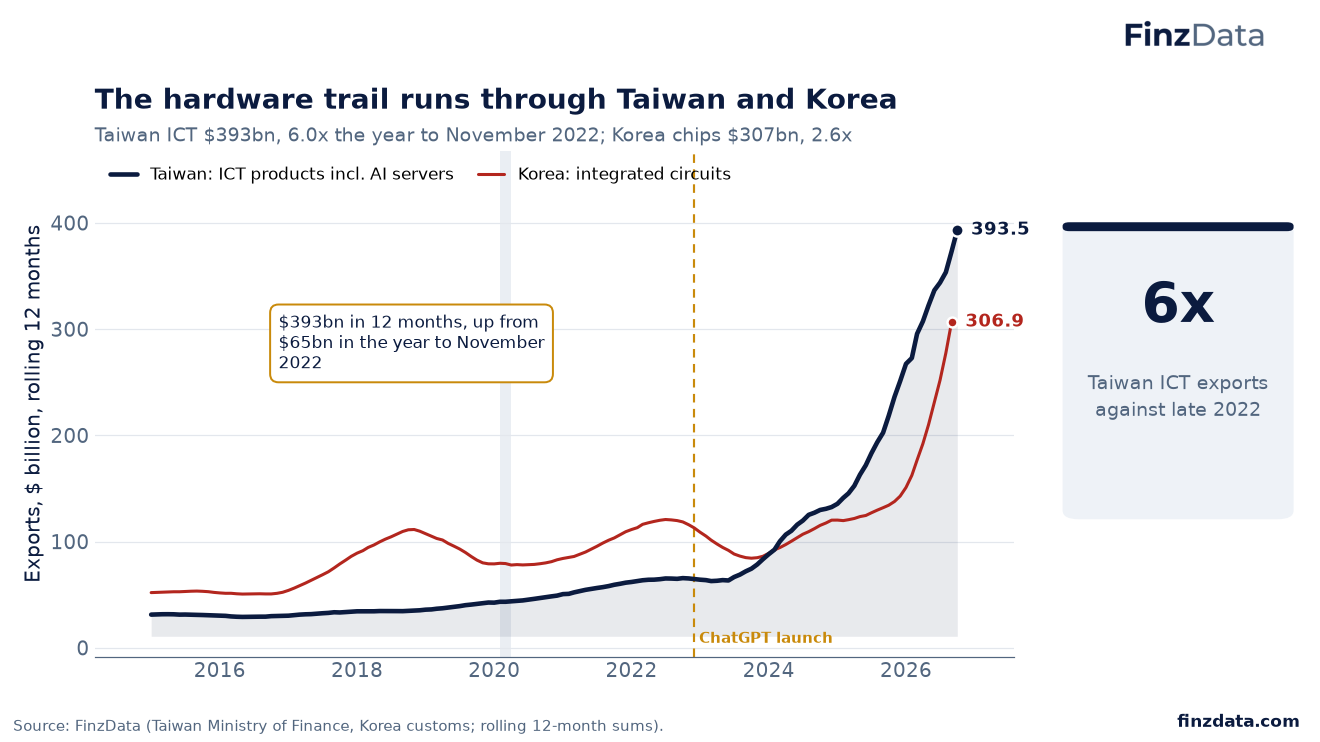
6x Taiwan ICT exports against late 2022
Taiwan ICT $393bn, 6.0x the year to November 2022; Korea chips $307bn, 2.6x.
$393bn in 12 months, up from $65bn in the year to November 2022.
12. AI hardware has rewired Taiwan's trade toward the US
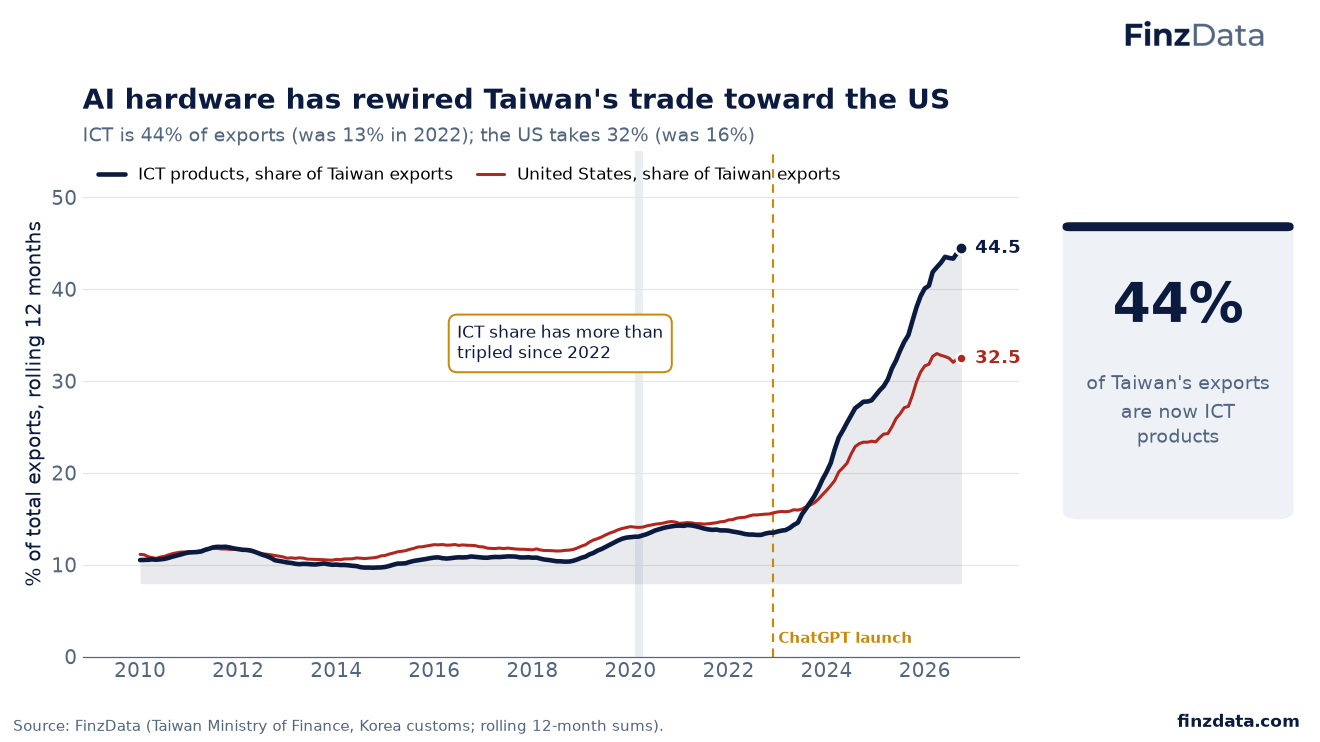
44% of Taiwan's exports are now ICT products
ICT is 44% of exports (was 13% in 2022); the US takes 32% (was 16%).
ICT share has more than tripled since 2022.
13. Demand reaches beyond GPUs into storage and components
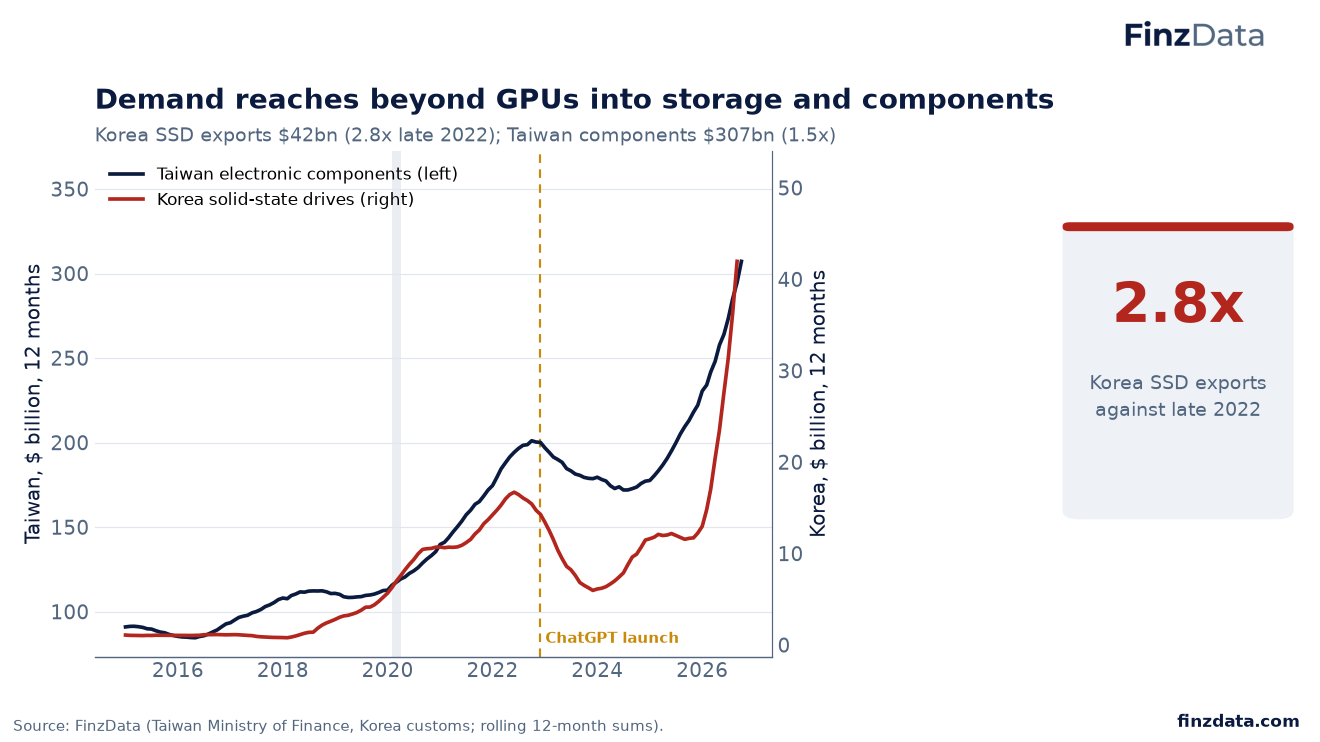
2.8x Korea SSD exports against late 2022
Korea SSD exports $42bn (2.8x late 2022); Taiwan components $307bn (1.5x).
14. Data centers show up in the power bill
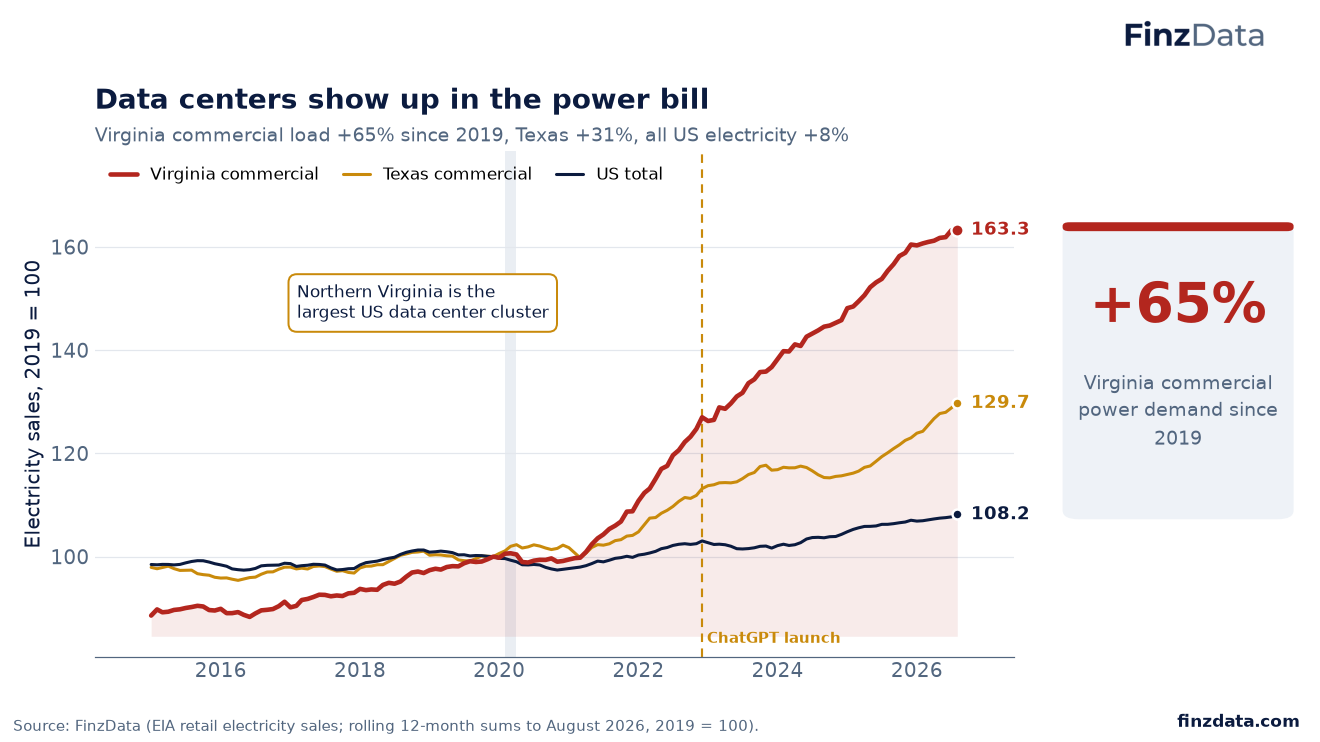
+65% Virginia commercial power demand since 2019
Virginia commercial load +65% since 2019, Texas +31%, all US electricity +8%.
Northern Virginia is the largest US data center cluster.
15. Output and productivity have pulled away from payrolls
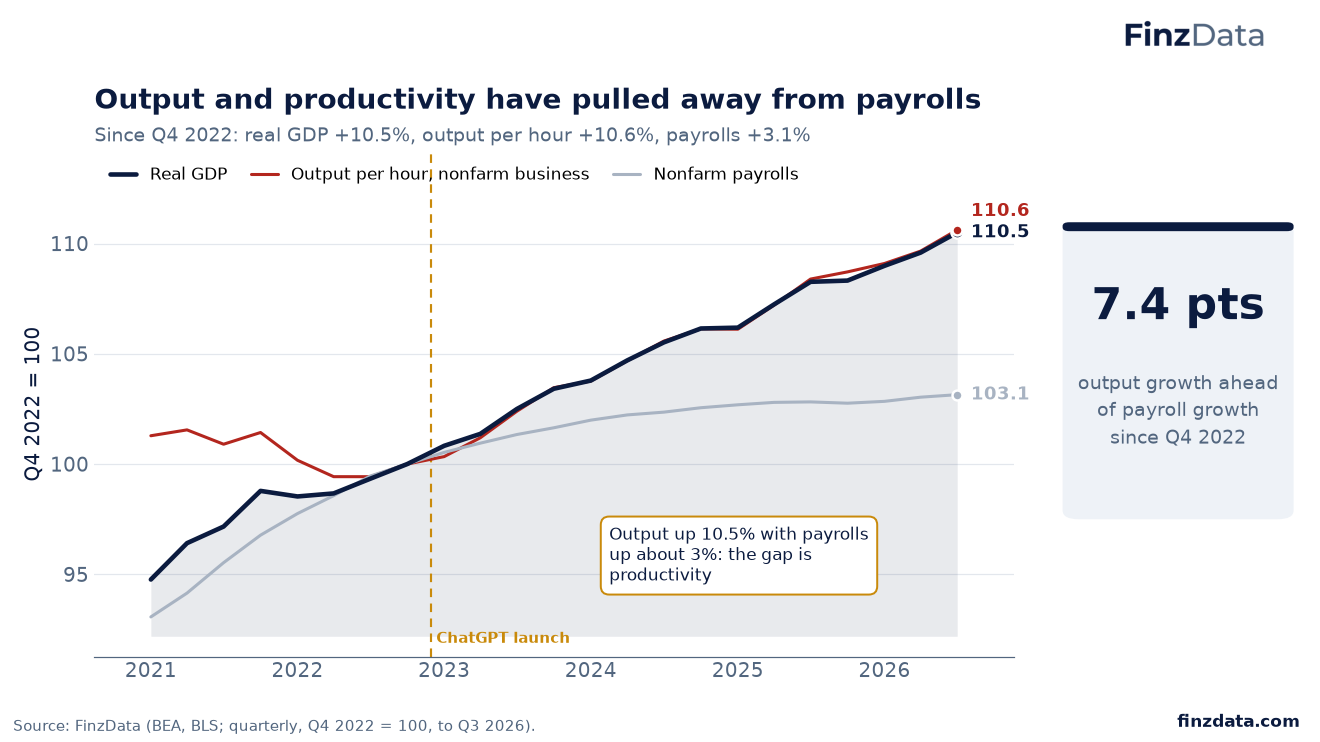
7.4 pts output growth ahead of payroll growth since Q4 2022
Since Q4 2022: real GDP +10.5%, output per hour +10.6%, payrolls +3.1%.
Output up 10.5% with payrolls up about 3%: the gap is productivity.
16. Productivity growth has more than doubled its 2010s pace
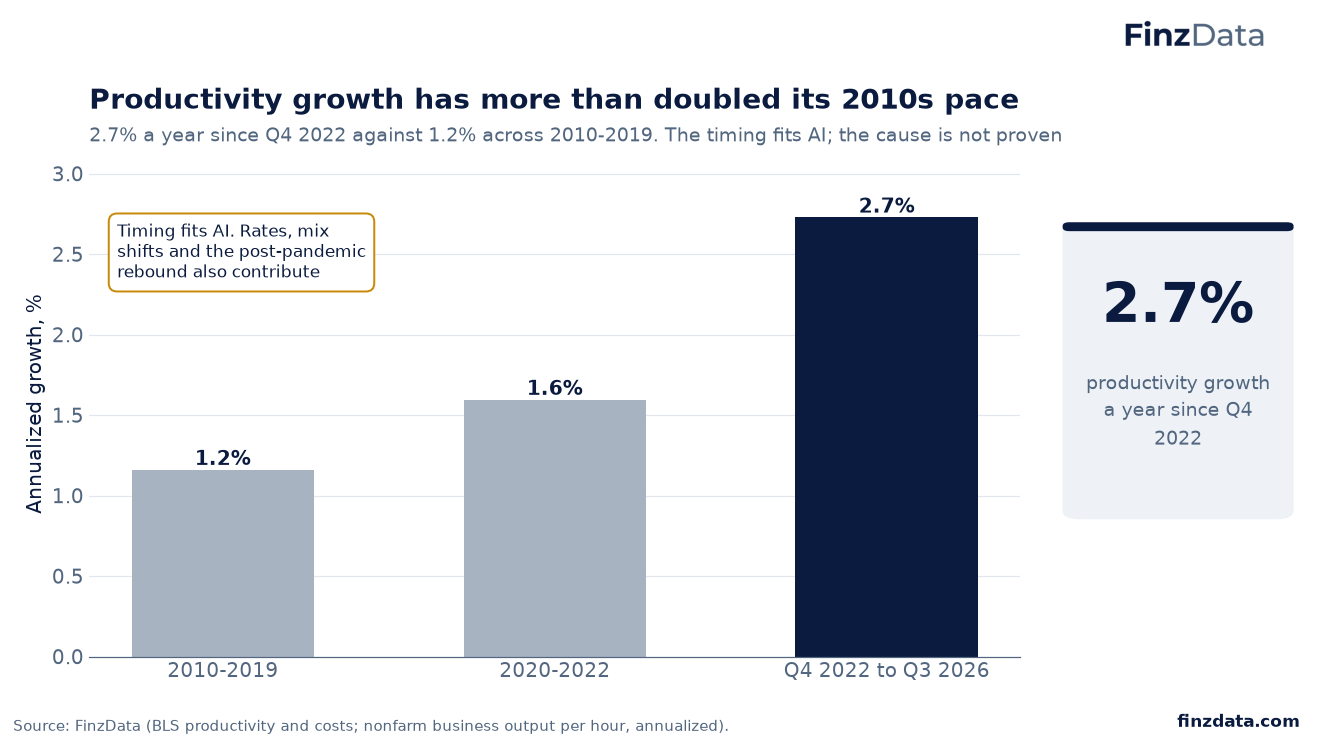
2.7% productivity growth a year since Q4 2022
2.7% a year since Q4 2022 against 1.2% across 2010-2019. The timing fits AI; the cause is not proven.
Timing fits AI. Rates, mix shifts and the post-pandemic rebound also contribute.
17. The gains so far have accrued to capital
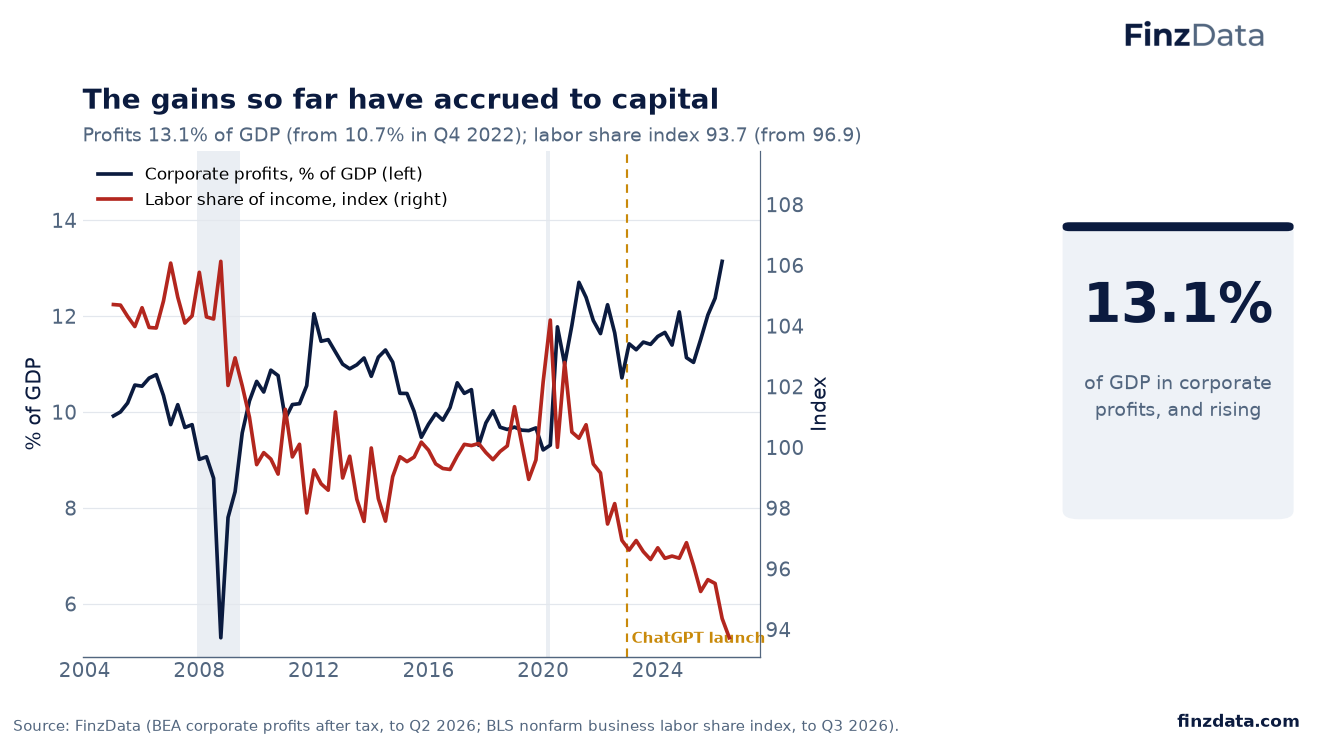
13.1% of GDP in corporate profits, and rising
Profits 13.1% of GDP (from 10.7% in Q4 2022); labor share index 93.7 (from 96.9).
18. Jobs are shifting from screens to sites
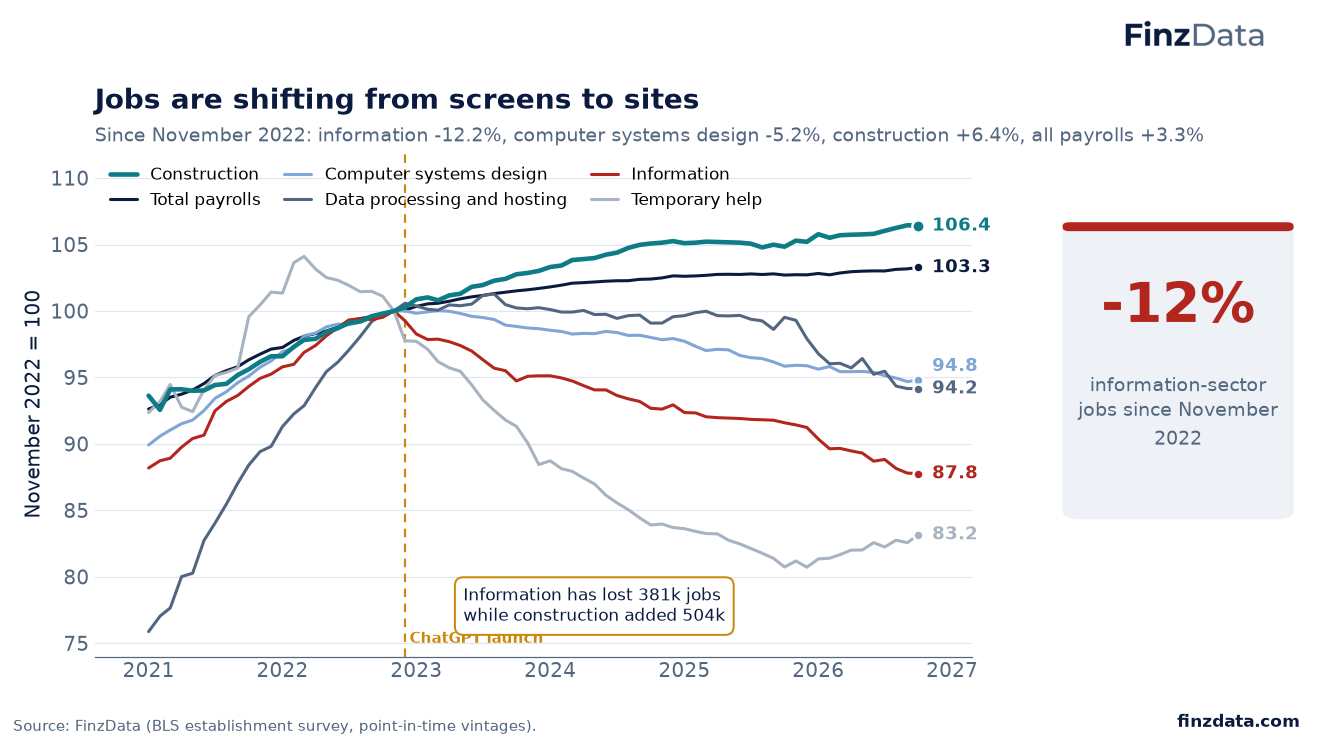
-12% information-sector jobs since November 2022
Since November 2022: information -12.2%, computer systems design -5.2%, construction +6.4%, all payrolls +3.3%.
Information has lost 381k jobs while construction added 504k.
19. Hiring is concentrated where AI saves the least time
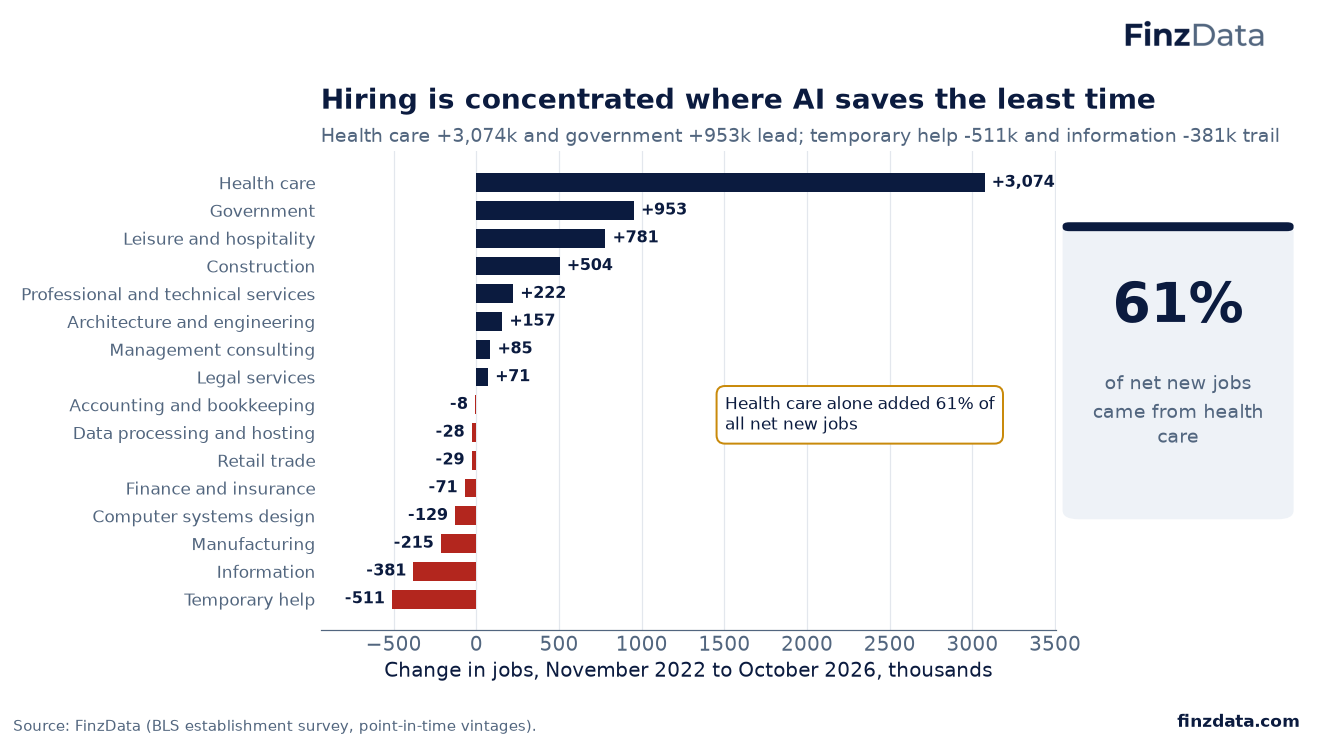
61% of net new jobs came from health care
Health care +3,074k and government +953k lead; temporary help -511k and information -381k trail.
Health care alone added 61% of all net new jobs.
20. Sectors that save more time with AI have added fewer jobs
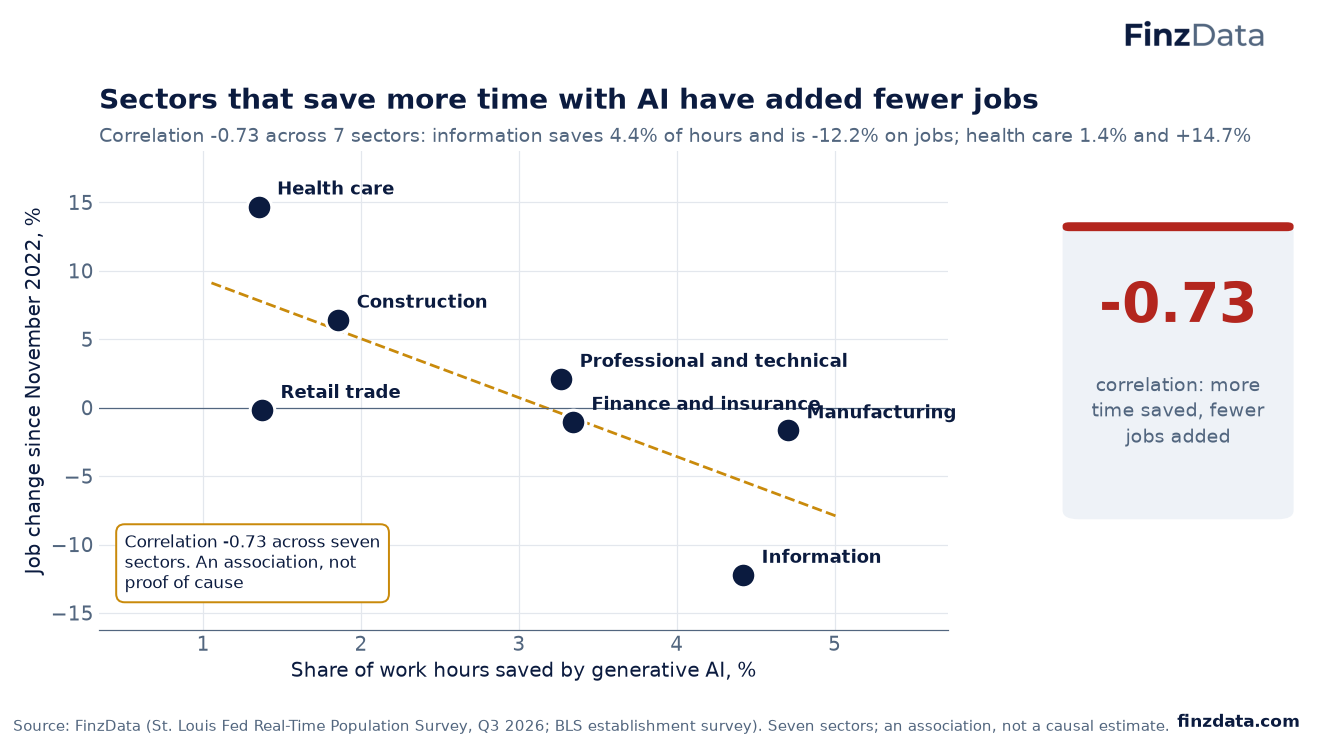
-0.73 correlation: more time saved, fewer jobs added
Correlation -0.73 across 7 sectors: information saves 4.4% of hours and is -12.2% on jobs; health care 1.4% and +14.7%.
Correlation -0.73 across seven sectors. An association, not proof of cause.
21. White-collar work is splitting, not collapsing
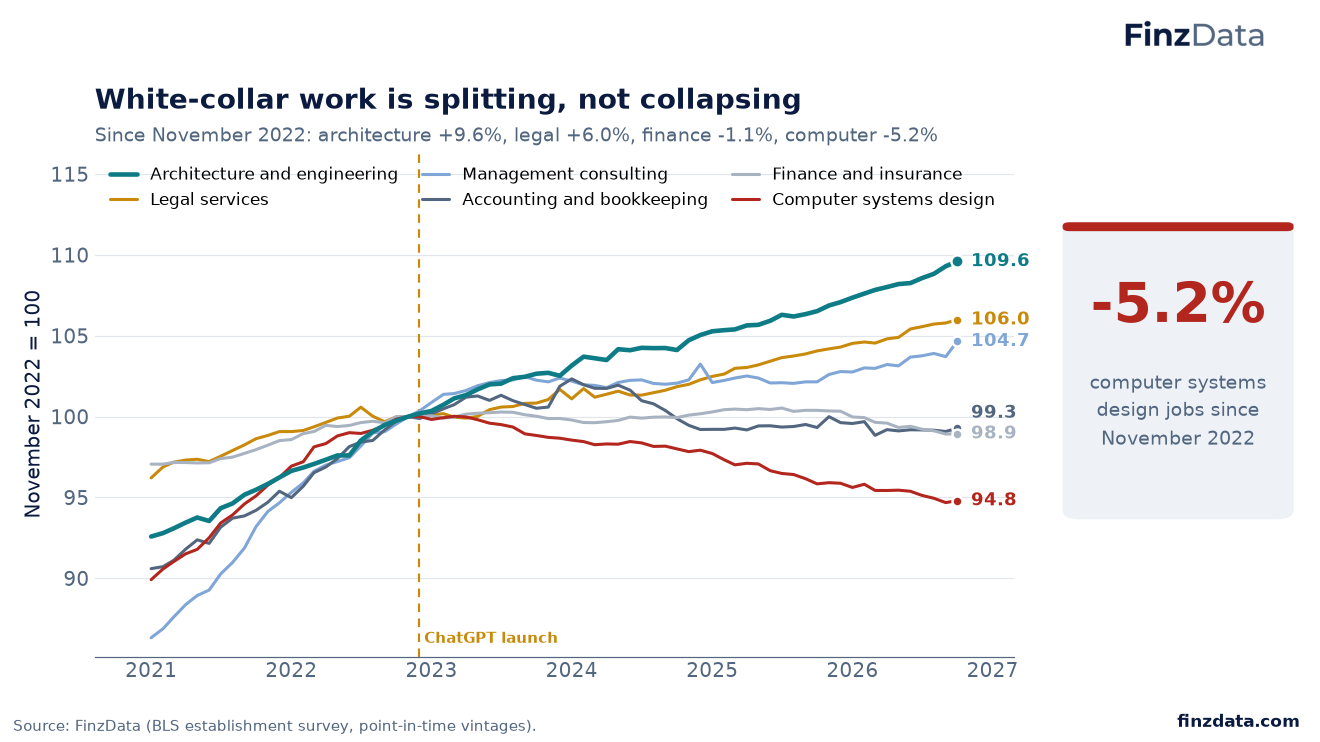
-5.2% computer systems design jobs since November 2022
Since November 2022: architecture +9.6%, legal +6.0%, finance -1.1%, computer -5.2%.
22. Hiring demand has cooled well below its 2022 peak
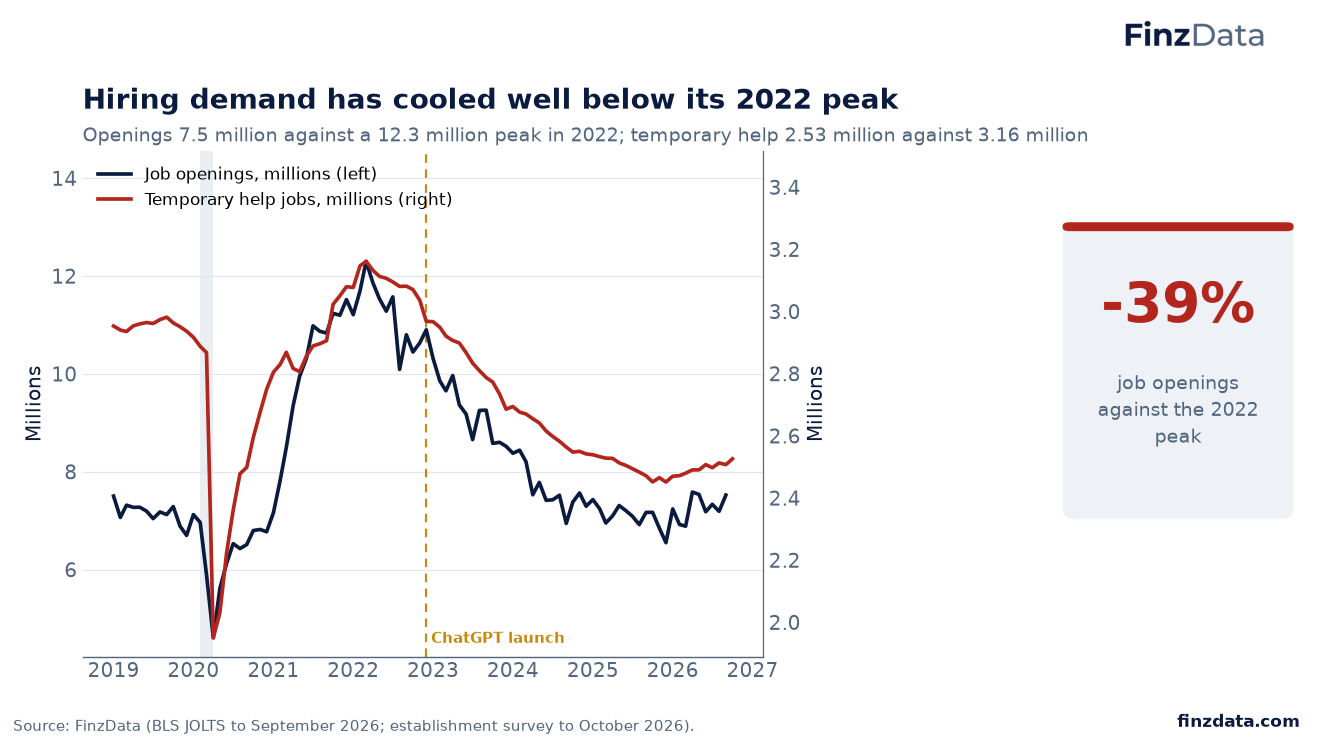
-39% job openings against the 2022 peak
Openings 7.5 million against a 12.3 million peak in 2022; temporary help 2.53 million against 3.16 million.
23. Young graduates now fare worse than the average worker
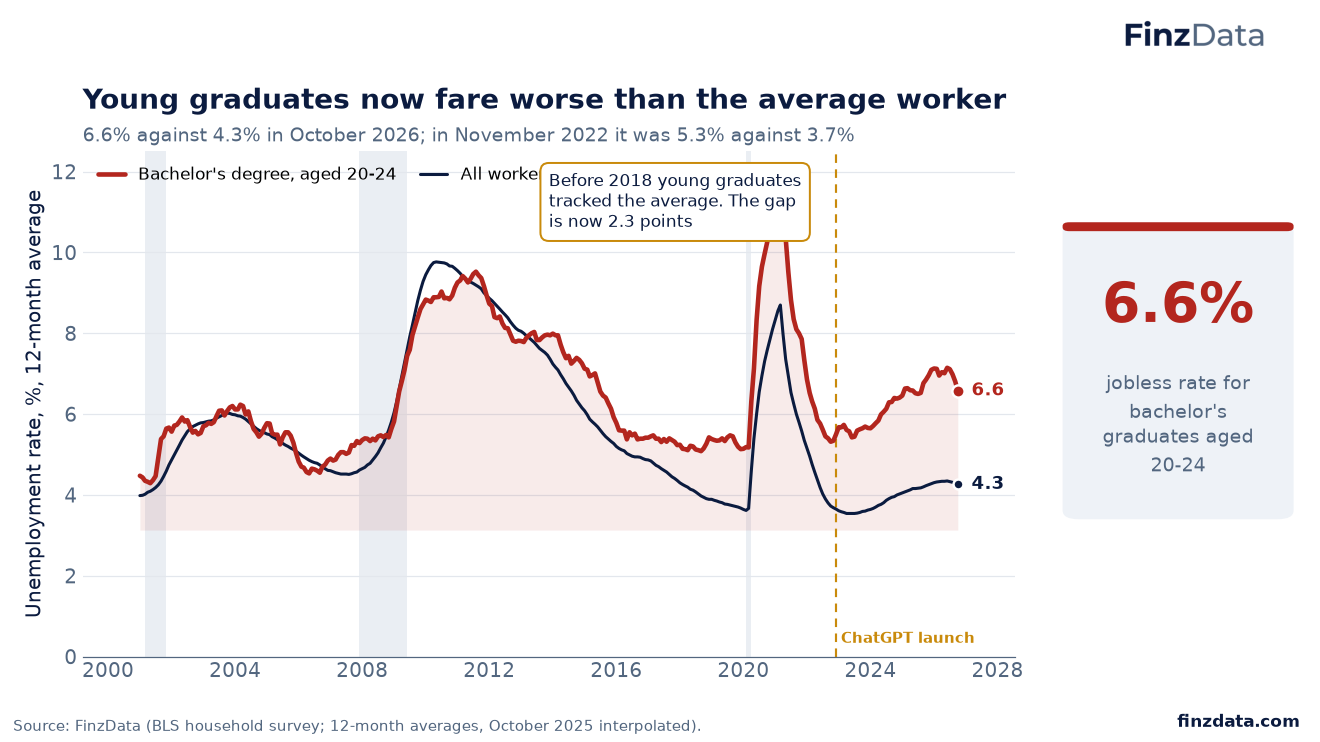
6.6% jobless rate for bachelor's graduates aged 20-24
6.6% against 4.3% in October 2026; in November 2022 it was 5.3% against 3.7%.
Before 2018 young graduates tracked the average. The gap is now 2.3 points.
24. The graduate penalty has persisted for years, not months
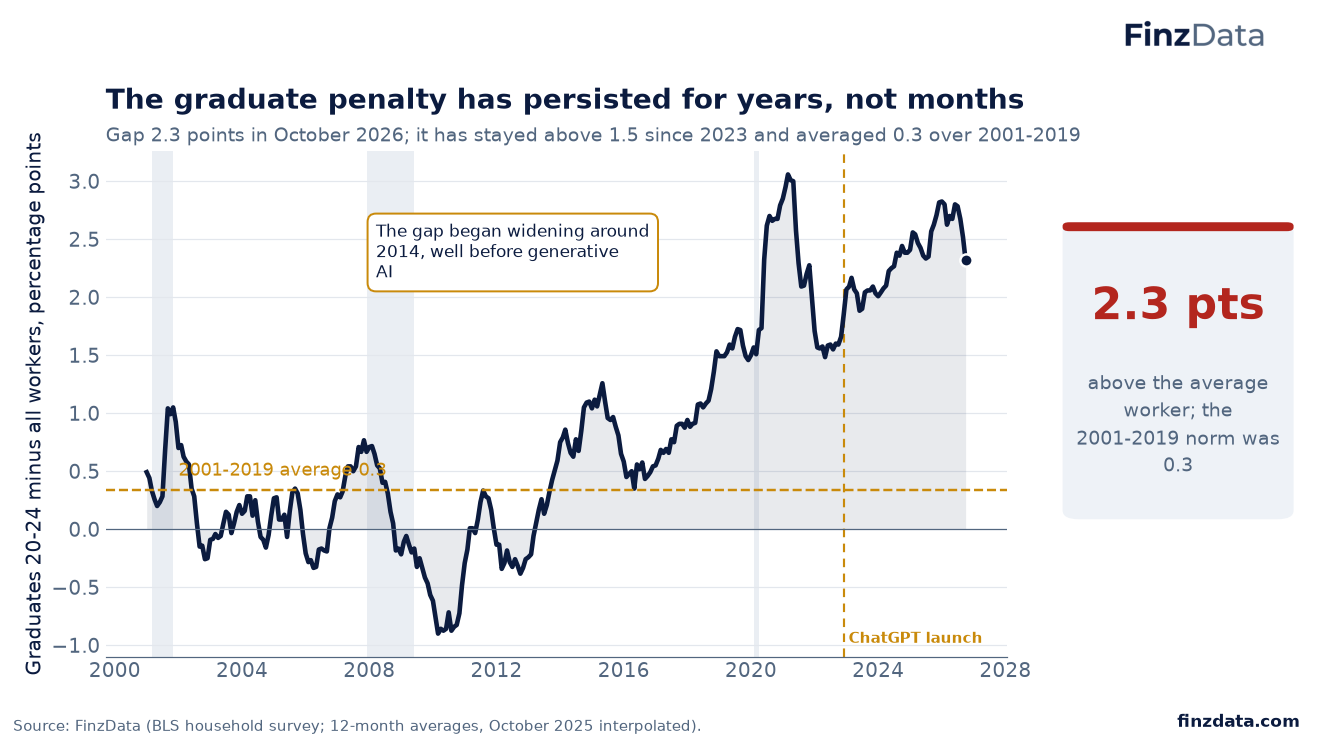
2.3 pts above the average worker; the 2001-2019 norm was 0.3
Gap 2.3 points in October 2026; it has stayed above 1.5 since 2023 and averaged 0.3 over 2001-2019.
The gap began widening around 2014, well before generative AI.
25. The first rung is harder to reach
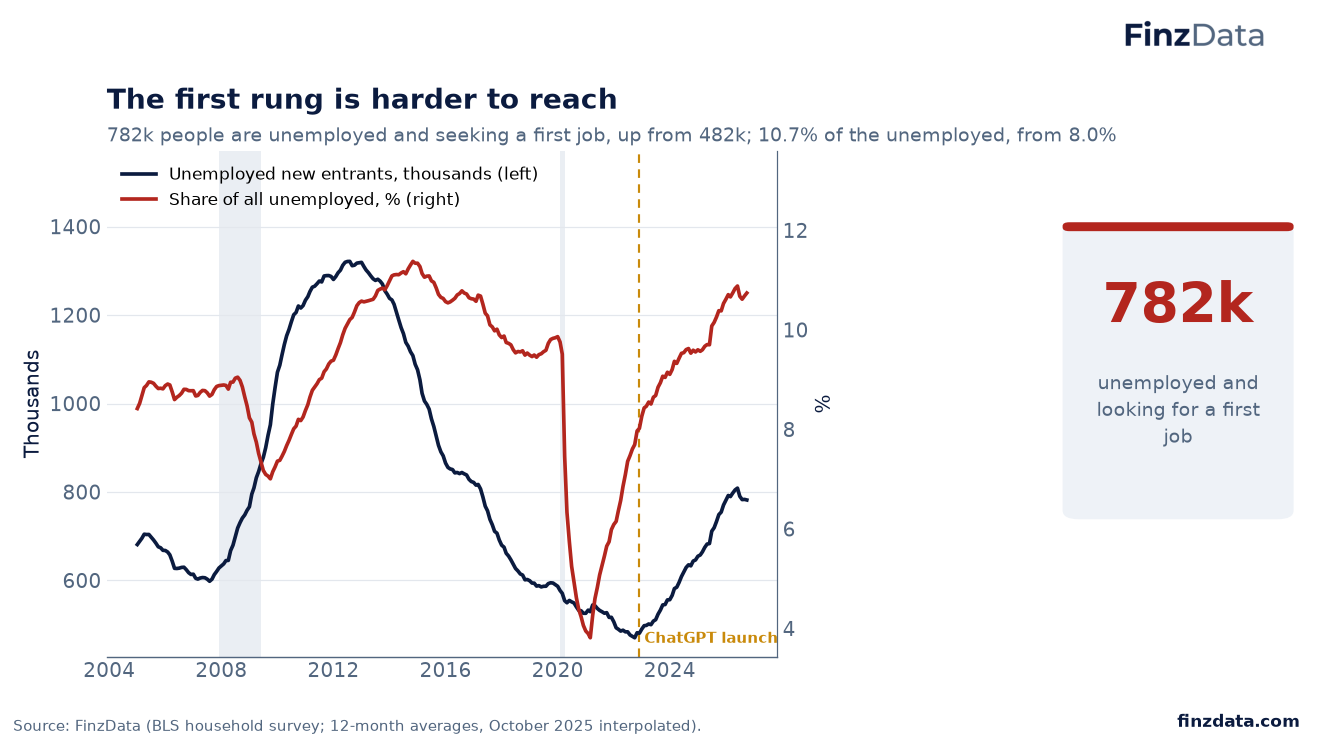
782k unemployed and looking for a first job
782k people are unemployed and seeking a first job, up from 482k; 10.7% of the unemployed, from 8.0%.
26. Unemployment has risen most, in relative terms, for degree holders
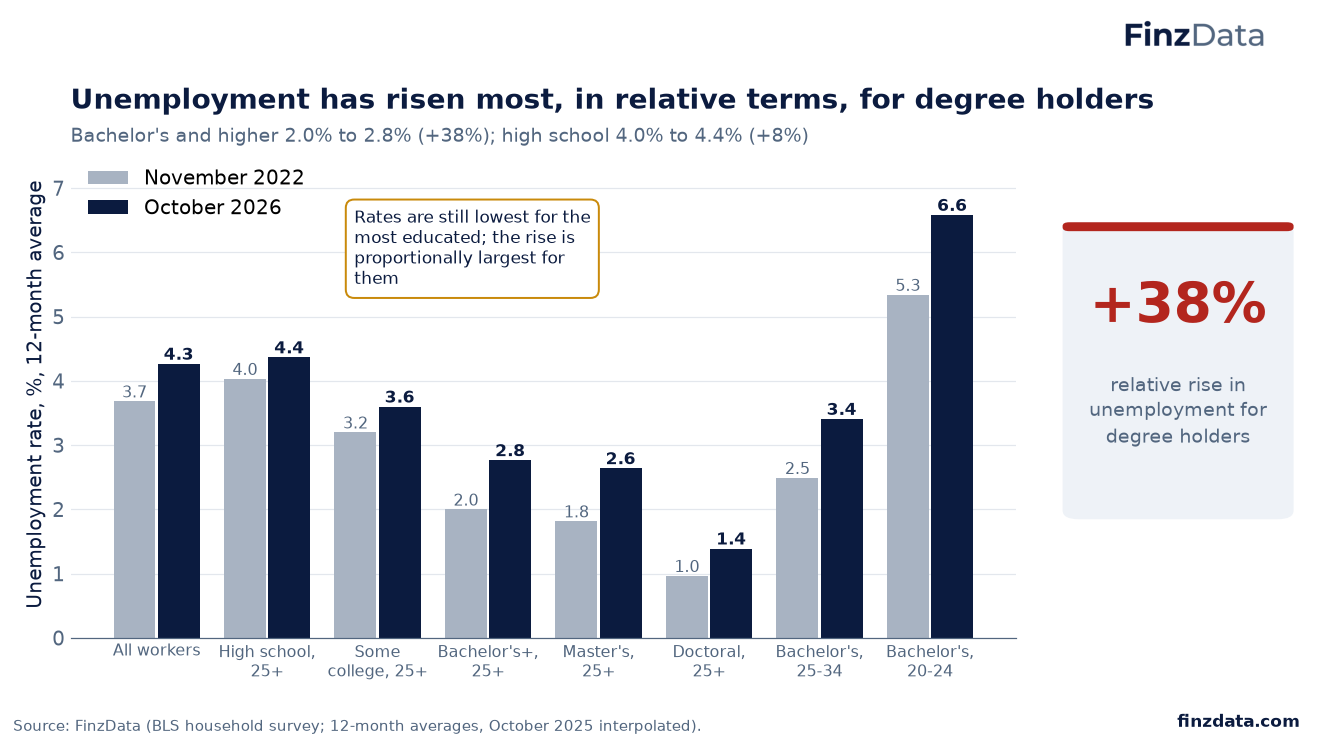
+38% relative rise in unemployment for degree holders
Bachelor's and higher 2.0% to 2.8% (+38%); high school 4.0% to 4.4% (+8%).
Rates are still lowest for the most educated; the rise is proportionally largest for them.
27. A degree still protects, but by less than it used to
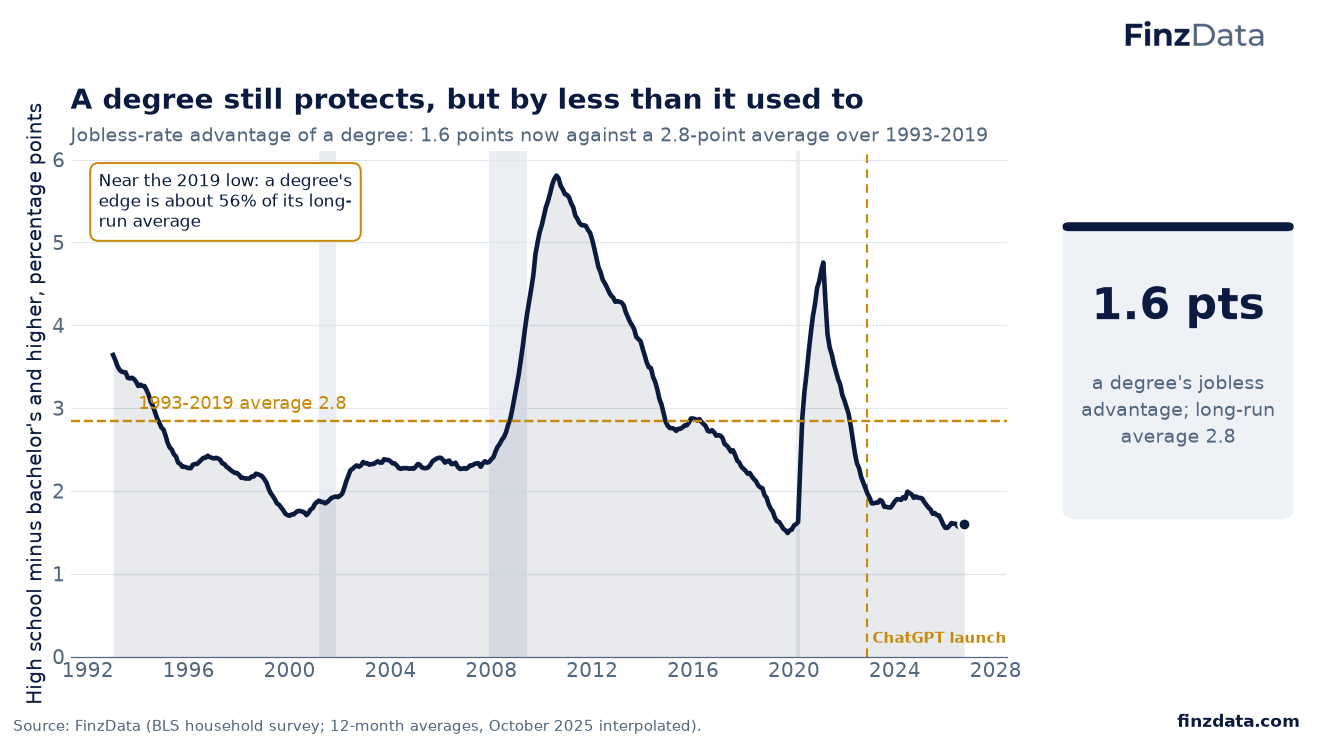
1.6 pts a degree's jobless advantage; long-run average 2.8
Jobless-rate advantage of a degree: 1.6 points now against a 2.8-point average over 1993-2019.
Near the 2019 low: a degree's edge is about 56% of its long- run average.
28. Job searches are taking longer
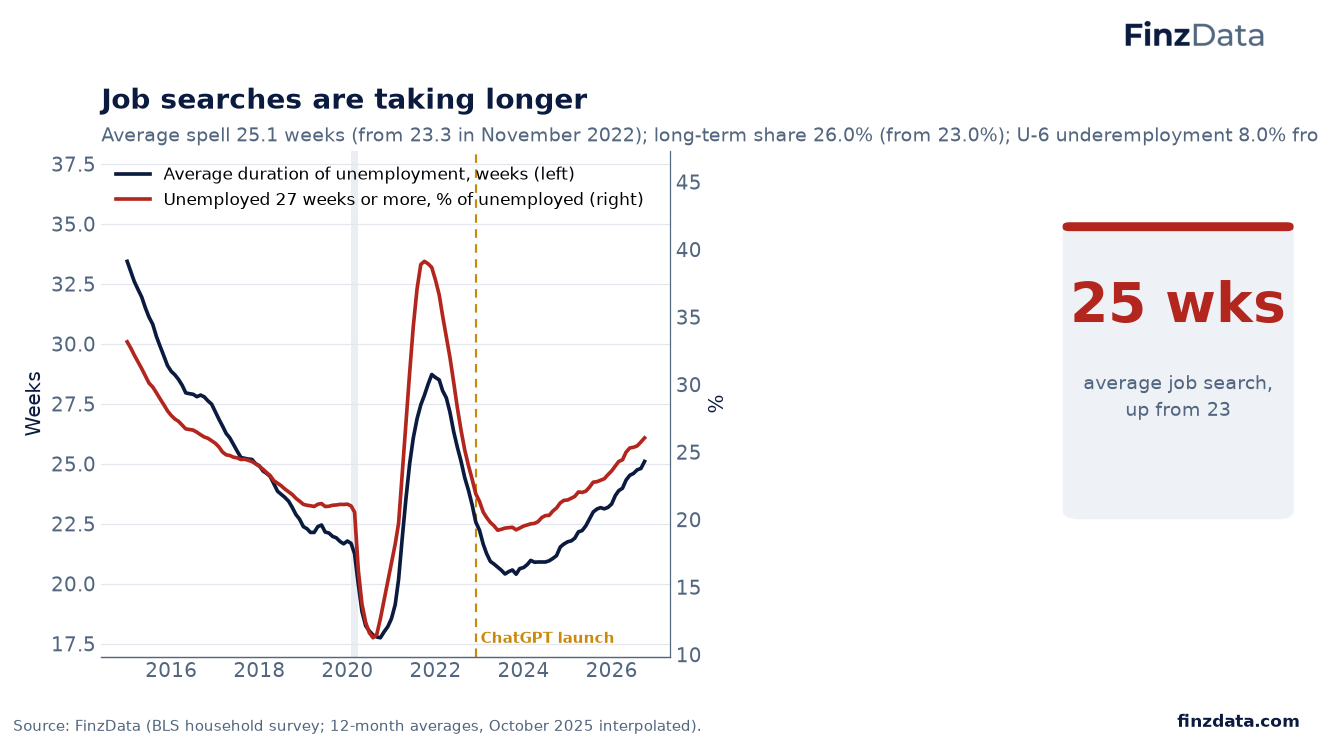
25 wks average job search, up from 23
Average spell 25.1 weeks (from 23.3 in November 2022); long-term share 26.0% (from 23.0%); U-6 underemployment 8.0% from 6.9%.
29. The Street still expects the build-out to grow
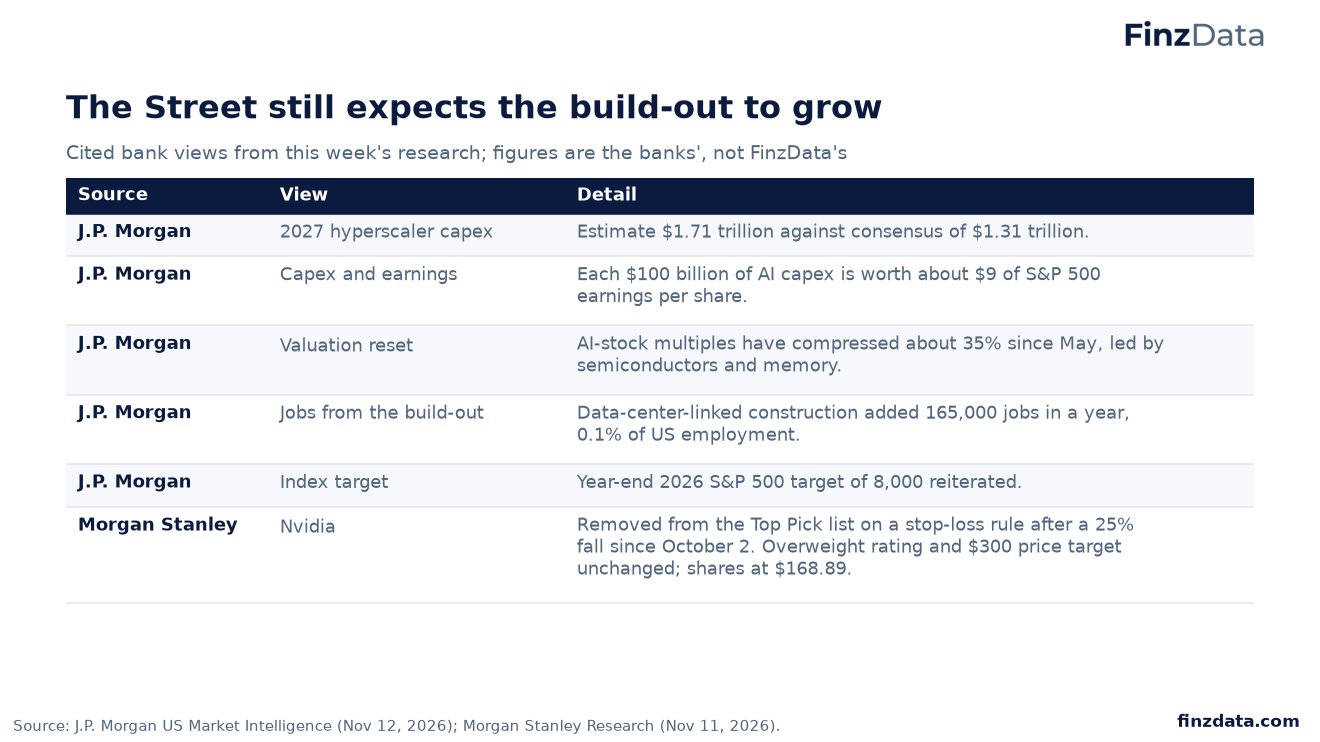
The Street still expects the build-out to grow
Bank views cited from J.P. Morgan US Market Intelligence (November 12, 2026) and Morgan Stanley Research (November 11, 2026). The figures are the banks' own.
30. Three paths from here
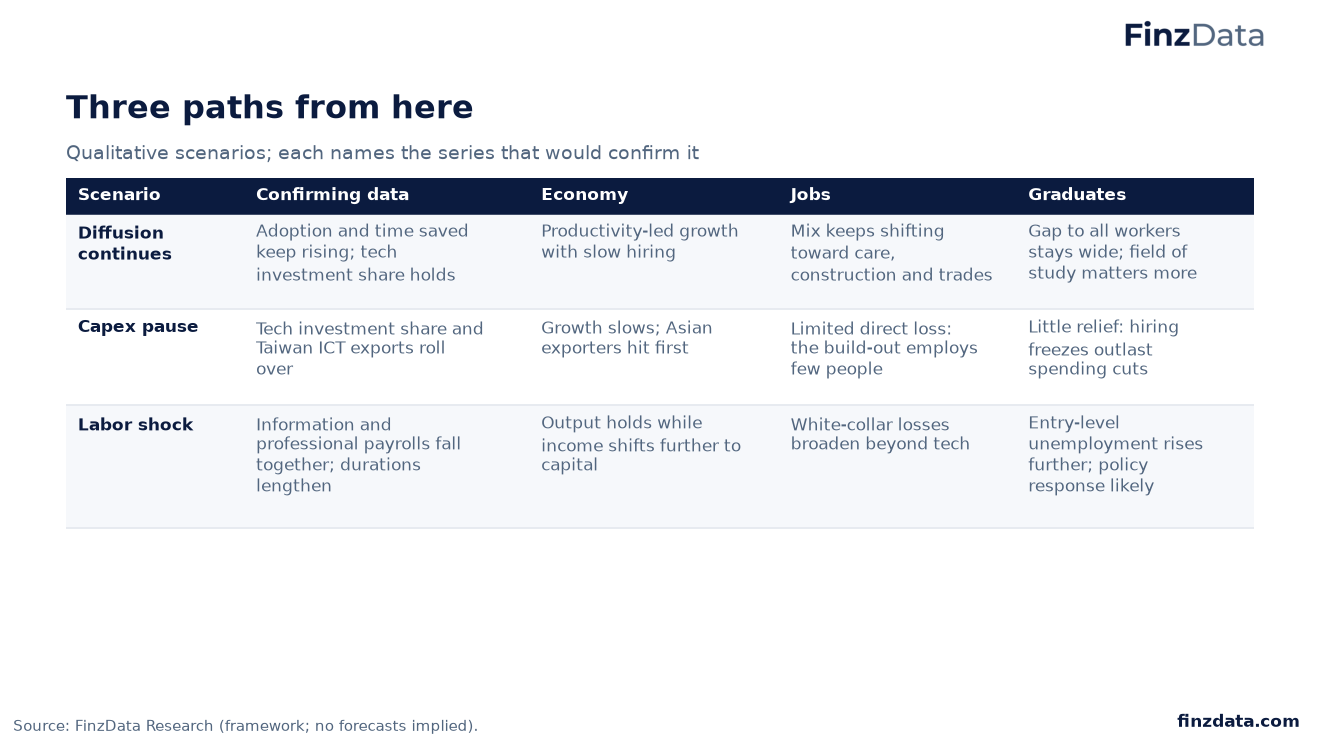
Three paths from here
Three qualitative paths, each tied to the FinzData series that would confirm it. No forecasts are implied.
31. What could make this read wrong
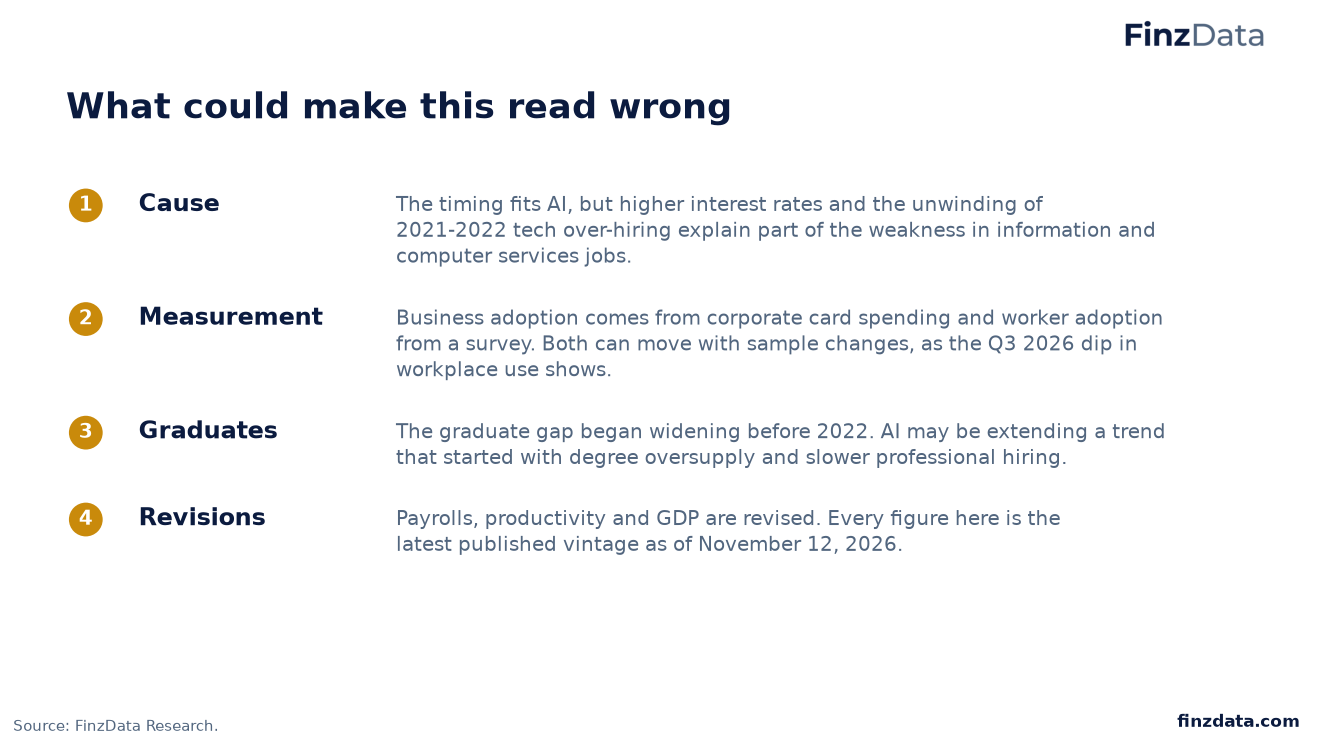
What could make this read wrong
Cause: The timing fits AI, but higher interest rates and the unwinding of 2021-2022 tech over-hiring explain part of the weakness in information and computer services jobs. Measurement: Business adoption comes from corporate card spending and worker adoption from a survey. Both can move with sample changes, as the Q3 2026 dip in workplace use shows. Graduates: The graduate gap began widening before 2022. AI may be extending a trend that started with degree oversupply and slower professional hiring. Revisions: Payrolls, productivity and GDP are revised. Every figure here is the latest published vintage as of November 12, 2026.
32. Our read
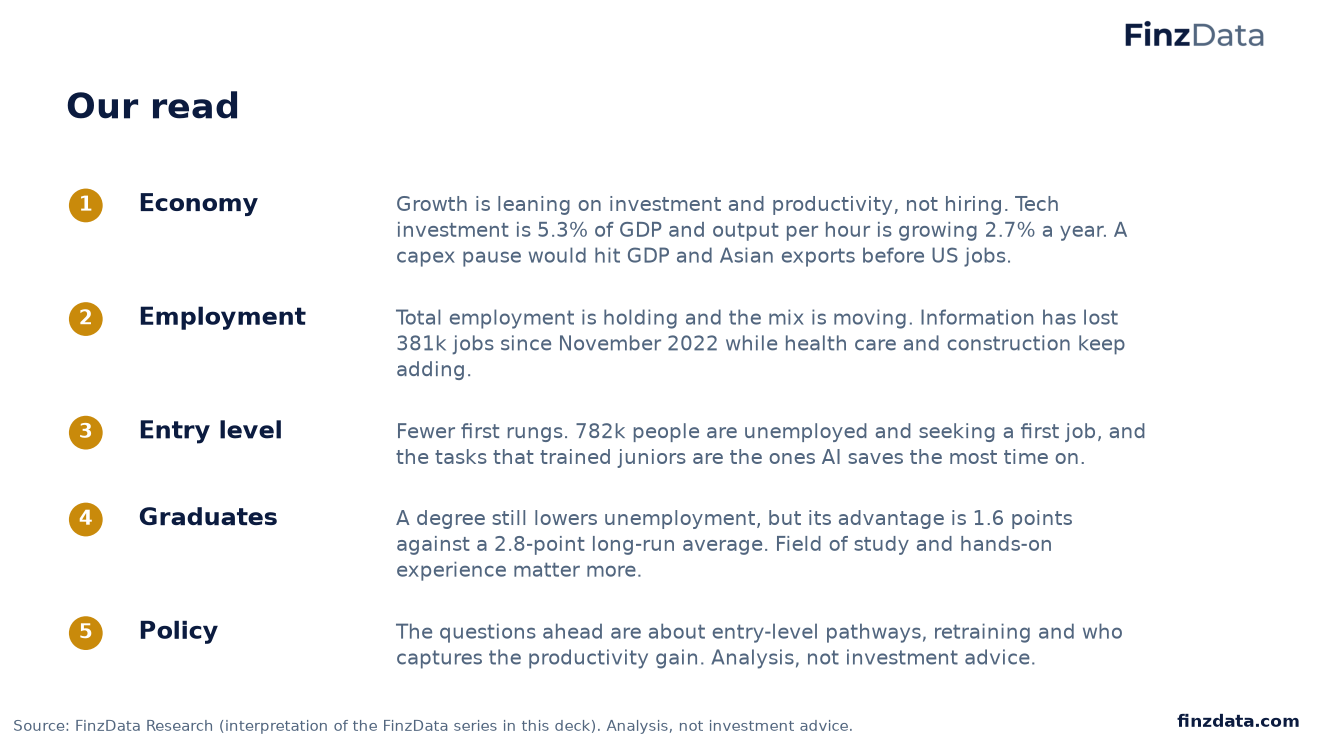
Our read
Economy: Growth is leaning on investment and productivity, not hiring. Tech investment is 5.3% of GDP and output per hour is growing 2.7% a year. A capex pause would hit GDP and Asian exports before US jobs. Employment: Total employment is holding and the mix is moving. Information has lost 381k jobs since November 2022 while health care and construction keep adding. Entry level: Fewer first rungs. 782k people are unemployed and seeking a first job, and the tasks that trained juniors are the ones AI saves the most time on. Graduates: A degree still lowers unemployment, but its advantage is 1.6 points against a 2.8-point long-run average. Field of study and hands-on experience matter more. Policy: The questions ahead are about entry-level pathways, retraining and who captures the productivity gain. Analysis, not investment advice.
33. What to watch
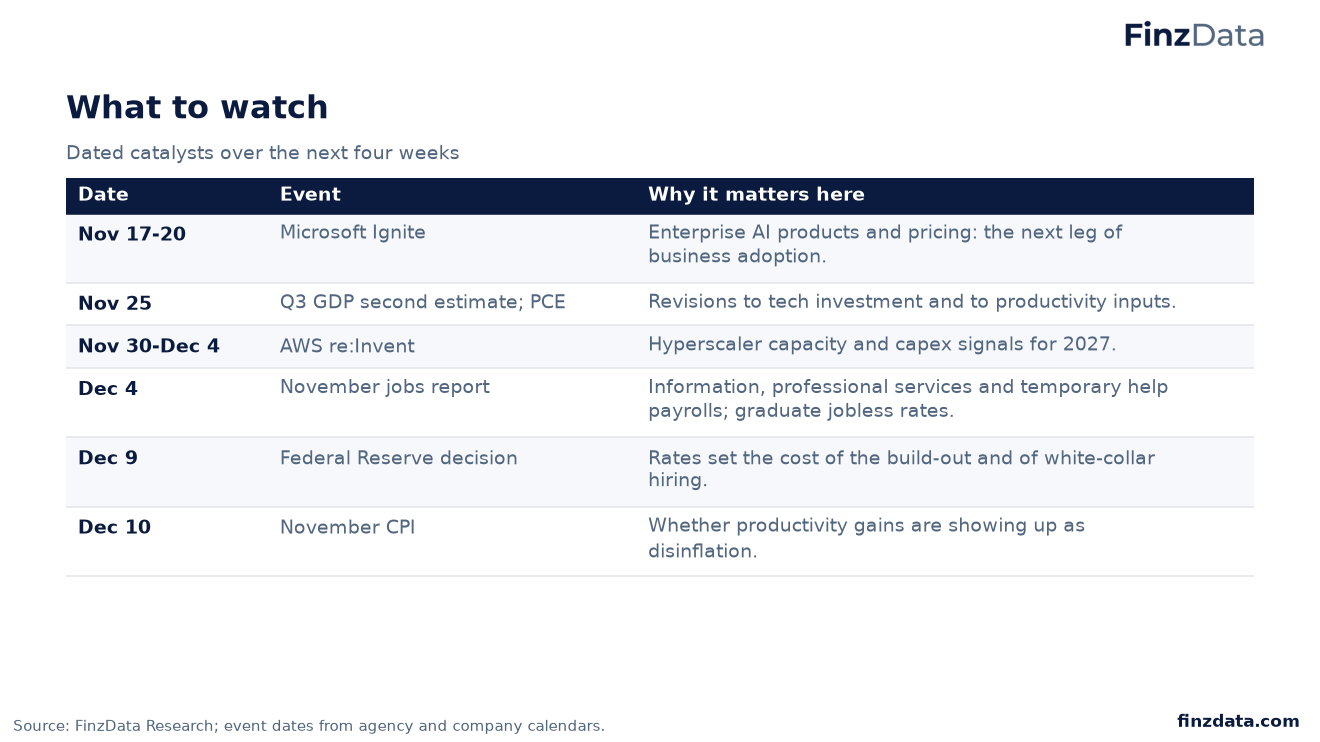
What to watch
Dated catalysts over the next four weeks and why each matters for the AI economy.
34. Method
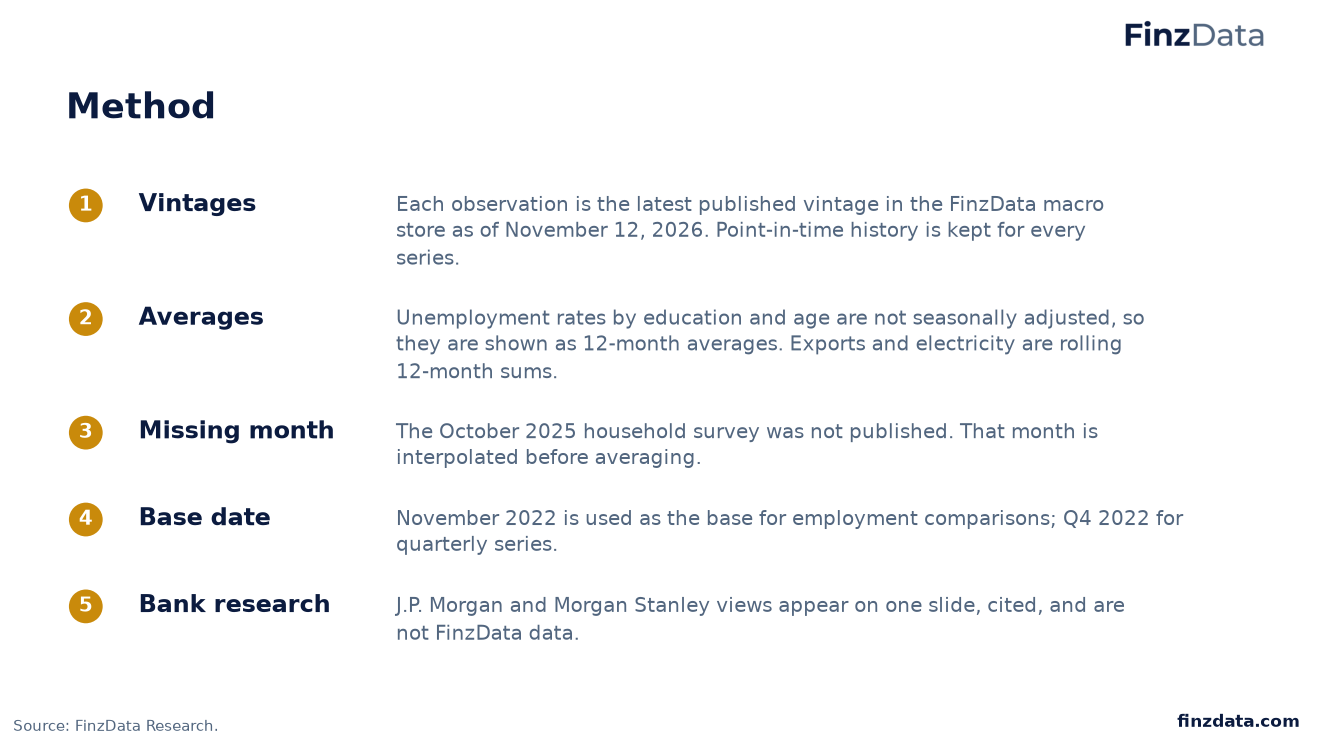
Method
Vintages: Each observation is the latest published vintage in the FinzData macro store as of November 12, 2026. Point-in-time history is kept for every series. Averages: Unemployment rates by education and age are not seasonally adjusted, so they are shown as 12-month averages. Exports and electricity are rolling 12-month sums. Missing month: The October 2025 household survey was not published. That month is interpolated before averaging. Base date: November 2022 is used as the base for employment comparisons; Q4 2022 for quarterly series. Bank research: J.P. Morgan and Morgan Stanley views appear on one slide, cited, and are not FinzData data.
35. The data behind this deck
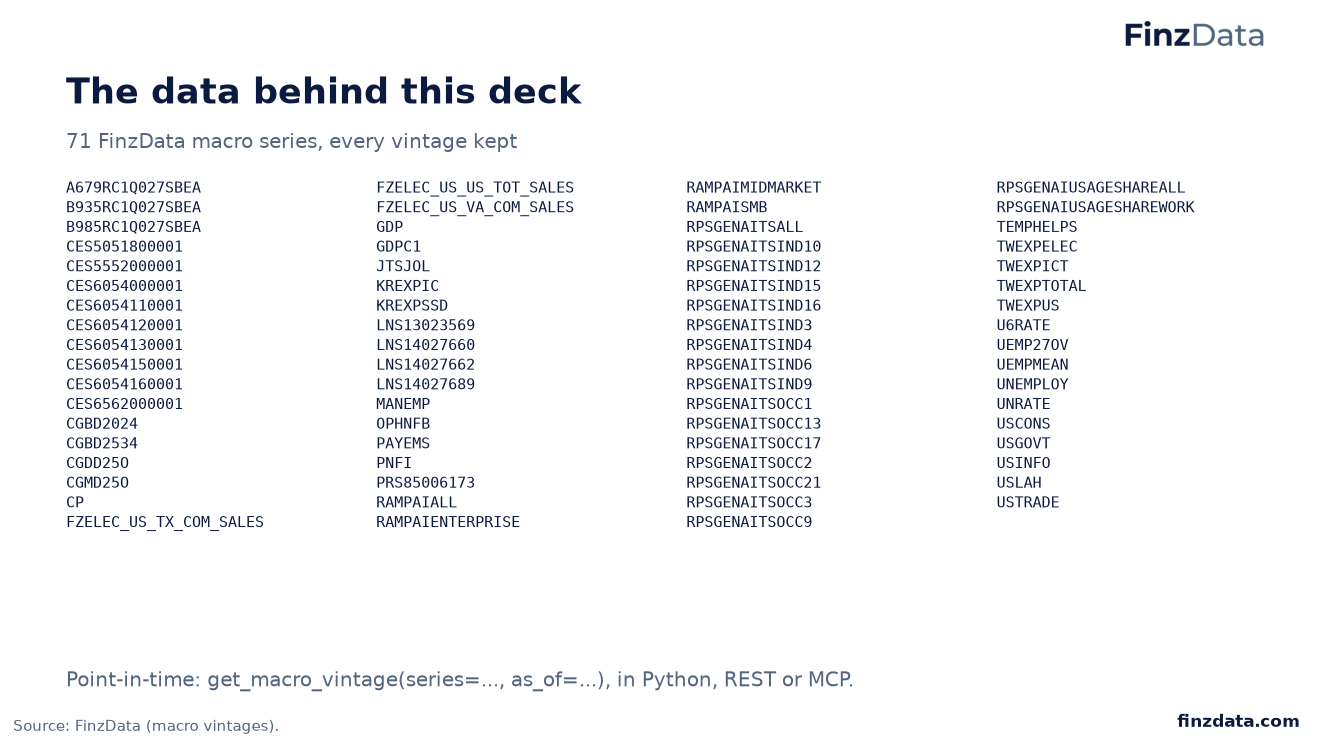
The data behind this deck
Every series in the deck is available point in time from FinzData.
Frequently asked questions
How much are data centers adding to electricity demand?
Commercial electricity sales in Virginia, home to the largest US data center cluster, are up 65% since 2019, against 8% for all US electricity sales. Investment in information processing equipment and software is 5.35% of GDP, above the dot-com peak of 4.46%.
Is AI taking jobs?
Total US payrolls have grown by 5.1 million since November 2022, so AI has not reduced overall employment. The mix has changed: the information sector has lost 381 thousand jobs (12.2%) and computer systems design 129 thousand, while health care and construction keep adding. Across seven sectors, those that save more work hours with AI have added fewer jobs (correlation -0.73), which is an association and not proof of cause.
Are entry-level jobs disappearing?
782 thousand people are unemployed and looking for a first job, up from 482 thousand in November 2022. They are 10.7% of all unemployed people, up from 8.0%. The tasks that used to train junior staff are among those where workers report the most time saved by AI.
How many US businesses use AI?
56.8% of US businesses paid for AI tools in October 2026, up from 43.5% a year earlier and 7.5% in January 2023. 40.5% of employed adults used generative AI at work in the third quarter of 2026.
Is AI raising productivity?
US output per hour has grown 2.7% a year since the fourth quarter of 2022, against 1.2% a year across 2010-2019. Workers report that generative AI saves 2.1% of all work hours. The timing fits AI, but the data cannot yet prove the cause.
Is AI raising unemployment?
The overall unemployment rate averages 4.3% over the past 12 months. The rise is concentrated among degree holders: unemployment for workers with a bachelor's degree or higher went from 2.0% to 2.8% between November 2022 and October 2026, a larger relative rise than for high school graduates (4.0% to 4.4%).
Is AI causing layoffs?
The data shows weaker hiring more clearly than mass layoffs. Job openings are 7.5 million against a 12.3 million peak in 2022, temporary help employment is 2.53 million against 3.16 million, and the average job search now lasts 25.1 weeks, up from 23.3 in November 2022.
Why is unemployment rising for college graduates?
Bachelor's graduates aged 20-24 have a 12-month average jobless rate of 6.6%, against 4.3% for all workers. That 2.3-point gap averaged 0.3 points over 2001-2019. The gap began widening around 2014, before generative AI, so AI is more likely extending a trend than starting one.
Download the deck (PDF, 35 slides) More research
Related research: The AI Unwind · All FinzData research · Datasets. Every series in this deck is available point in time: get_macro_vintage(series=..., as_of=...).
Built for AI, quants, data scientists and financial analysts who backtest. Clean data. Real insights. Real alpha. finzdata.com. This material is for information only and is not investment advice. Data sources: FinzData macro vintages (Ramp AI Index; St. Louis Fed Real-Time Population Survey; BEA; BLS; EIA; Taiwan Ministry of Finance; Korea customs); J.P. Morgan US Market Intelligence (Nov 12, 2026); Morgan Stanley Research (Nov 11, 2026).
Get FinzData research free, every morning
The daily brief: what moved, the macro releases that matter, positioning and liquidity, with charts. One email a day, free, unsubscribe anytime.
Topics and related searches
Labor market and jobs AI infrastructure and data-center capex Semiconductors and AI supply chain Exports and global trade Recession risk and the business cycle
People also search
- is ai taking jobs
- is ai causing layoffs in 2026
- why is unemployment high for college graduates
- are entry level jobs disappearing because of ai
- how many businesses use ai in 2026
- what percent of workers use generative ai at work
- is ai increasing productivity
- how much time does ai save workers
- which jobs are most affected by ai
- how much electricity do data centers use in virginia
- is ai investment bigger than the dot com boom
- unemployment rate for recent college graduates 2026