FinzData Research · Published 6 November 2026
The AI Unwind: Why the Stock Market Crashed on November 5, 2026 (Institutional Deck)
Institutional deck. Quick answer: AI and chip stocks were sold after Democrats won Congress on a platform that included limits on data centers, chip earnings disappointed and a December Fed hike stayed likely. Crowded hedge-fund positions, short-gamma dealers and volatility-control funds turned it into a 4.36% S&P 500 drop and a 6.36% Nasdaq-100 drop.
Get FinzData research free, every morning
The daily brief: what moved, the macro releases that matter, positioning and liquidity, with charts. One email a day, free, unsubscribe anytime.
Contents
- Executive summary
- Agenda
- One session erased the post-election rally
- Cross-asset moves
- The S&P 500 sits on its 200-day average
- Every sector fell; chips and tech fell hardest
- A month-old rotation out of AI
- Four catalysts on one tape
- What the street expected, and when
- The ballot hit 2028 AI capacity
- Record inflows the week before
- The semis-energy barbell got leg-swept
- Hedges stripped off before the drop
- Stock pickers were already de-grossing
- The more hedge funds owned a stock, the harder it fell
- Dealers short gamma since mid-October
- Vol-control funds as forced sellers
- Short gamma in AI chips, long gamma in hyperscalers
- Everyone reached for protection at once
- FinzData Quantitative Model: stress
- Taiwan steps in
- Drops this size are rare and cluster
- History after -4% days
- The closest analogs
- Does waiting three sessions help?
- The bear case
- Volatility spikes have tended to fade
- Semis below their 200-day average
- Who leads the rebound
- The midterm cycle
- Losing Congress has not hurt stocks
- Midterm-year drawdowns
- The four-year cycle
- Walk-forward method
- Walk-forward result
- Midterms and sectors out of sample
- Three paths and their signposts
- Our read
- What to watch
- The data behind this deck
- Frequently asked questions
1. The AI Unwind
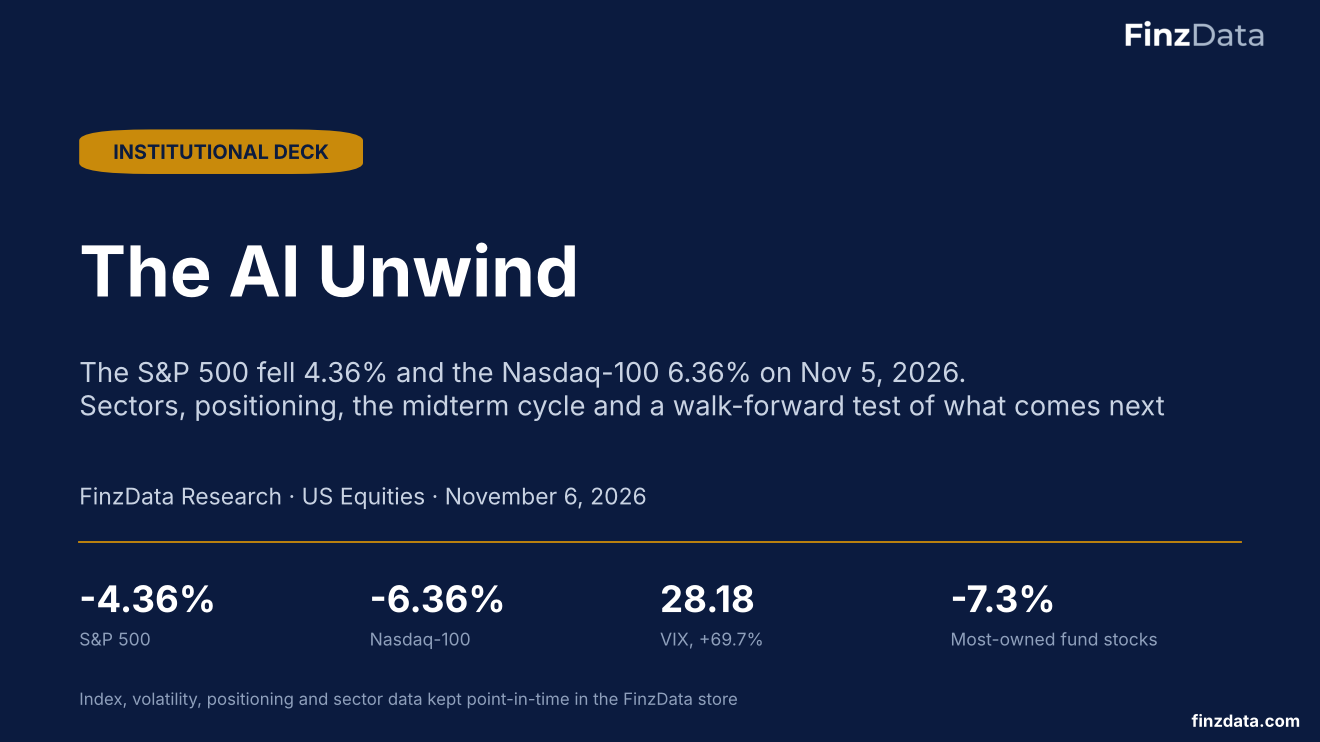
On November 5, 2026 the S&P 500 fell 4.36% and the Nasdaq-100 6.36%, two days after Democrats won both chambers of Congress. This deck measures the drop with FinzData data: sectors, positioning, dealer gamma, hedge-fund crowding, the midterm cycle and a walk-forward test of buying the dip.
2. Executive summary
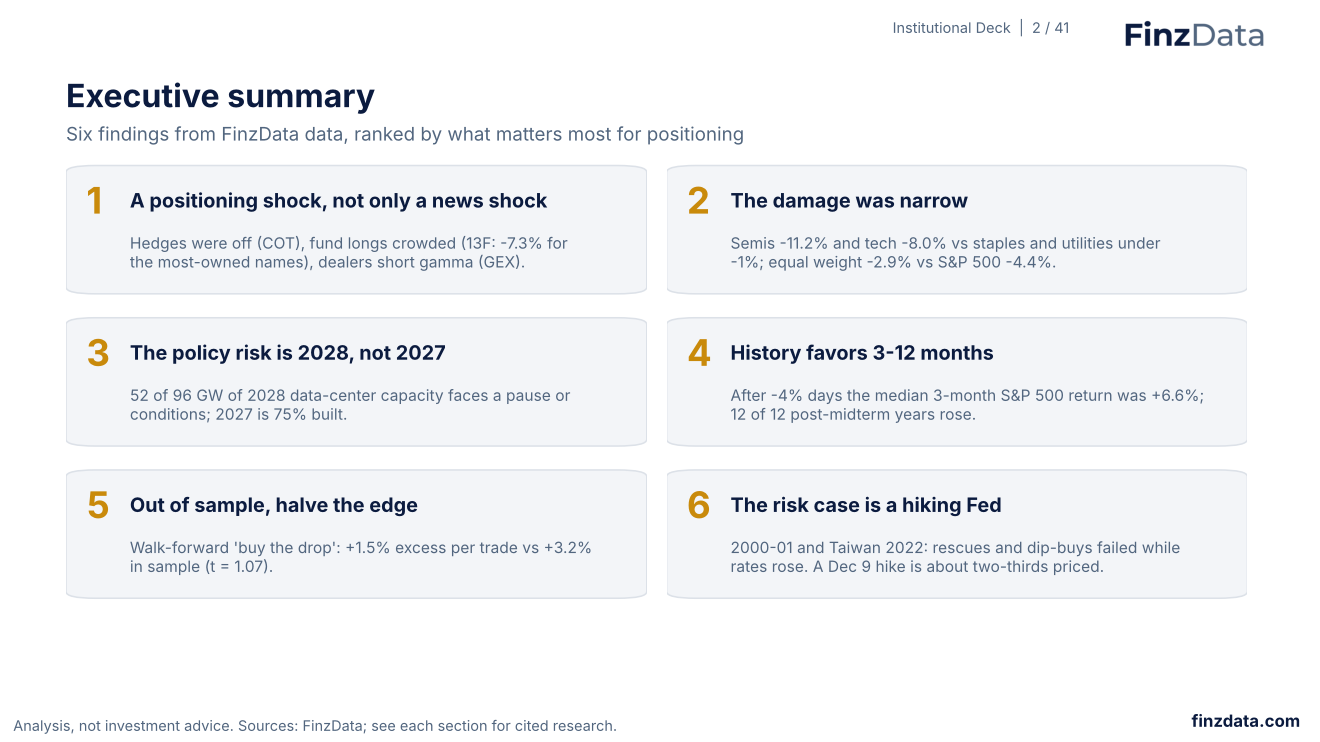
Six findings: a positioning shock as much as a news shock; damage concentrated in semis and tech; policy risk aimed at 2028 data-center capacity, not 2027; history favoring the next three to twelve months; an out-of-sample edge about half the backtest's; and a hiking Fed as the main risk.
3. Agenda
Six sections: the session, positioning, history, the midterm cycle, walk-forward tests and the outlook.
4. One session erased the post-election rally
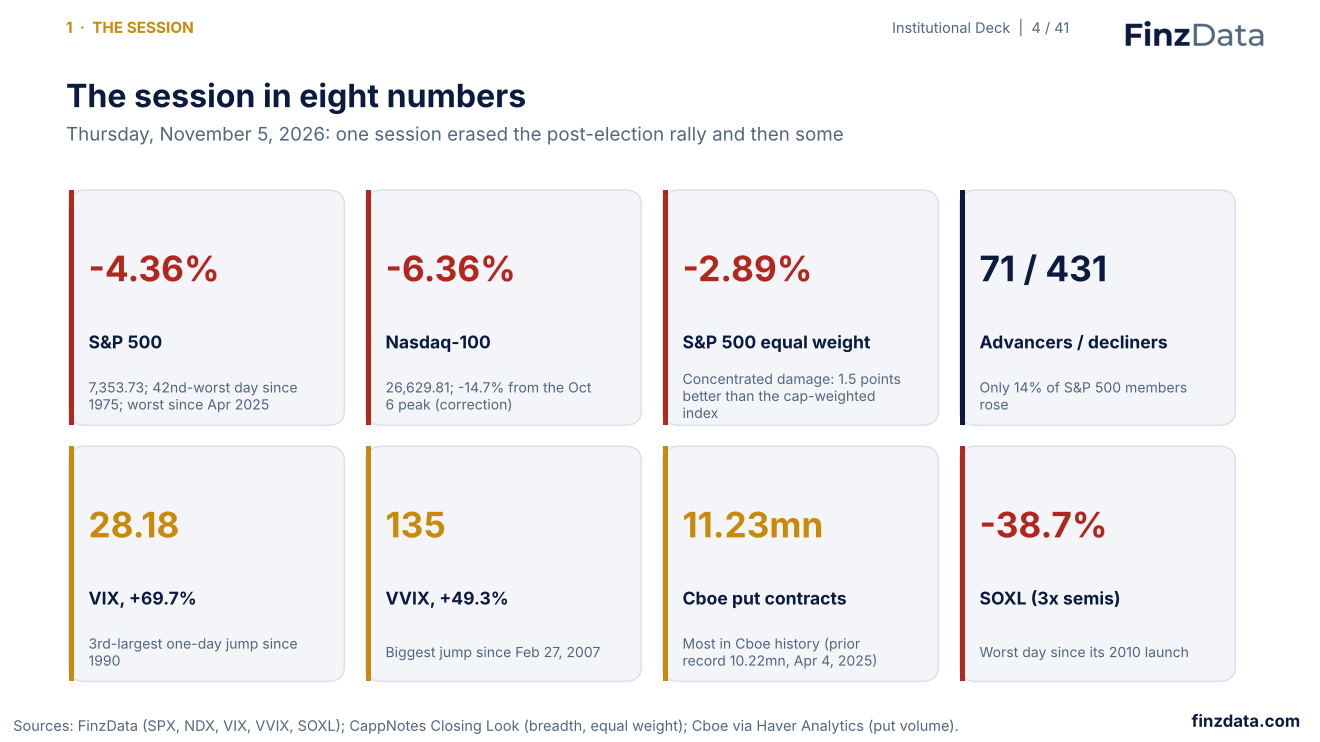
The S&P 500 closed at 7,353.73, the 42nd-worst day of 13,070 since 1975 and the worst since April 2025. The Nasdaq-100 is 14.7% below its October 6 peak. The VIX rose +69.7% to 28.18, the third-largest one-day jump since 1990. Only 71 S&P 500 stocks rose.
5. Cross-asset moves
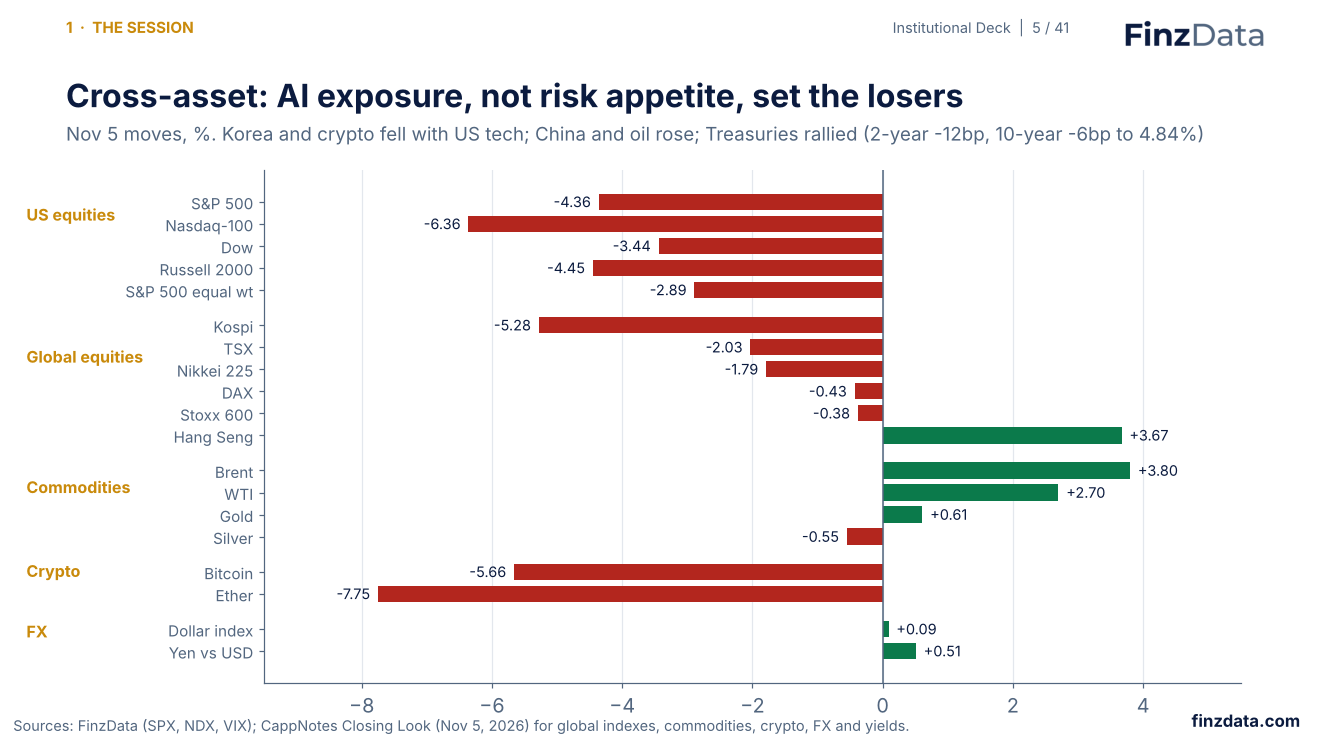
AI exposure, not risk appetite, set the losers: Korea's Kospi fell 5.3% and bitcoin 5.7% alongside US tech, while the Hang Seng rose 3.7%, Brent 3.8% and Treasuries rallied (2-year -12bp, 10-year 4.84%).
6. The S&P 500 sits on its 200-day average
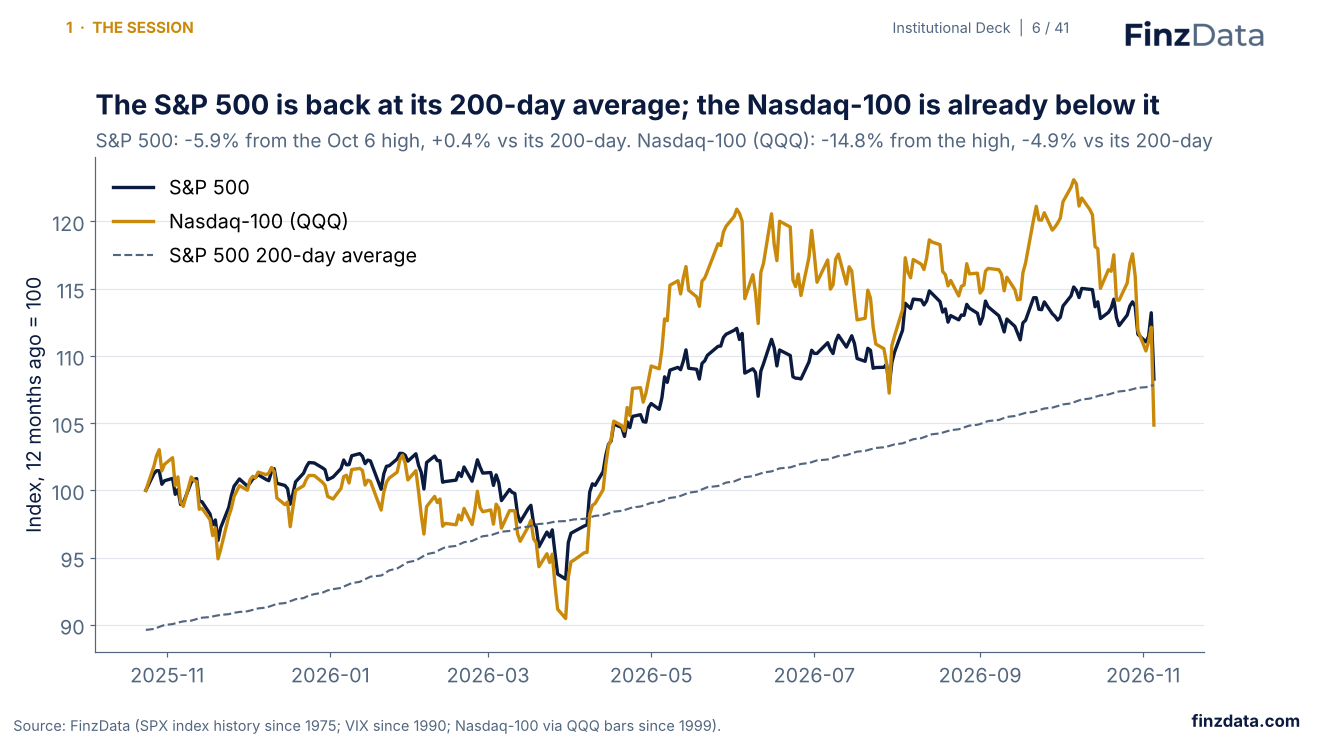
The S&P 500 is -5.9% from its October 6 record and +0.4% above its 200-day average. The Nasdaq-100 (QQQ) is -14.8% from its high and already below its 200-day.
7. Every sector fell; chips and tech fell hardest
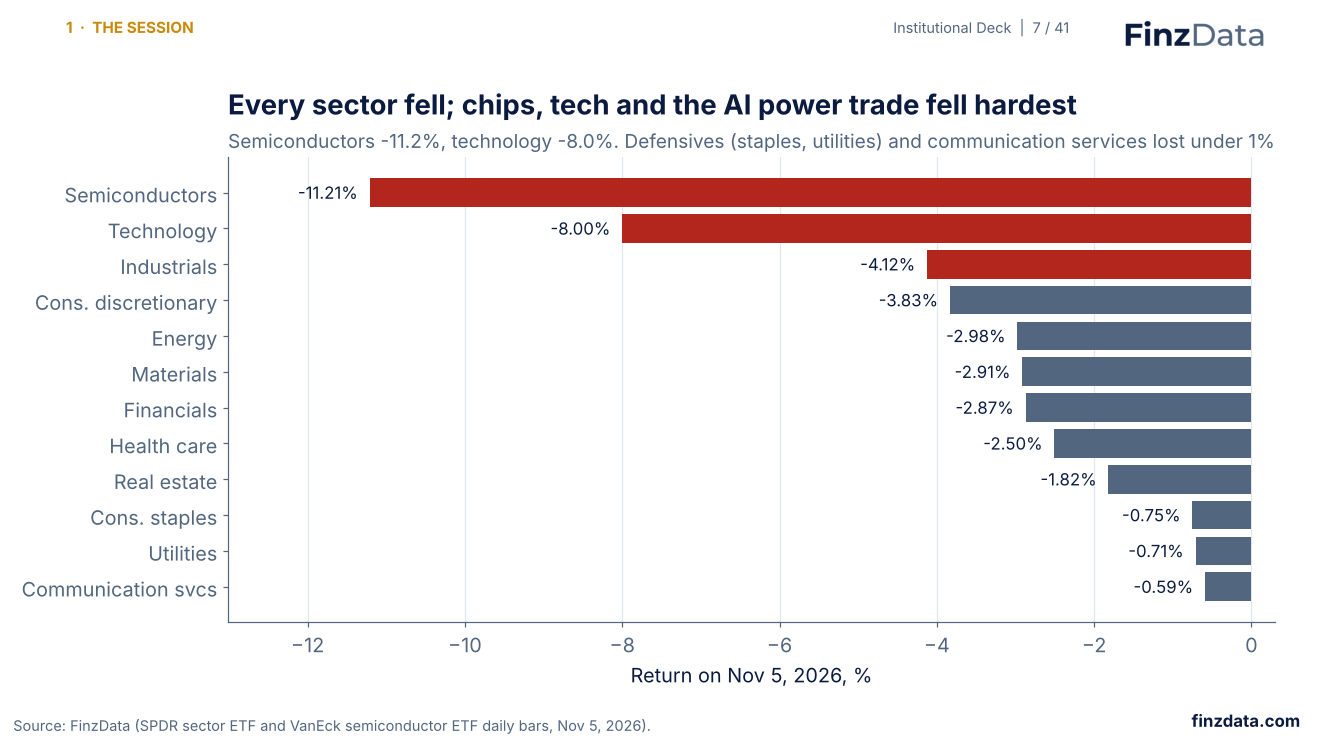
Semiconductors (SMH) fell 11.2% and technology (XLK) 8.0%. Staples, utilities and communication services lost less than 1%.
8. A month-old rotation out of AI
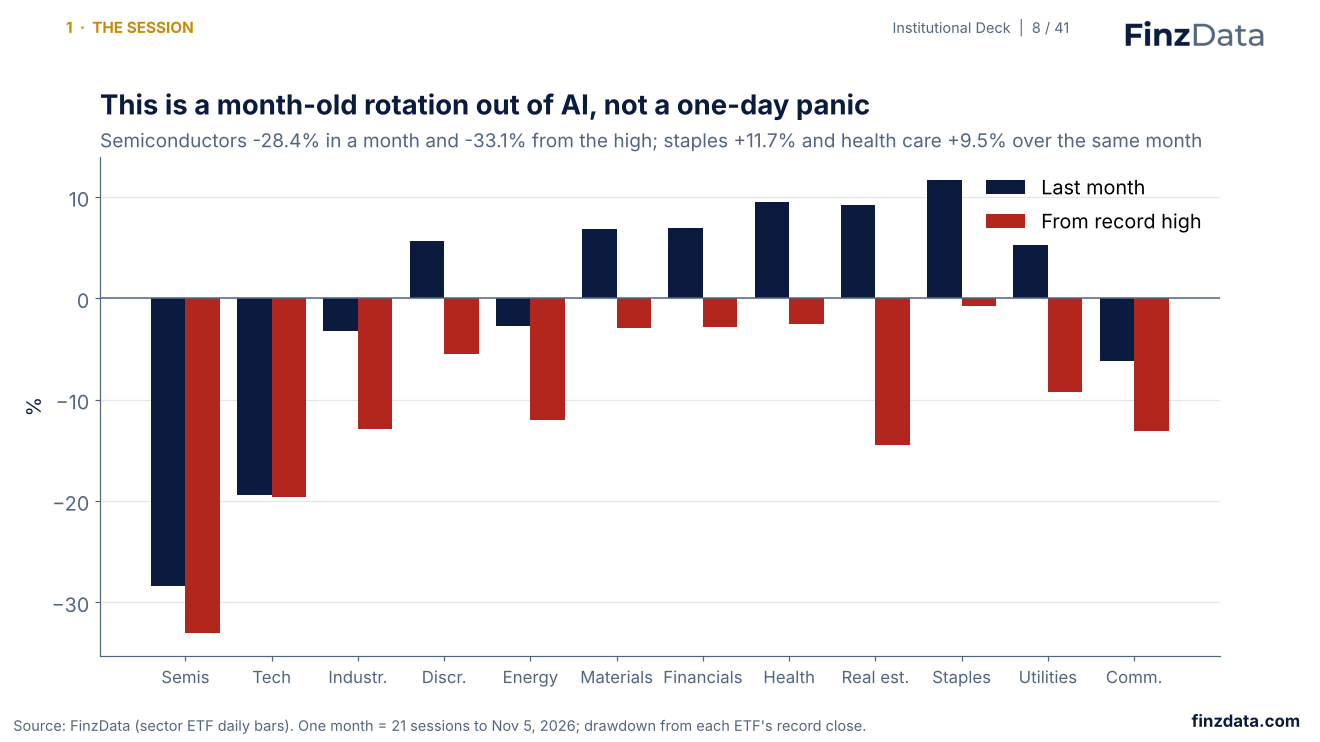
Semiconductors are -28.4% over the past month and -33.1% from their high, while staples rose +11.7% and health care +9.5%. Thursday accelerated a rotation that began in early October.
9. Four catalysts on one tape
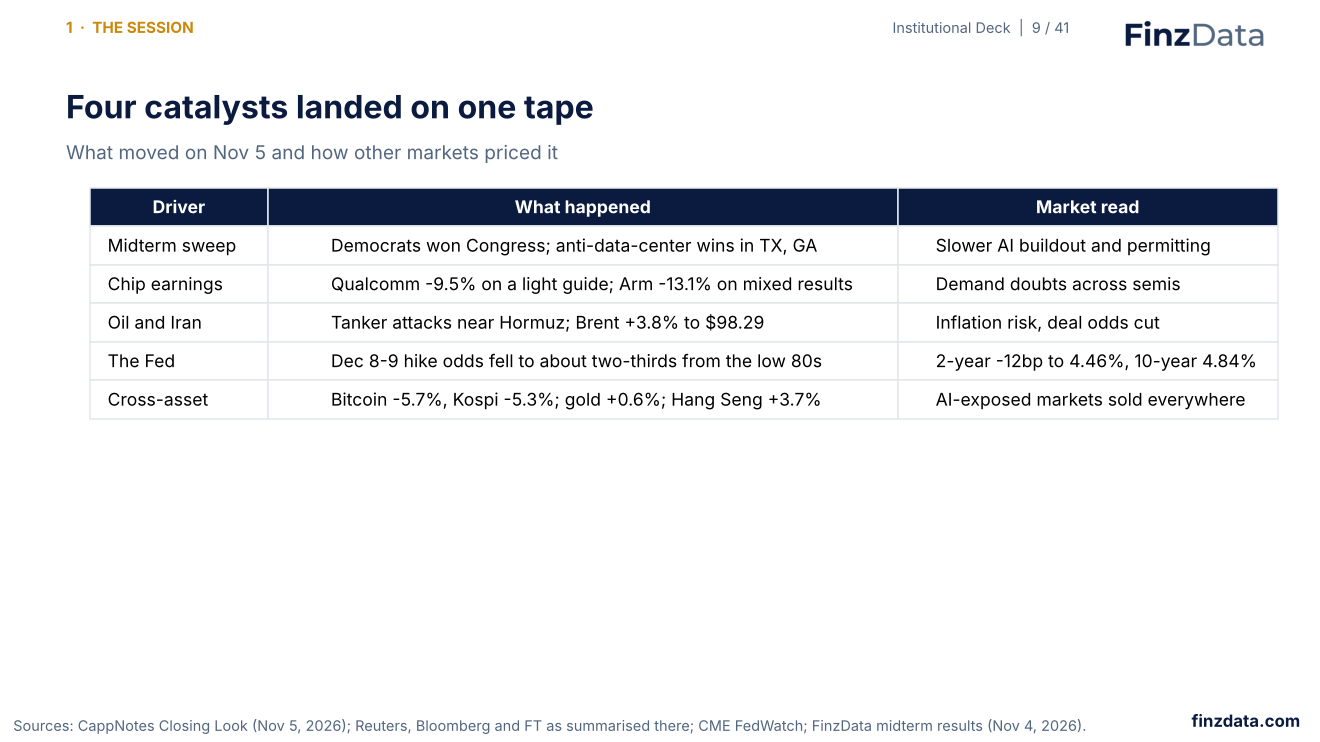
Democrats won Congress on a platform that included limits on data centers; Qualcomm and Arm disappointed; tanker attacks near Hormuz lifted Brent 3.8% to $98.29; and markets still price about a two-in-three chance of a December Fed hike.
10. What the street expected, and when
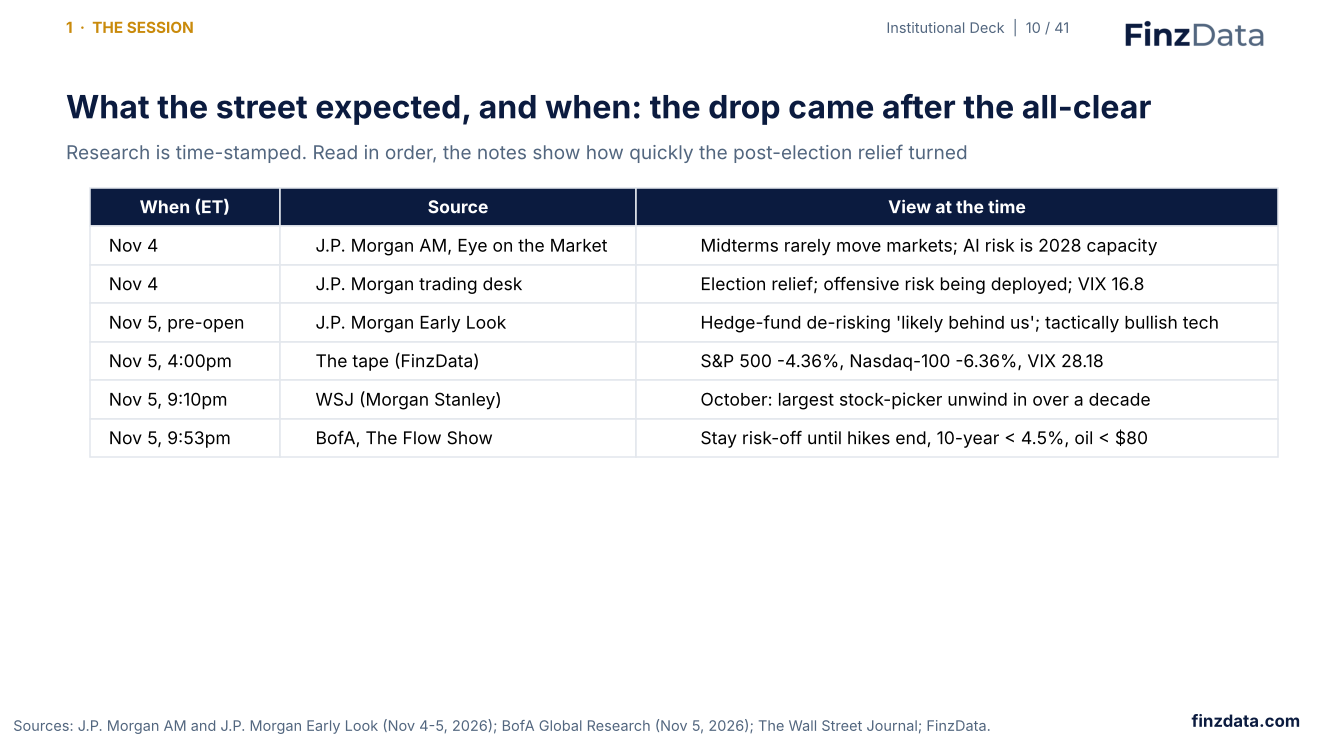
Research is time-stamped. On November 4 the view was that midterms rarely move markets and that de-risking was largely done. The S&P 500 fell 4.36% the next day, and by that evening the reports had turned to the largest stock-picker unwind in a decade.
11. The ballot hit 2028 AI capacity
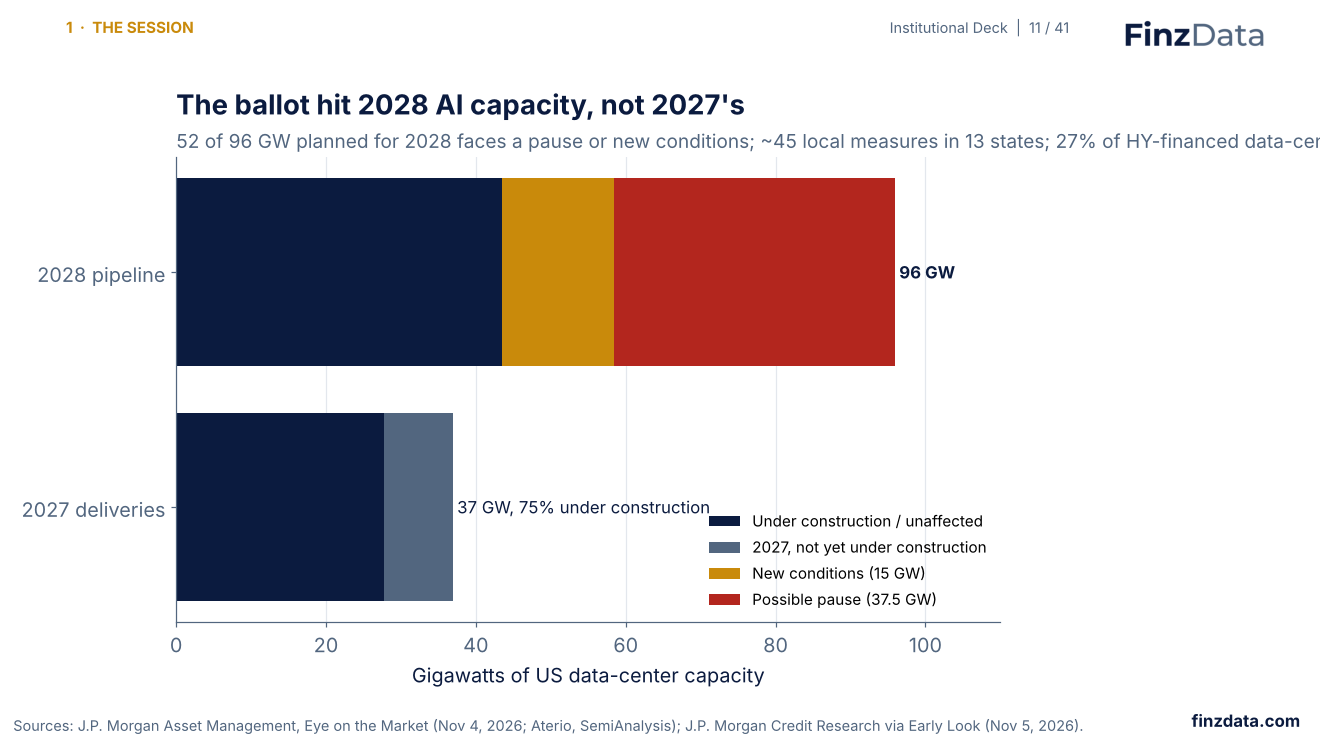
Data centers due in 2027 (37 GW, 75% under construction) are largely out of reach of new state rules. Of the 96 GW planned for 2028, 52 GW faces a possible pause or new conditions such as grid-cost charges, water limits or the end of tax breaks.
12. Record inflows the week before
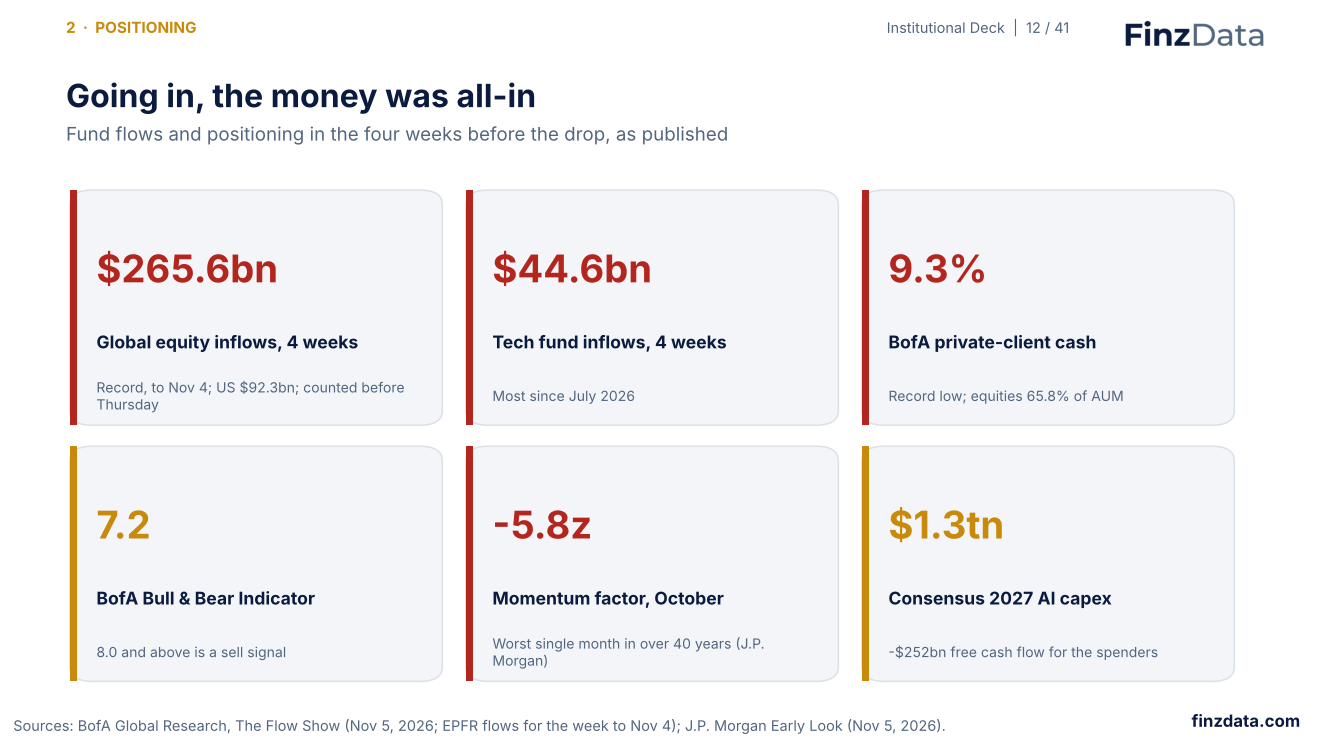
Global equity funds took a record $265.6bn in the four weeks to November 4, before the drop. Private-client cash at BofA sat at a record-low 9.3%, and the momentum factor had its worst month in over 40 years in October.
13. The semis-energy barbell got leg-swept
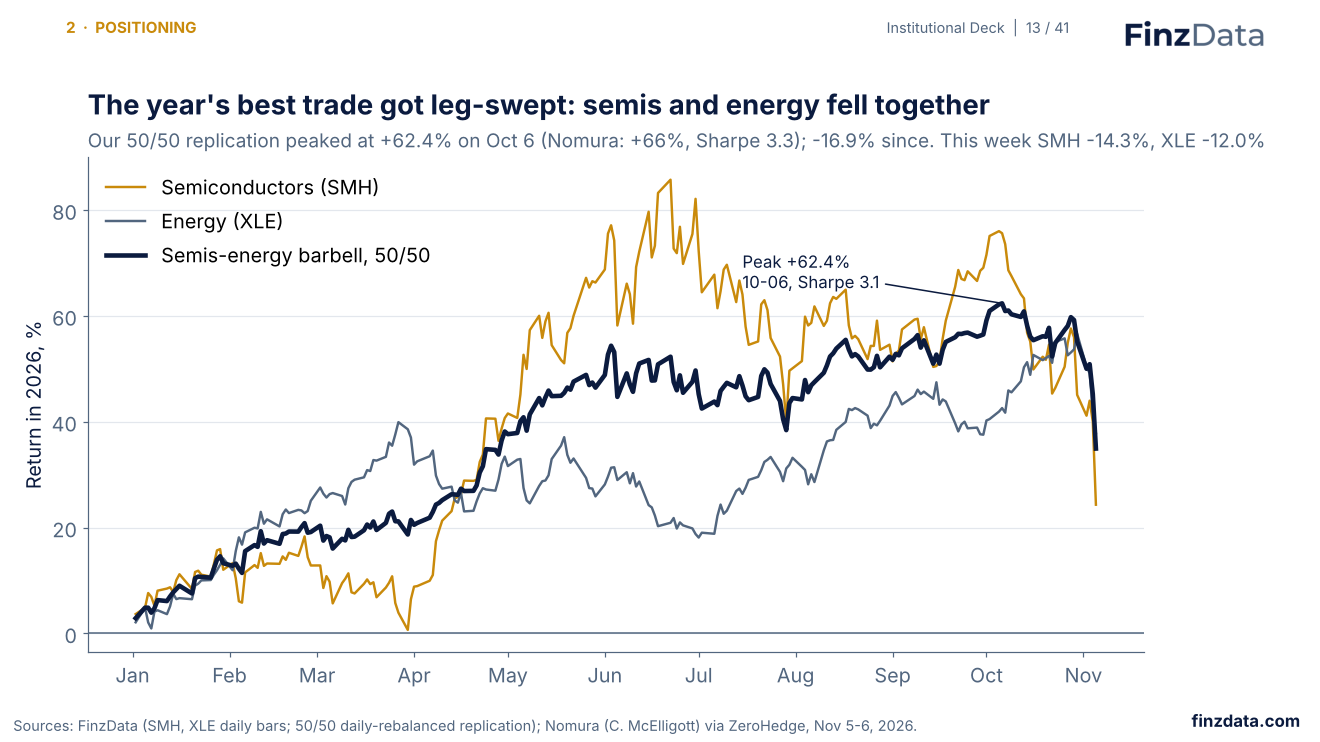
A 50/50 semiconductors-energy portfolio, the year's standout trade, peaked at +62.4% on October 6 with a Sharpe ratio of 3.1. Both legs fell together this week: SMH -14.3% and XLE -12.0%, so the hedge stopped hedging.
14. Hedges stripped off before the drop
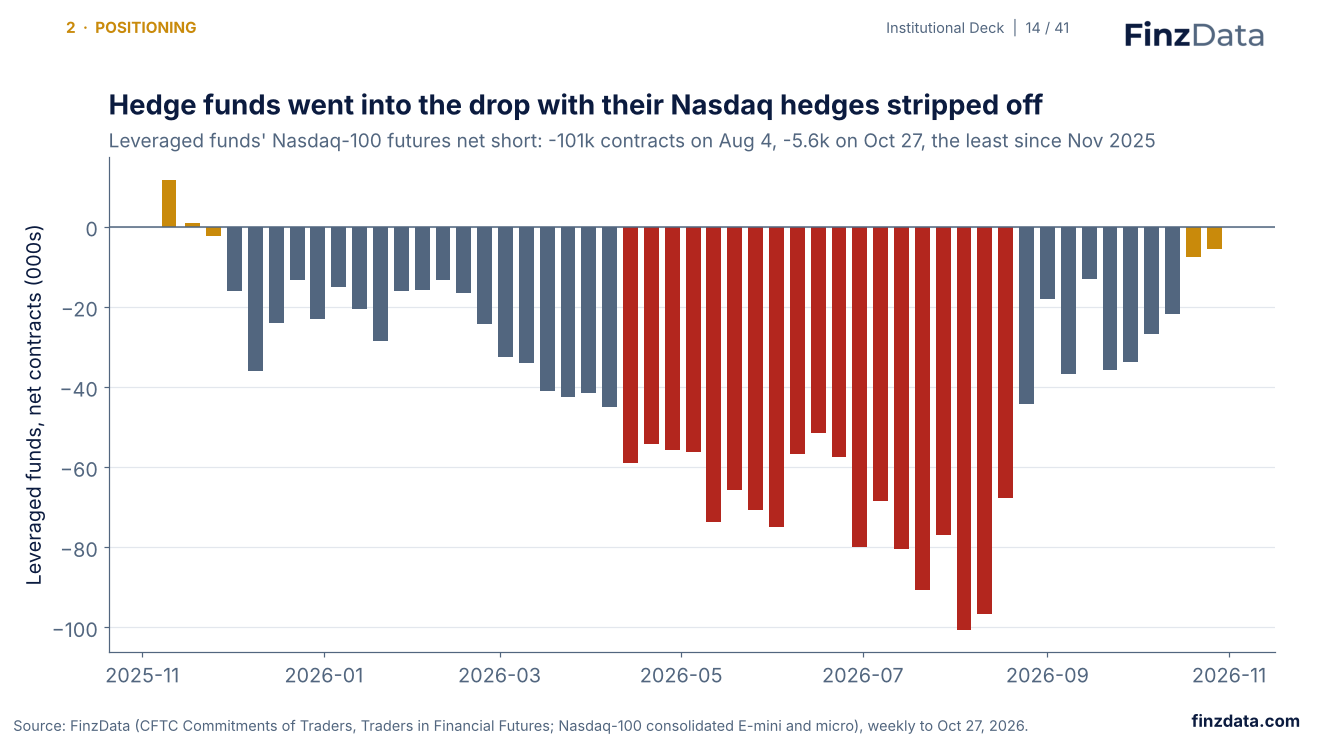
FinzData's CFTC Commitments of Traders data show leveraged funds cut their net short in Nasdaq-100 futures from about 101,000 contracts in August to 5,600 on October 27, the least short since November 2025. Funds went into the drop with few index hedges.
15. Stock pickers were already de-grossing
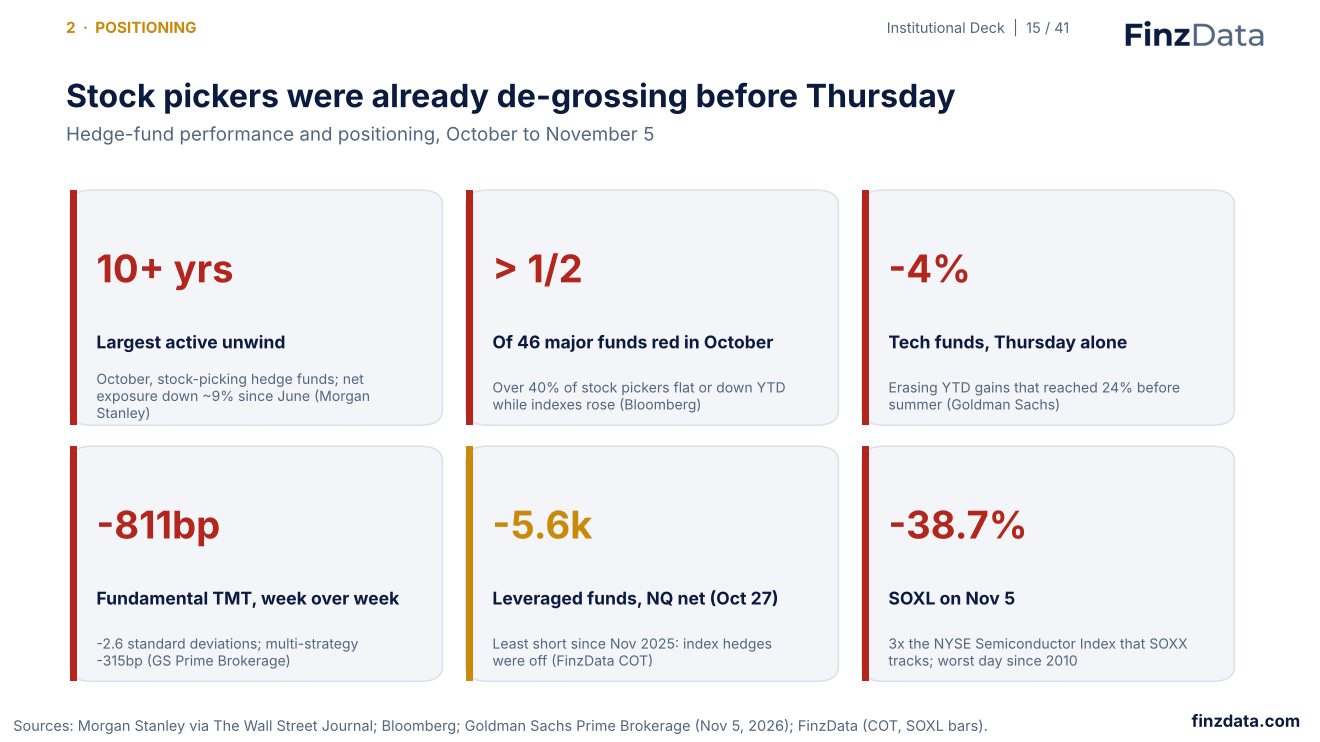
Morgan Stanley reports October was the largest active reduction of positions by stock-picking hedge funds in over a decade. SOXL, which moves 3x the daily return of the NYSE Semiconductor Index that SOXX tracks, fell -38.7% on November 5, its worst day since 2010.
16. The more hedge funds owned a stock, the harder it fell
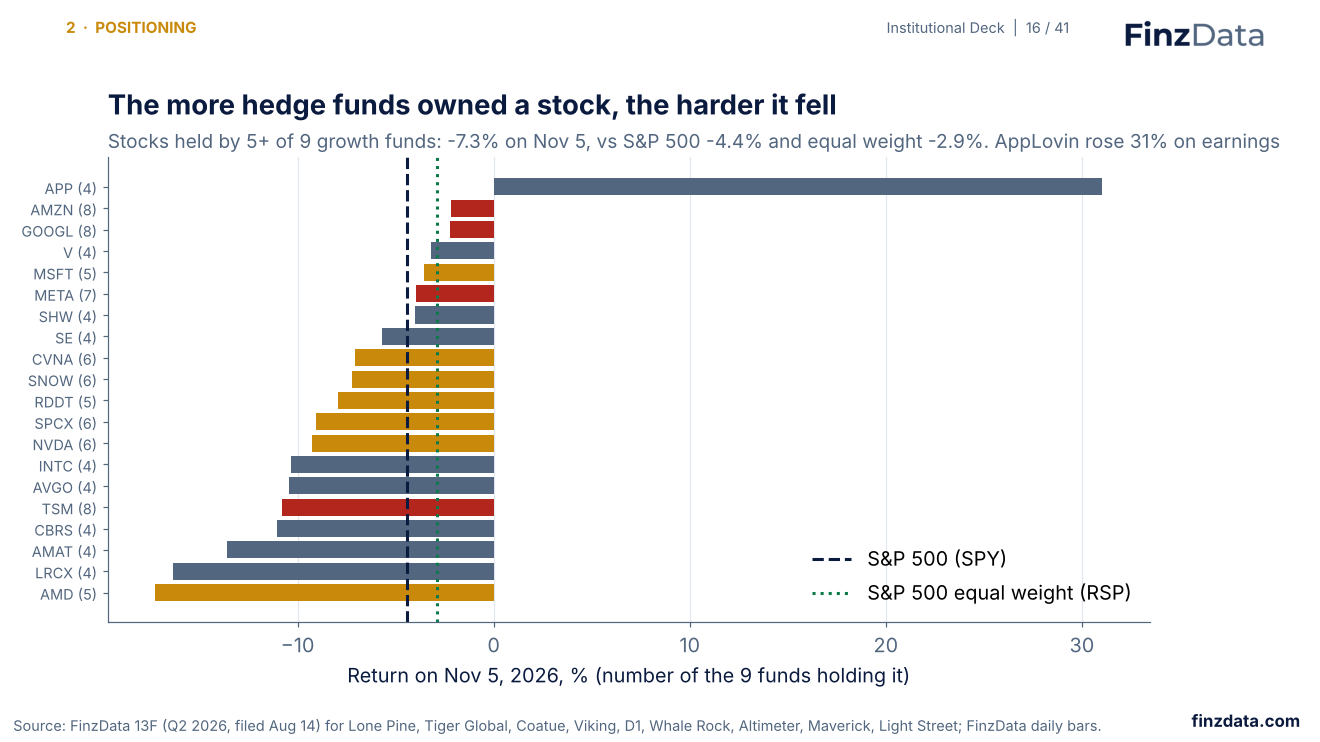
Using FinzData 13F holdings for nine growth funds, the stocks held by five or more of them fell -7.3% on November 5, against -4.4% for the S&P 500 and -2.9% for the equal-weight index.
17. Dealers short gamma since mid-October
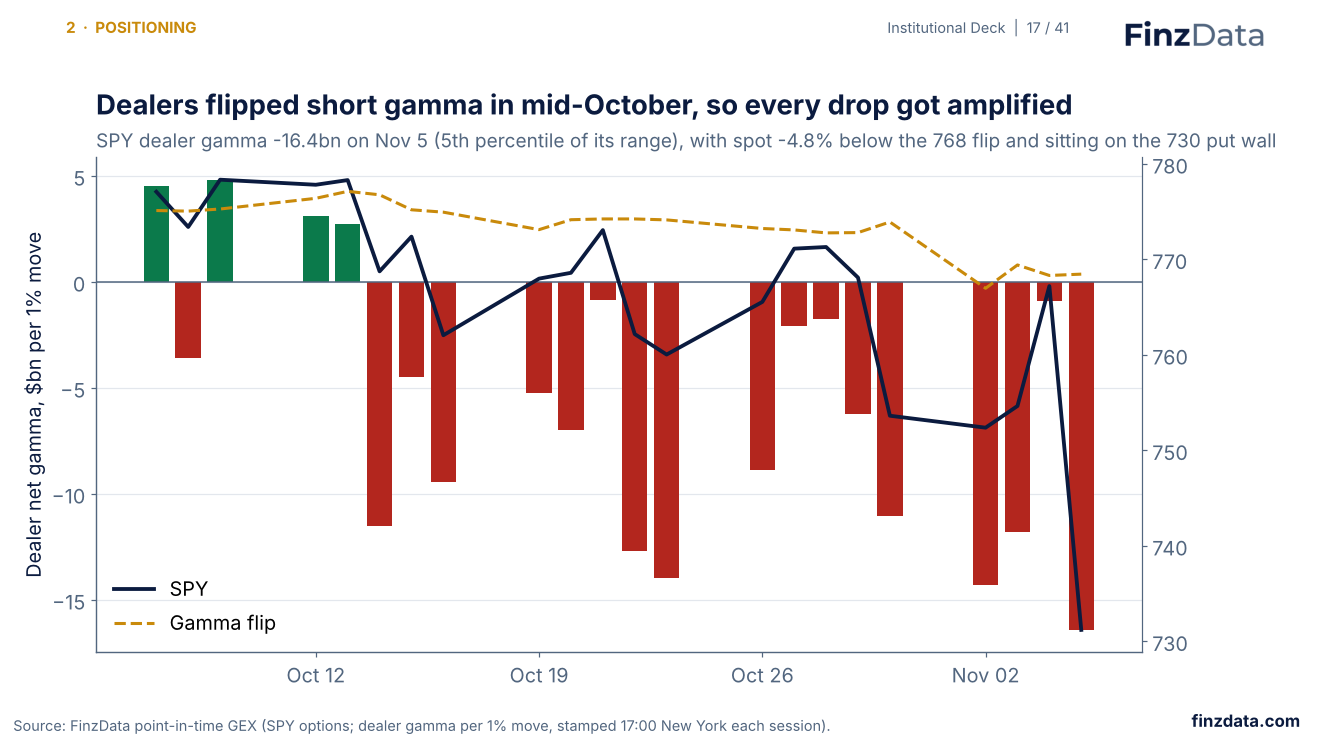
FinzData point-in-time GEX shows SPY dealers turned short gamma in mid-October. On November 5 they were short $16.4bn per 1% move, near the bottom of the range, with SPY 4.8% below its gamma flip and sitting on the 730 put wall. Short gamma means dealer hedging adds to moves.
18. Vol-control funds as forced sellers
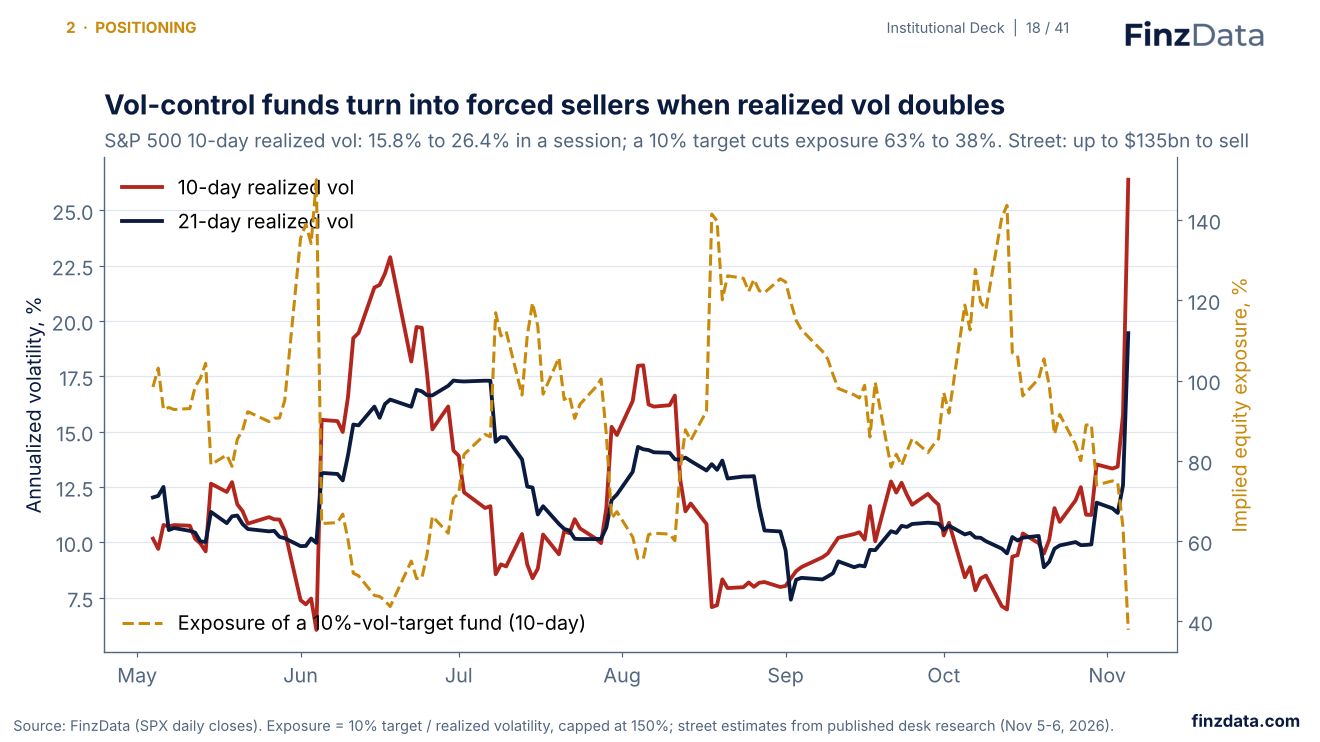
The S&P 500's 10-day realized volatility jumped from 15.8% to 26.4% in one session. A fund targeting 10% volatility would cut equity exposure from 63% to 38% on that measure; street estimates put potential futures selling at up to $135bn.
19. Short gamma in AI chips, long gamma in hyperscalers
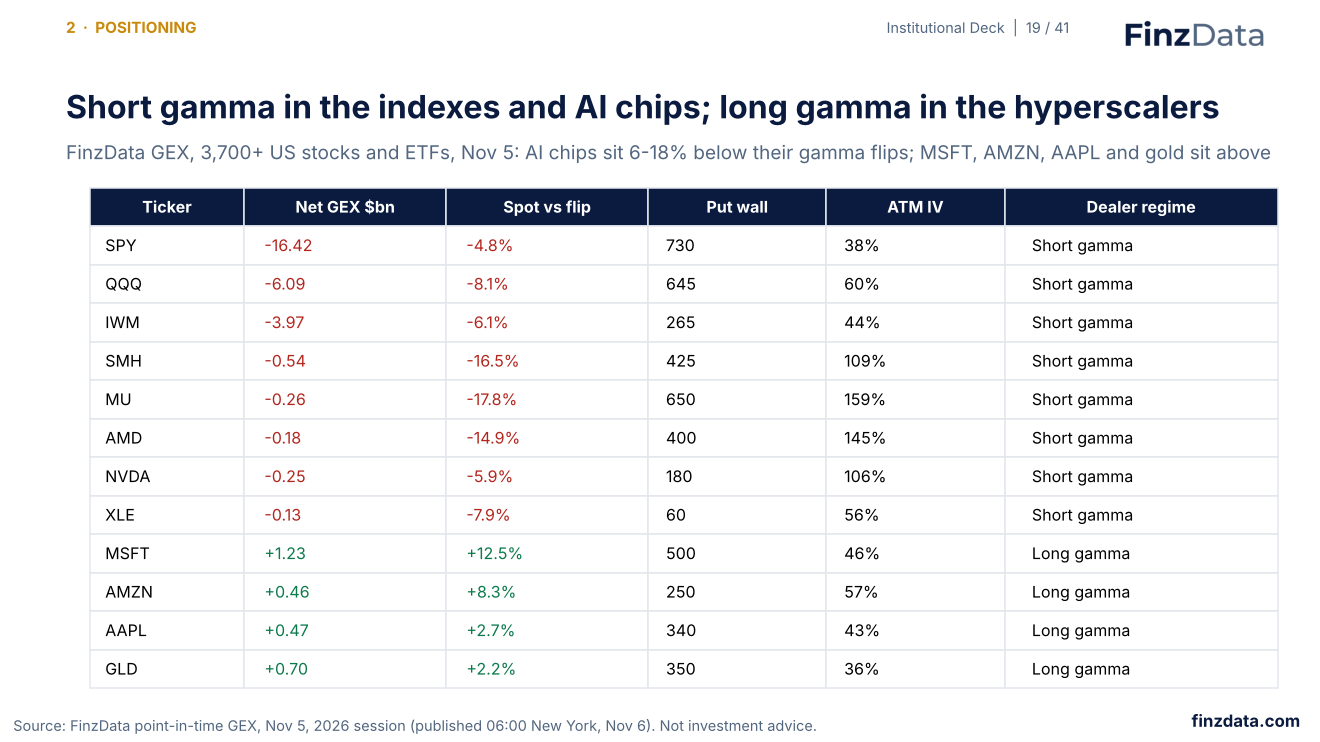
Across 3,700+ US stocks and ETFs in FinzData GEX, the indexes and AI chip names are short gamma, with SMH, MU and AMD 15-18% below their flips. Microsoft, Amazon, Apple and gold are long gamma.
20. Everyone reached for protection at once
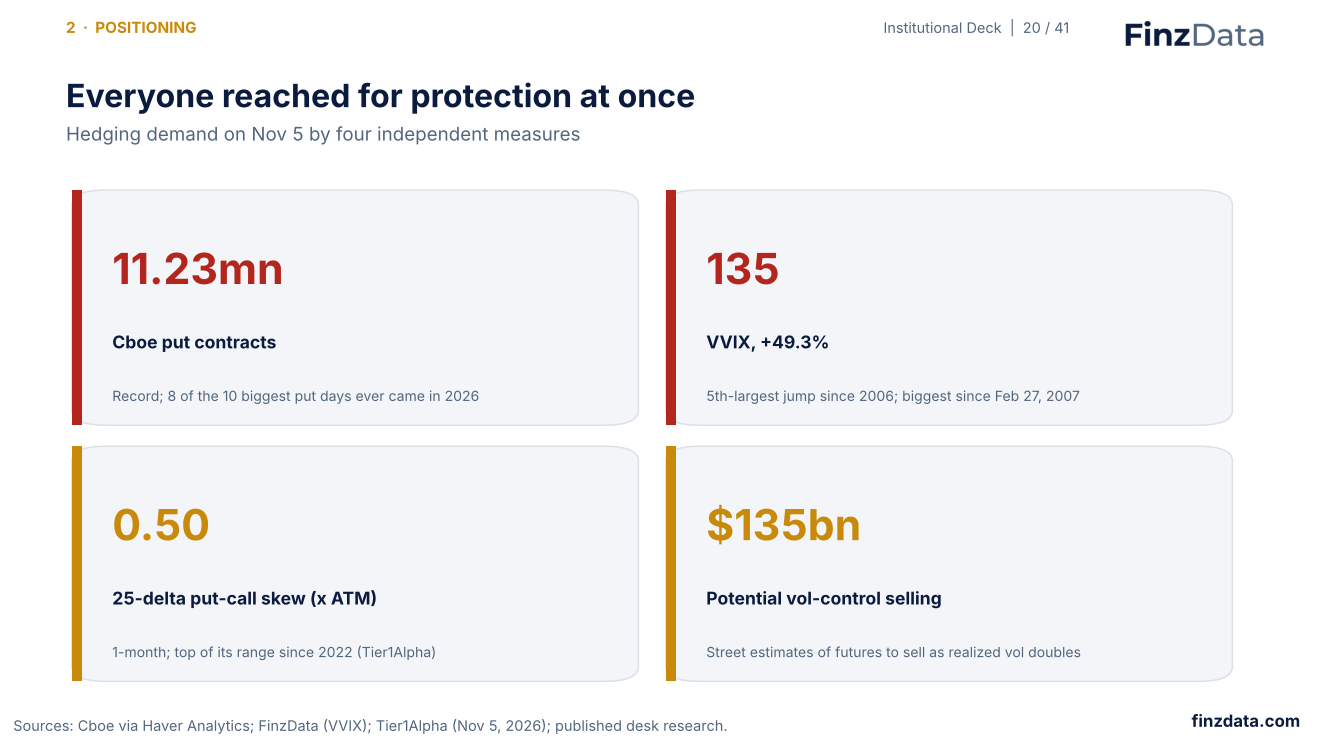
Cboe recorded 11.23 million put contracts on November 5, the most in its history. The VVIX rose +49.3% to 135, its biggest jump since February 2007, and fundamental TMT hedge funds lost 811bp on the week.
21. FinzData Quantitative Model: stress
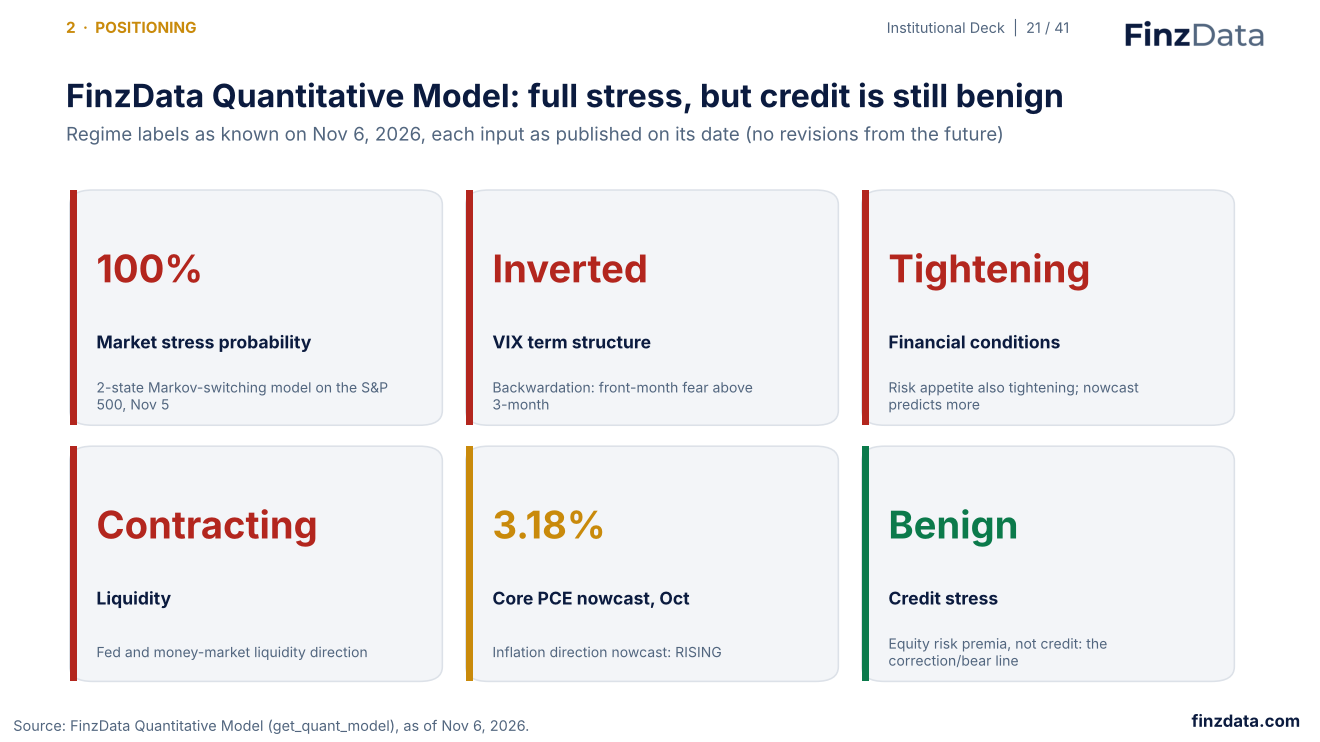
The FinzData Quantitative Model put the market stress probability at 100% on November 5, with the VIX curve inverted, financial conditions tightening and an October core PCE nowcast of 3.18%. Credit stress is still benign.
22. Taiwan steps in
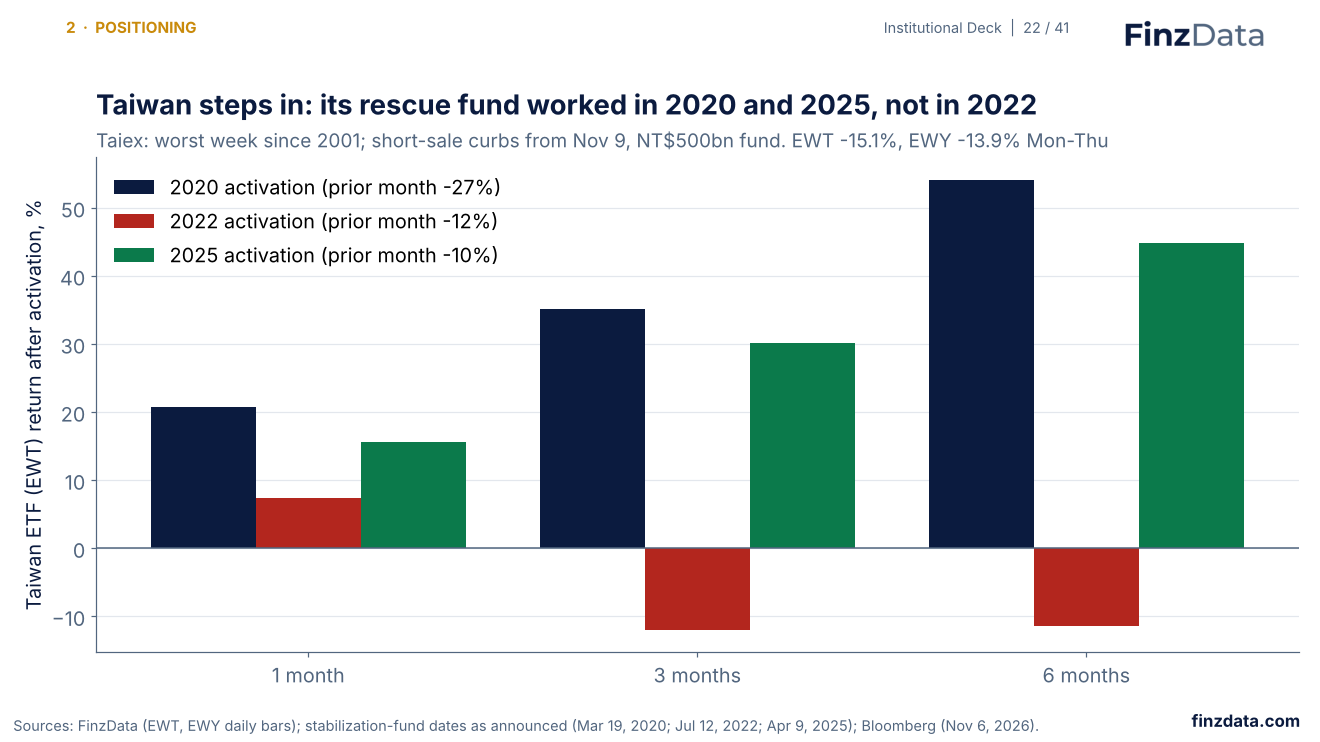
The Taiex had its worst week since 2001. Taiwan will curb short selling from November 9 and has a NT$500bn stabilization fund ready. After past activations the Taiwan ETF (EWT) rose in 2020 and 2025, but fell in 2022 while the Fed was hiking.
23. Drops this size are rare and cluster
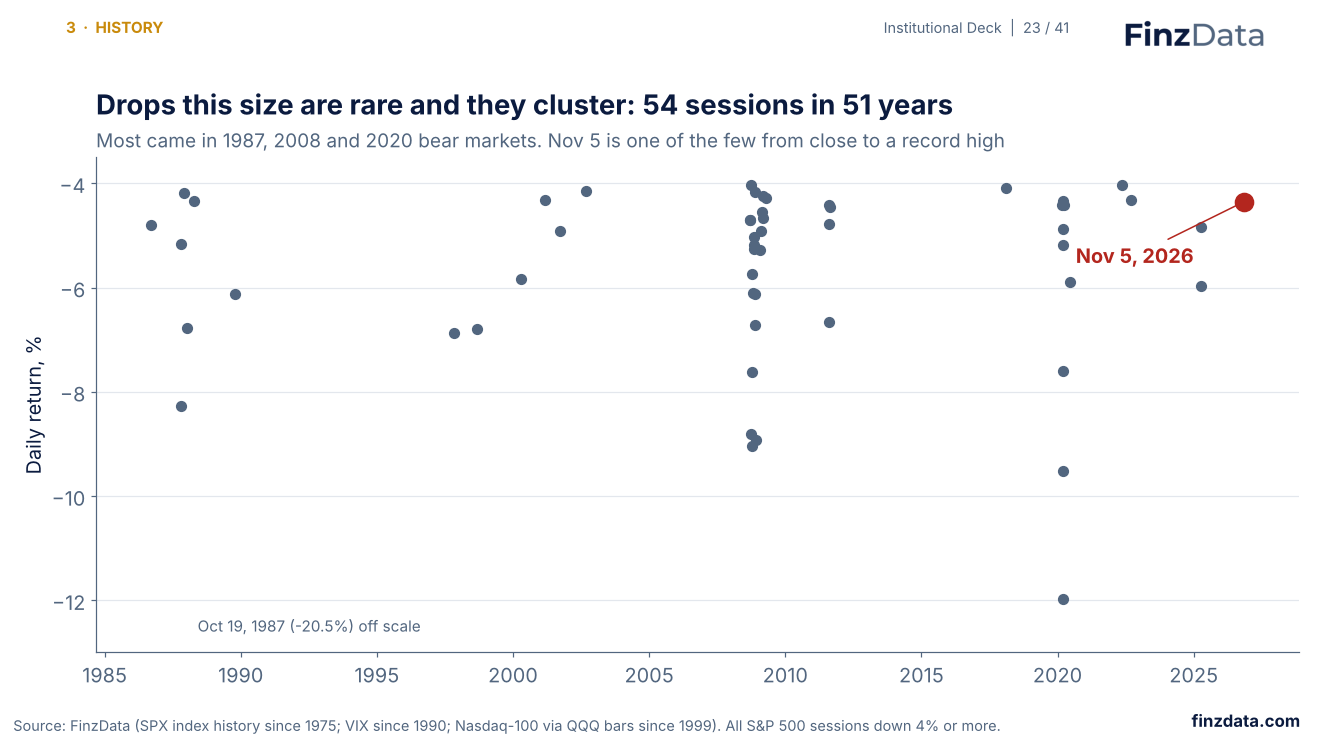
The S&P 500 has had 54 sessions down 4% or more since 1975, most in the 1987, 2008 and 2020 bear markets. November 5 is one of the few from close to a record high.
24. History after -4% days
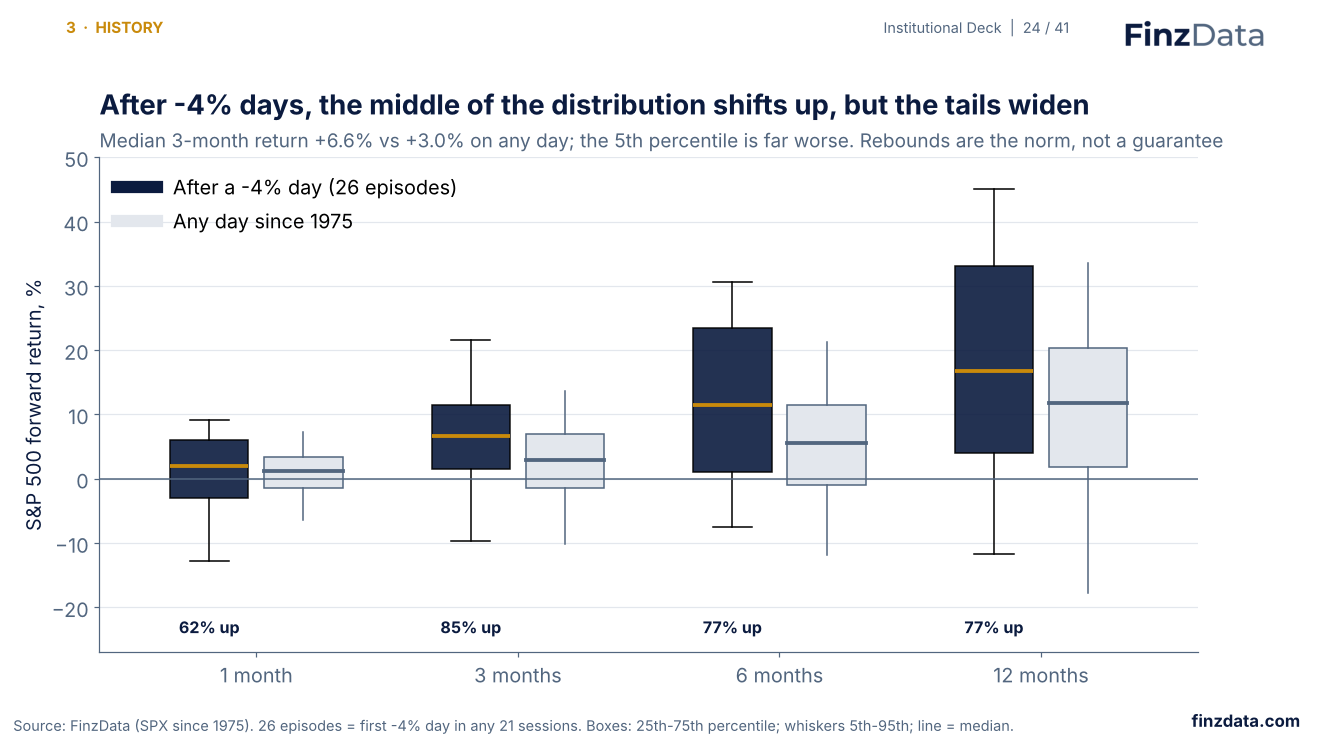
After a -4% day, the median S&P 500 return over the next three months was +6.6%, positive 85% of the time, against +2.5% on an average day.
25. The closest analogs
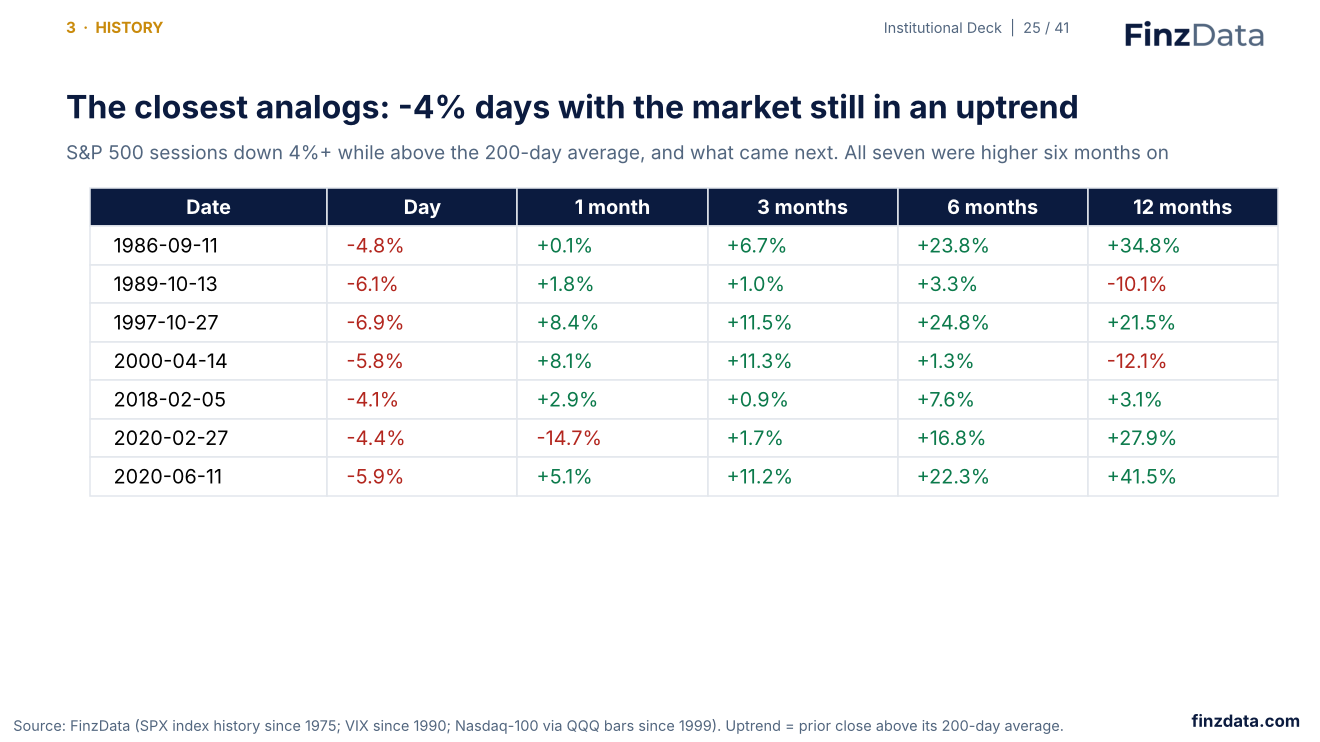
Seven times since 1975 the S&P 500 fell 4% or more while still above its 200-day average. All seven were higher six months later; five of seven a year later.
26. Does waiting three sessions help?
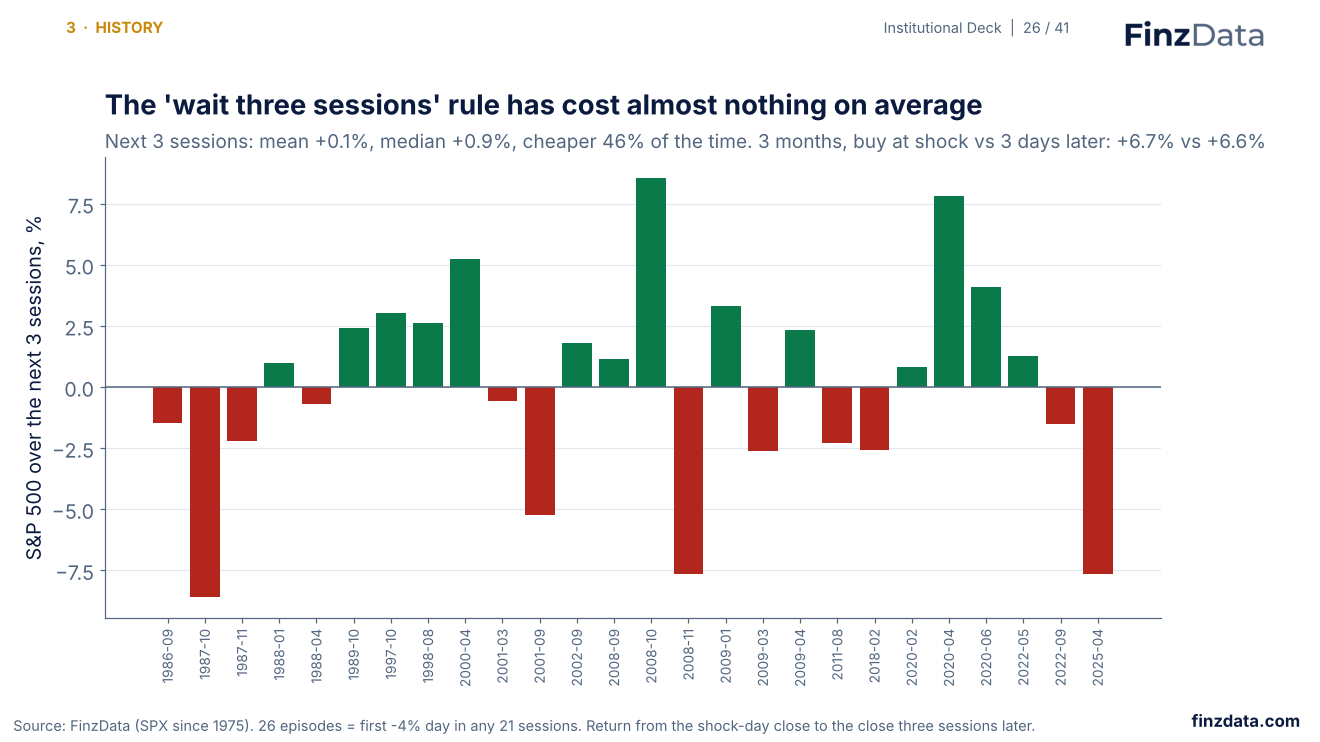
Across 26 shocks, the S&P 500 was roughly flat over the next three sessions on average and cheaper 46% of the time. Buying at the shock close or three days later produced almost the same three-month return.
27. The bear case
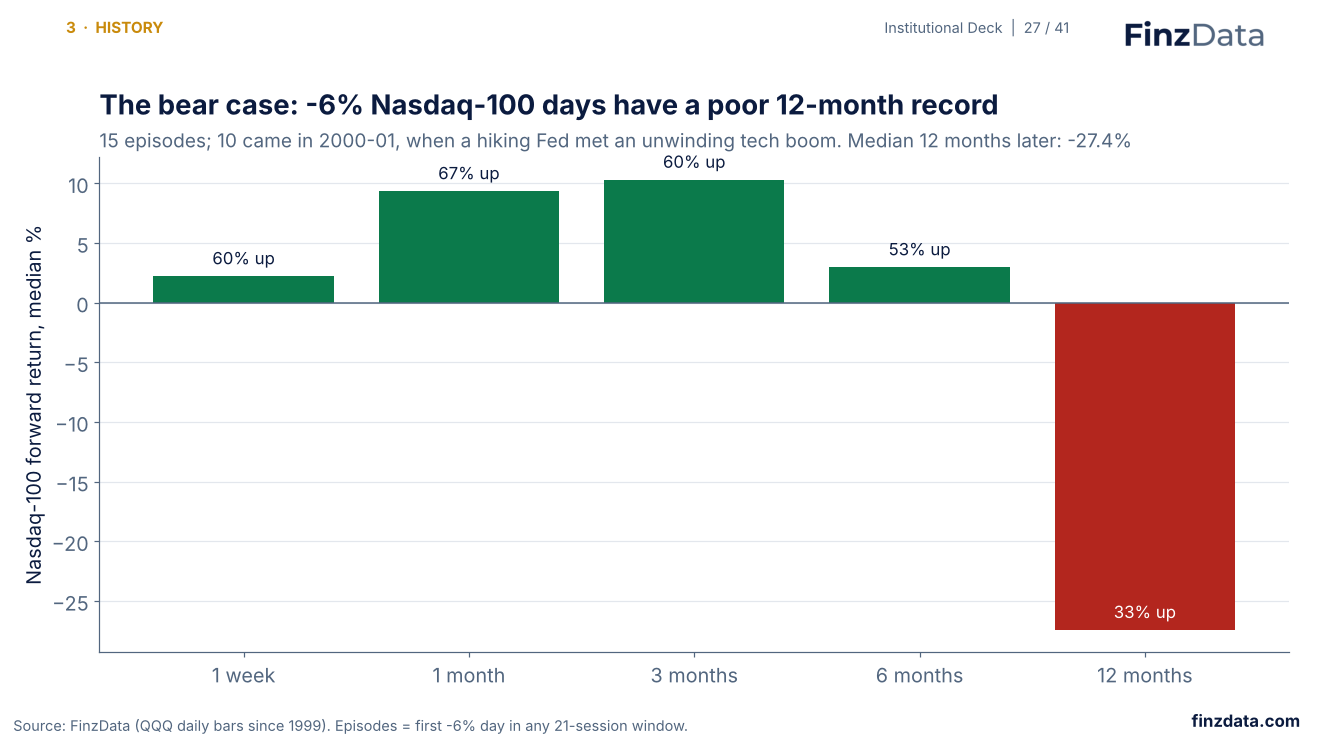
Nasdaq-100 days down 6% or more have a poor 12-month record (median -27.4%), because most came in 2000-01 when a hiking Fed met an unwinding tech boom.
28. Volatility spikes have tended to fade
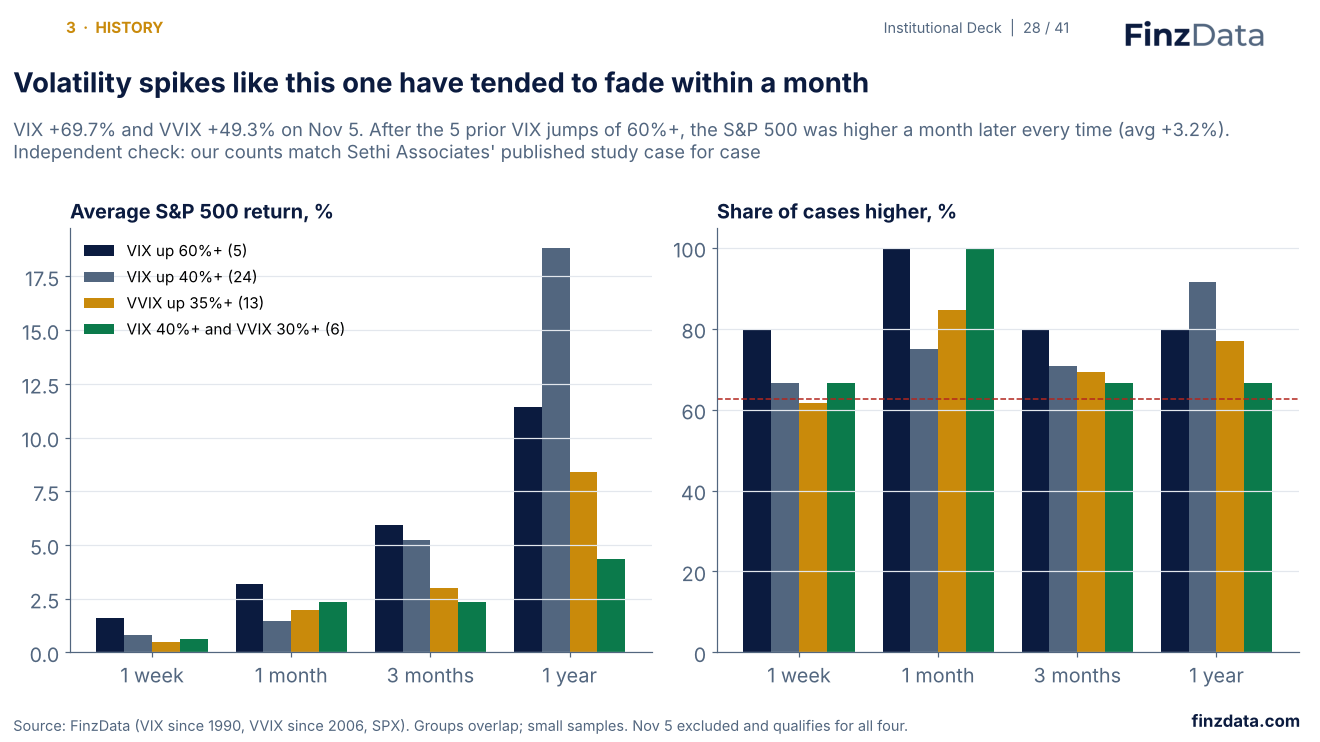
After the five prior one-day VIX jumps of 60% or more, the S&P 500 was higher a month later every time. Our counts match a study published by Sethi Associates case for case.
29. Semis below their 200-day average
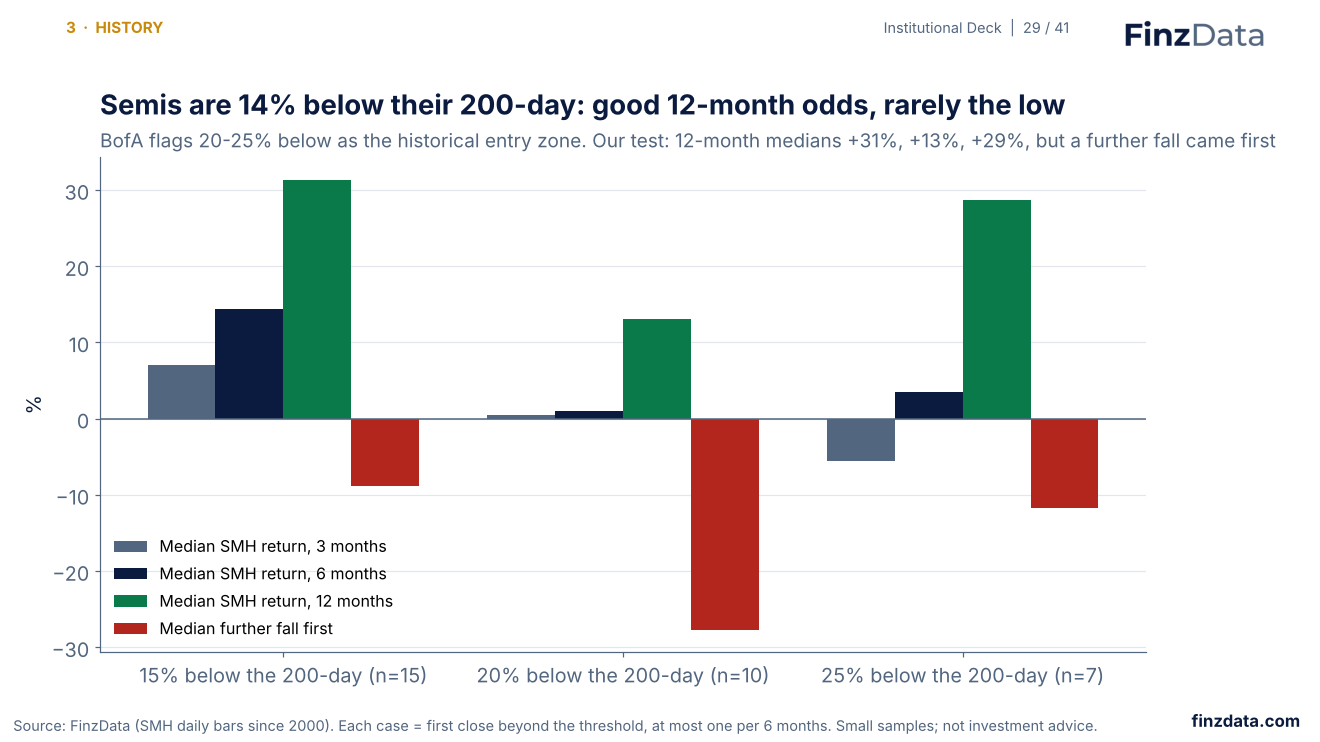
SMH is 14% below its 200-day average. After first breaks of 15%, 20% and 25% below it since 2000, 12-month median returns were positive, but a further fall usually came first.
30. Who leads the rebound
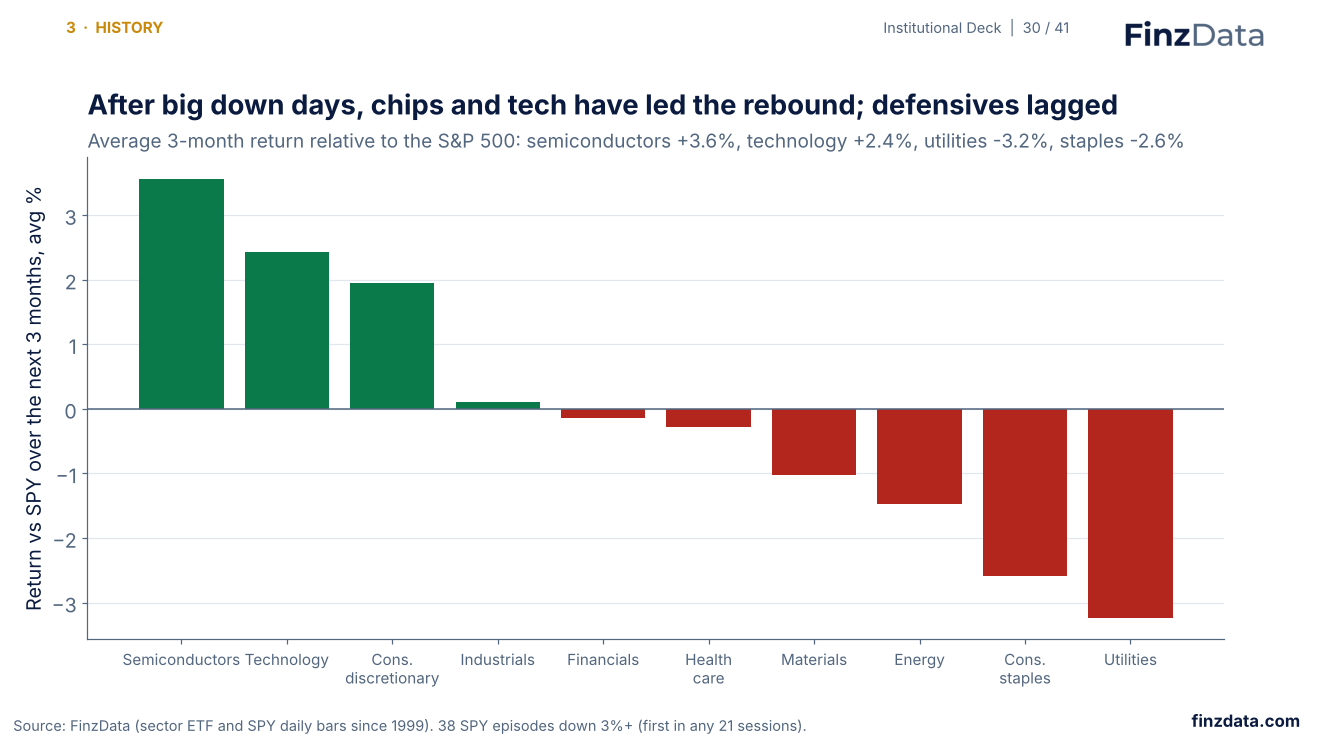
After S&P 500 drops of 3% or more since 1999, semiconductors and technology beat the index over the next three months on average, while utilities and staples lagged.
31. The midterm cycle
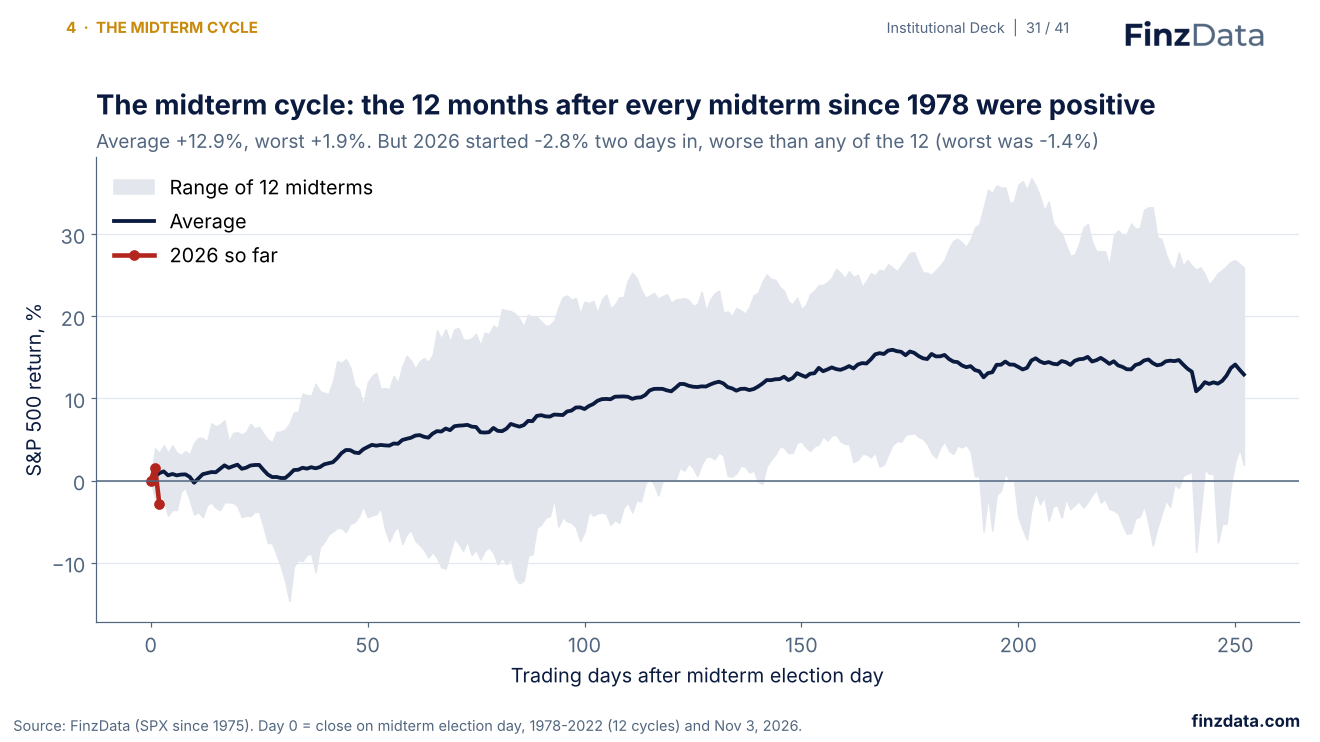
The S&P 500 rose in the 12 months after all 12 midterms since 1978, by 12.9% on average. In 2026 the S&P 500 fell 2.8% in the first two sessions after election day, worse than after any prior midterm.
32. Losing Congress has not hurt stocks
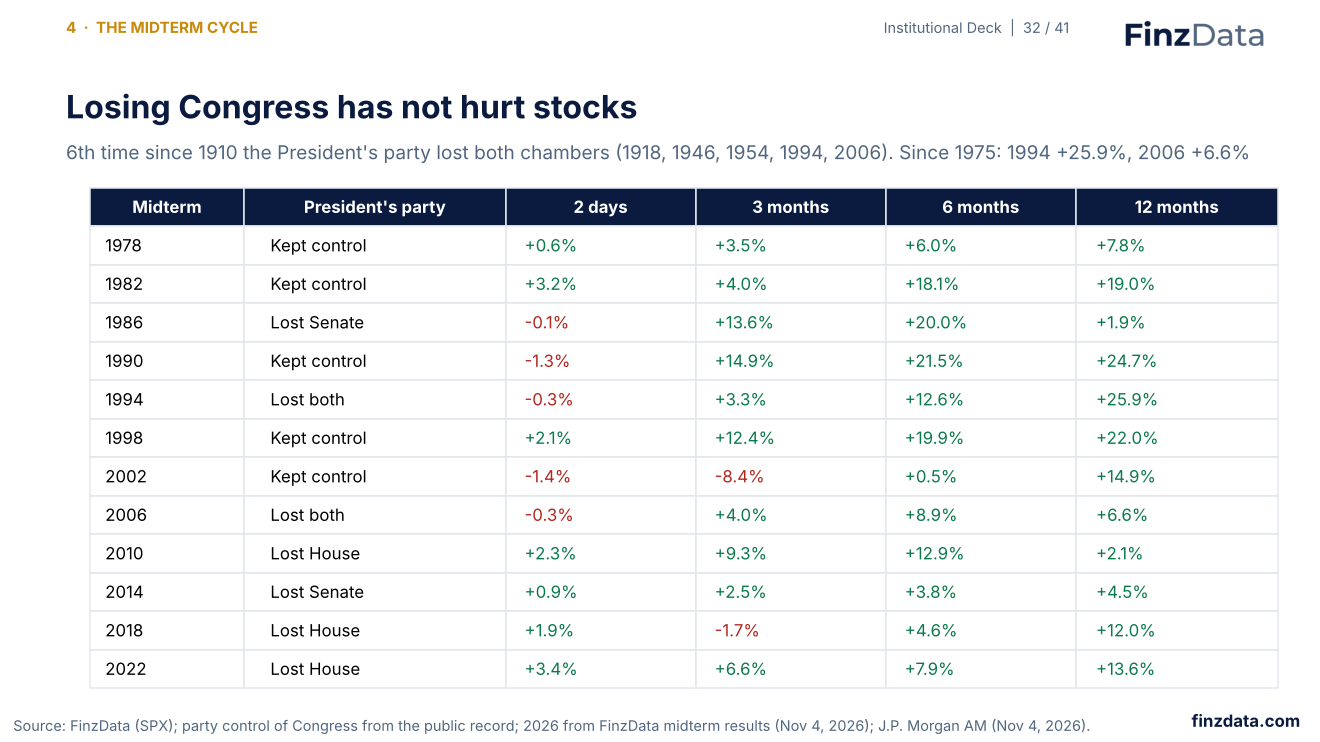
2026 is the sixth time since 1910 that the President's party lost both chambers. In 1994 and 2006, the cases in our data, the S&P 500 rose 25.9% and 6.6% over the following year.
33. Midterm-year drawdowns
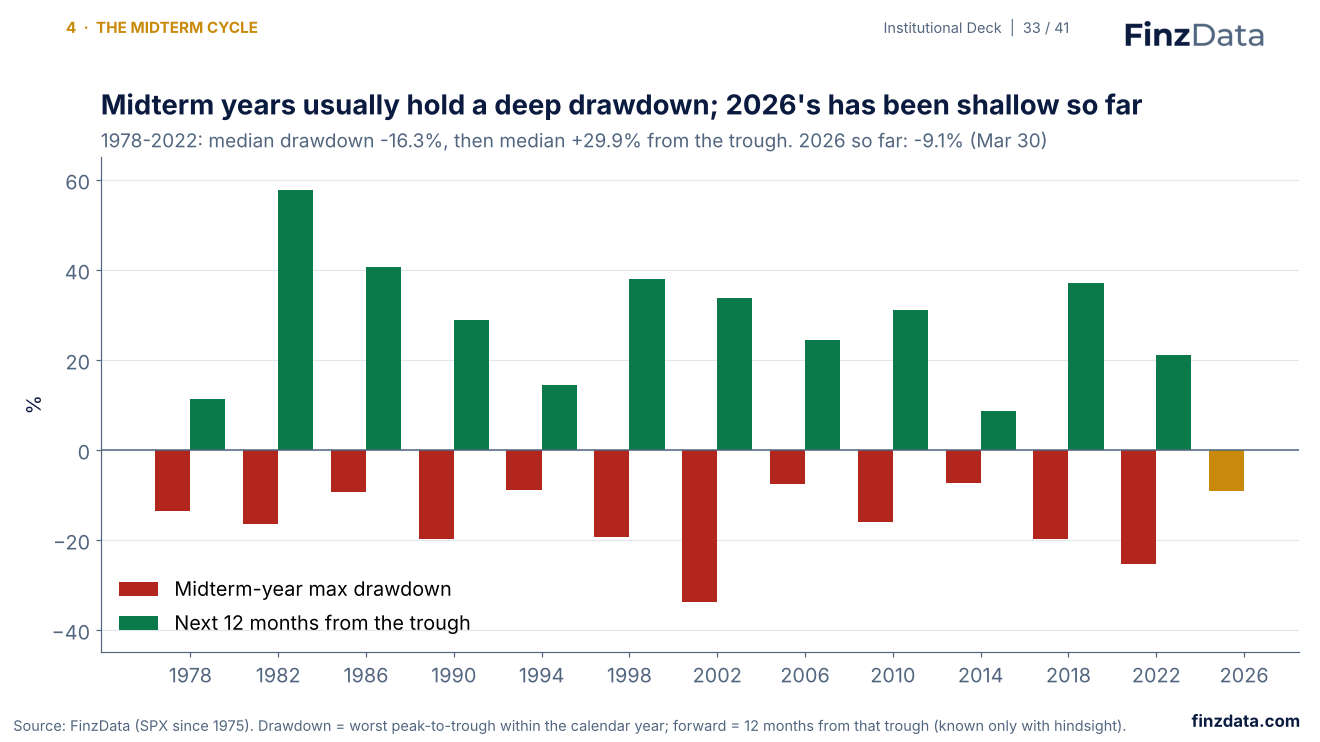
From 1978 to 2022 the median midterm-year drawdown was 16.3%, followed by a median 30% gain from the trough (known only in hindsight). The 2026 drawdown so far is 9.1%, at the March 30 low.
34. The four-year cycle
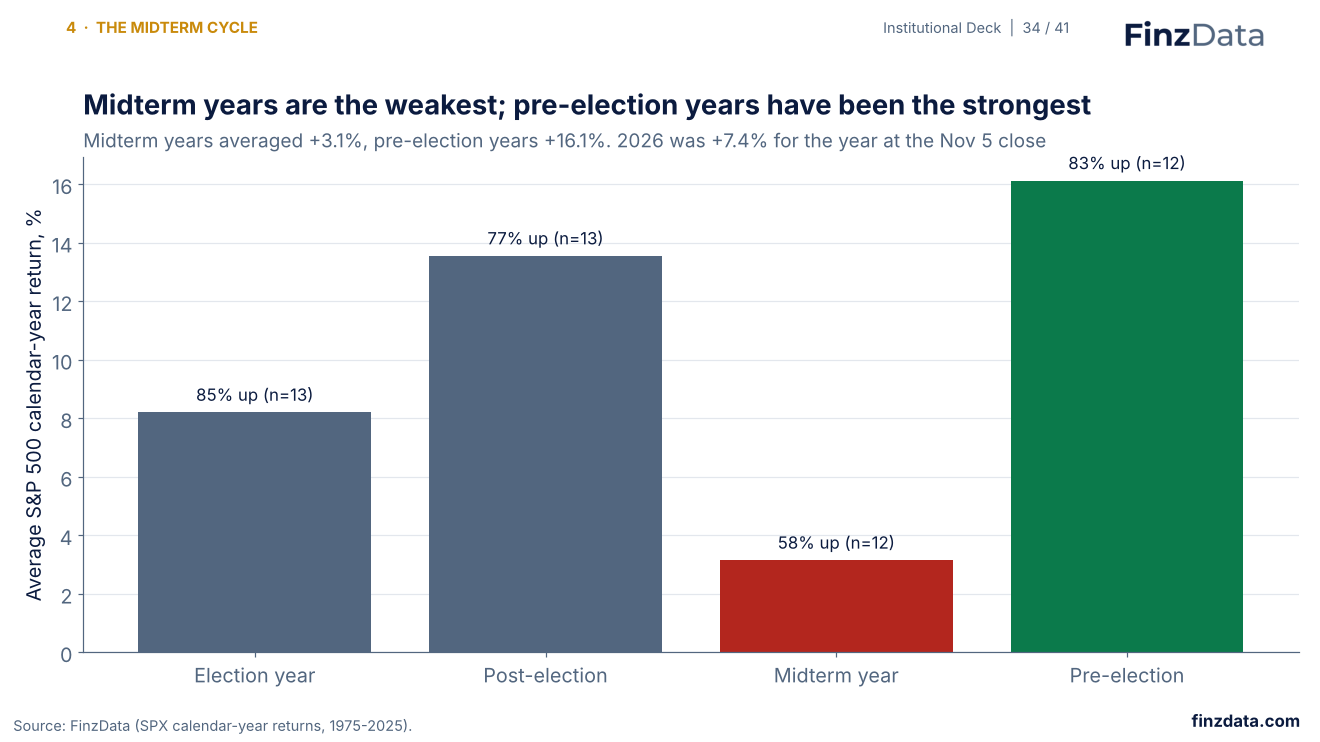
Since 1975, midterm years have been the weakest of the presidential cycle and pre-election years the strongest.
35. Walk-forward method
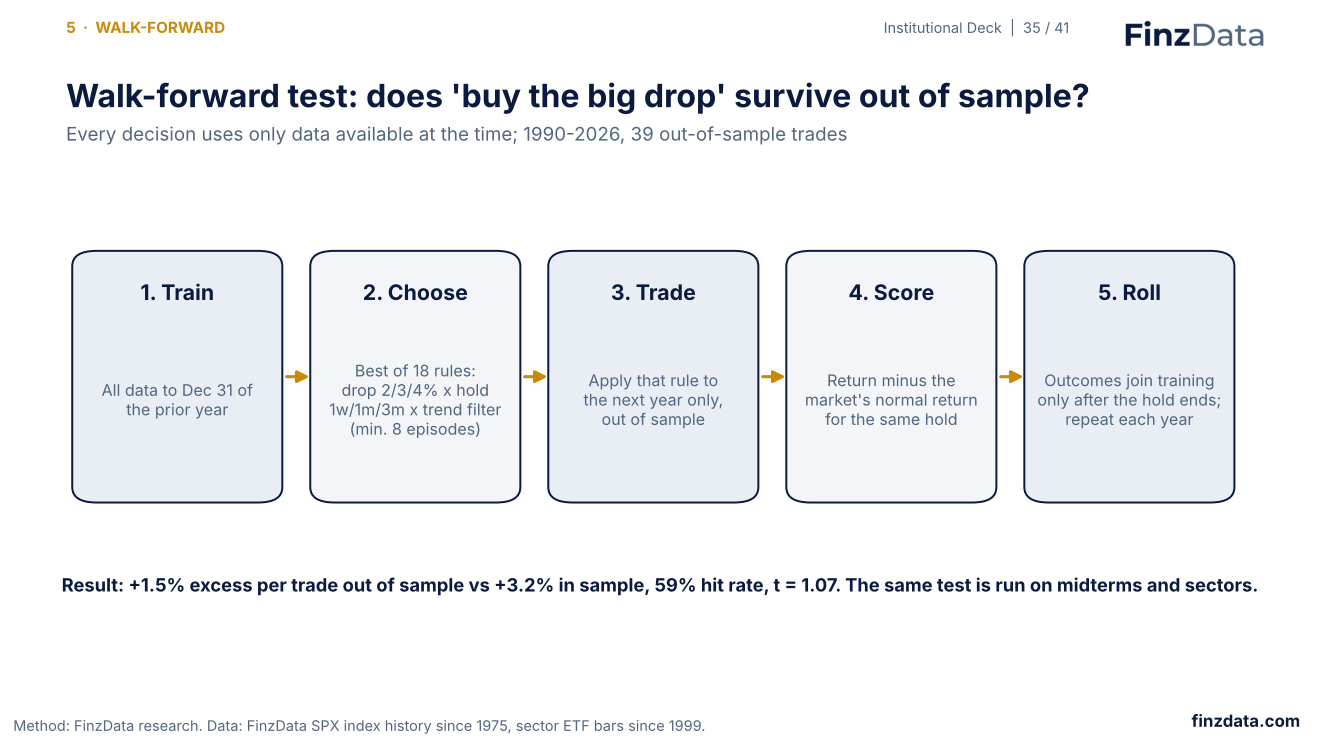
Each year from 1990, we choose the best of 18 'buy the drop' rules using only earlier data, then trade the following year. Outcomes join the training set only after the holding period ends.
36. Walk-forward result
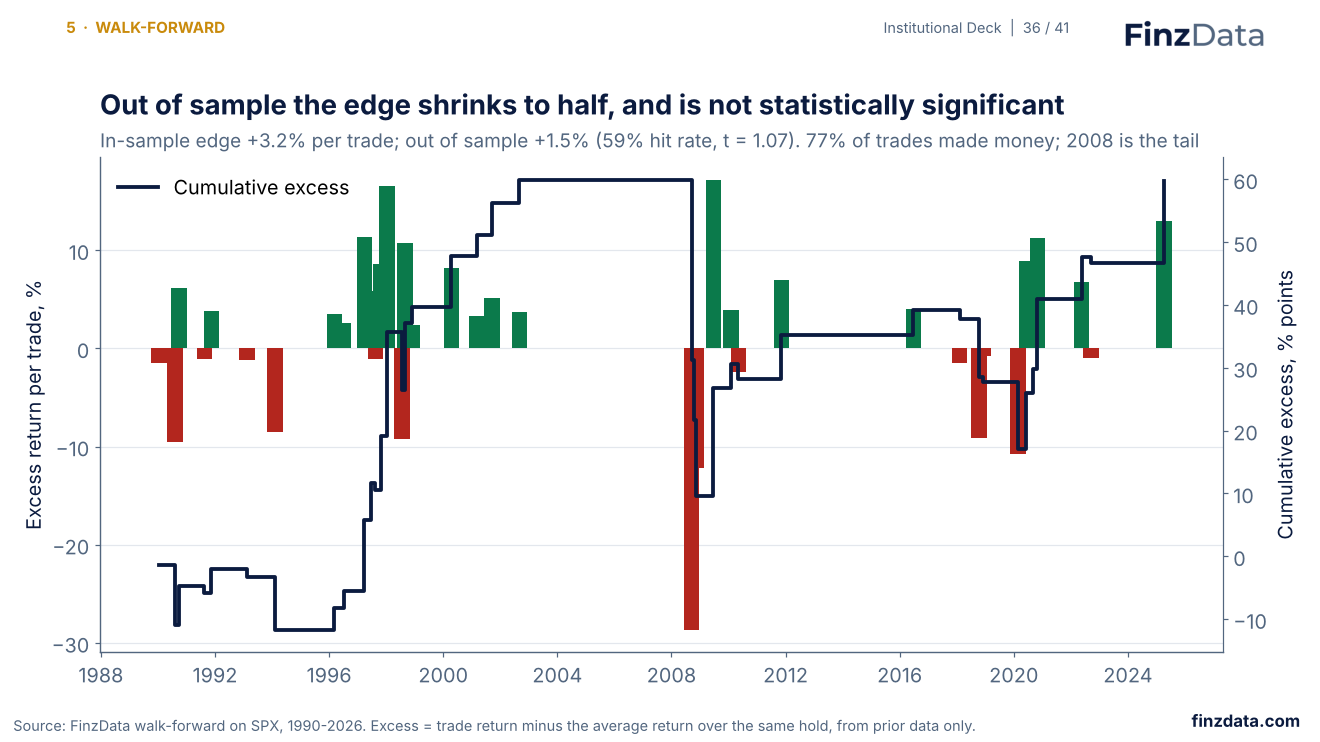
Out of sample, the edge is about half of what the backtest promised: +1.5% per trade against +3.2% in sample, across 39 trades. With t = 1.07, the edge is not statistically significant: treat it as a tilt, not a signal. The rule selected for 2026 triggered on November 5.
37. Midterms and sectors out of sample
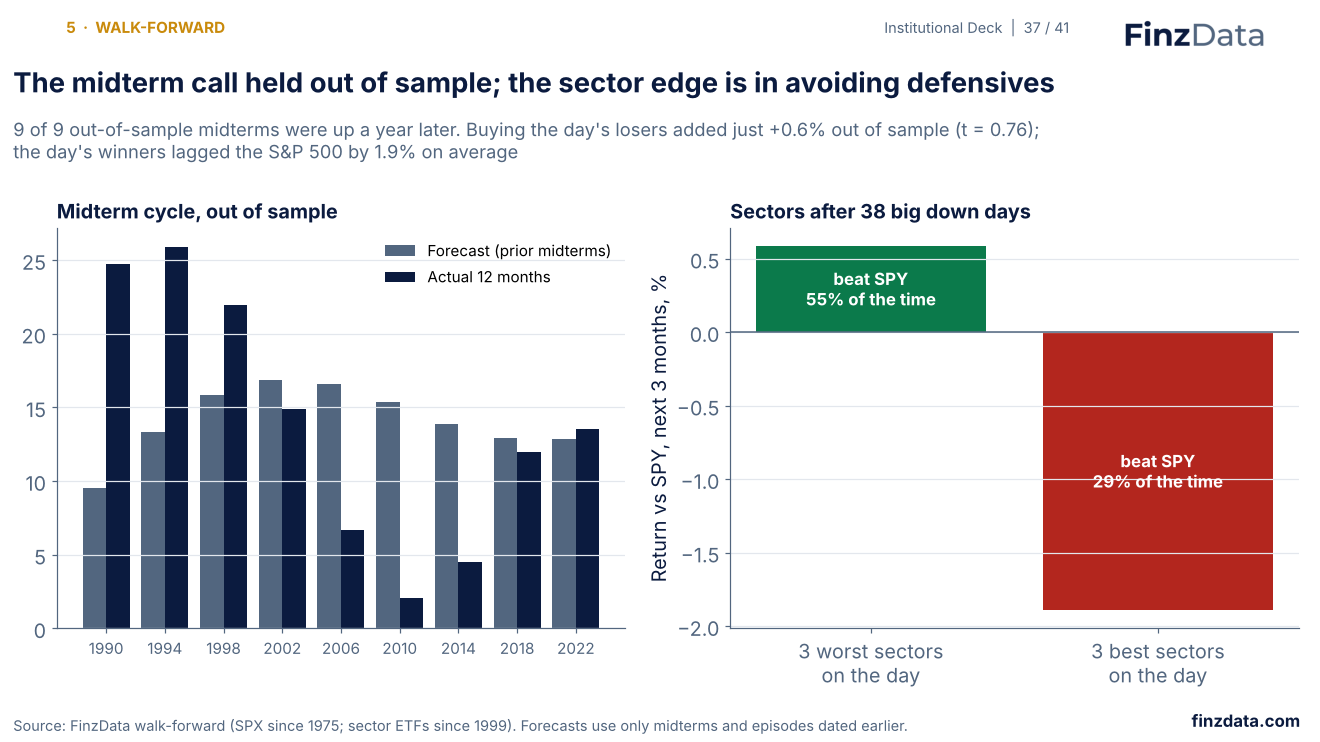
The midterm forecast held in nine of nine out-of-sample cycles. Buying the day's worst sectors added little out of sample; the day's best sectors lagged.
38. Three paths and their signposts
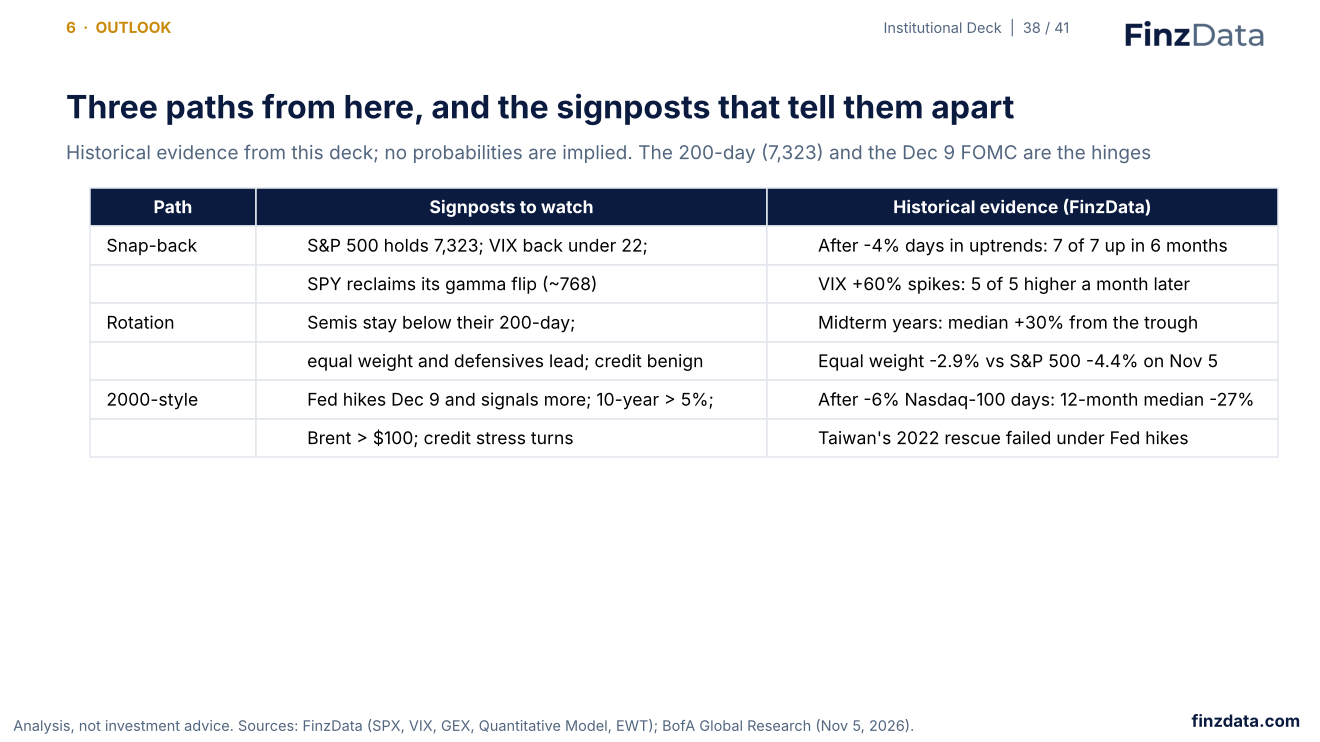
A snap-back if the S&P 500 holds its 200-day (7,323), the VIX falls back under 22 and SPY reclaims its gamma flip; a rotation if semis stay below their 200-day while equal weight and defensives lead; a 2000-style path if the Fed hikes on December 9 and signals more, with the 10-year above 5% and Brent above $100. No probabilities are implied.
39. Our read
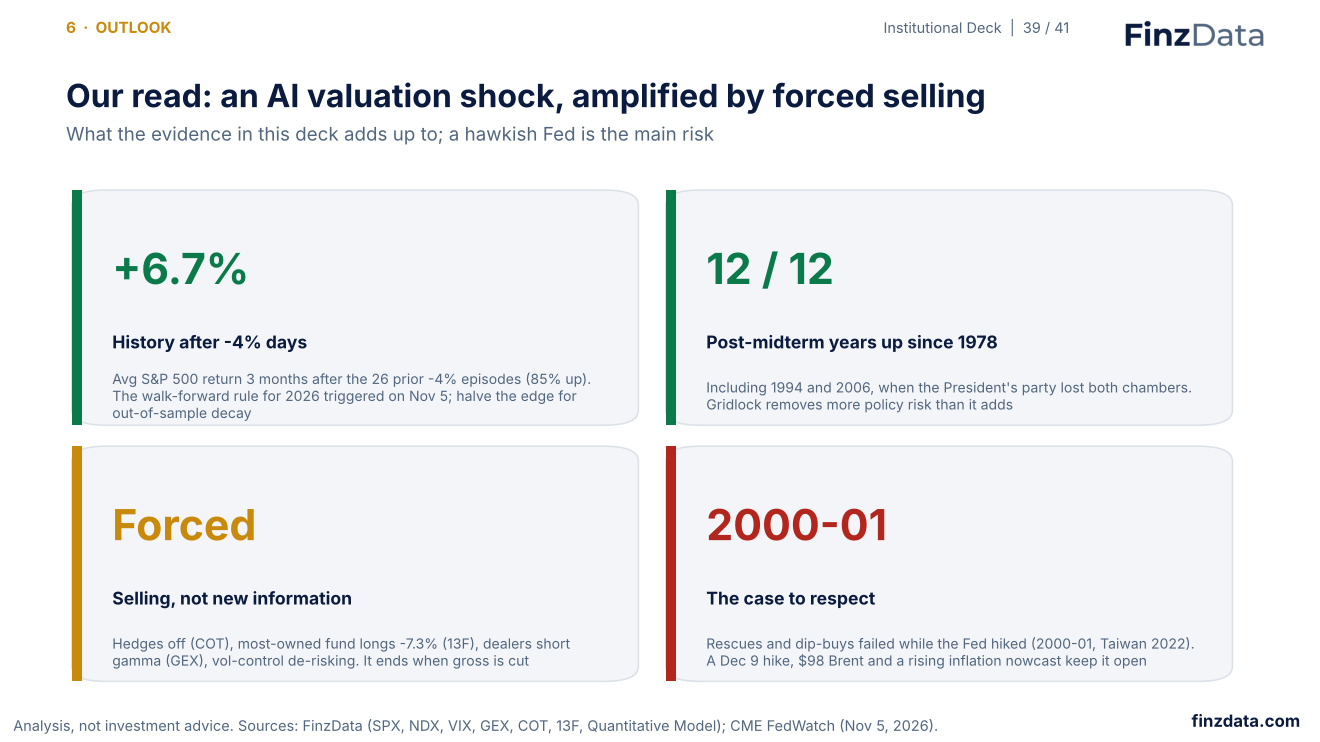
A valuation shock in AI amplified by forced selling: stripped hedges, crowded fund longs, short-gamma dealers and vol-control de-risking. History favors the next three to twelve months, but the cases where rescues and dip-buys failed came while the Fed was hiking. Analysis, not investment advice.
40. What to watch
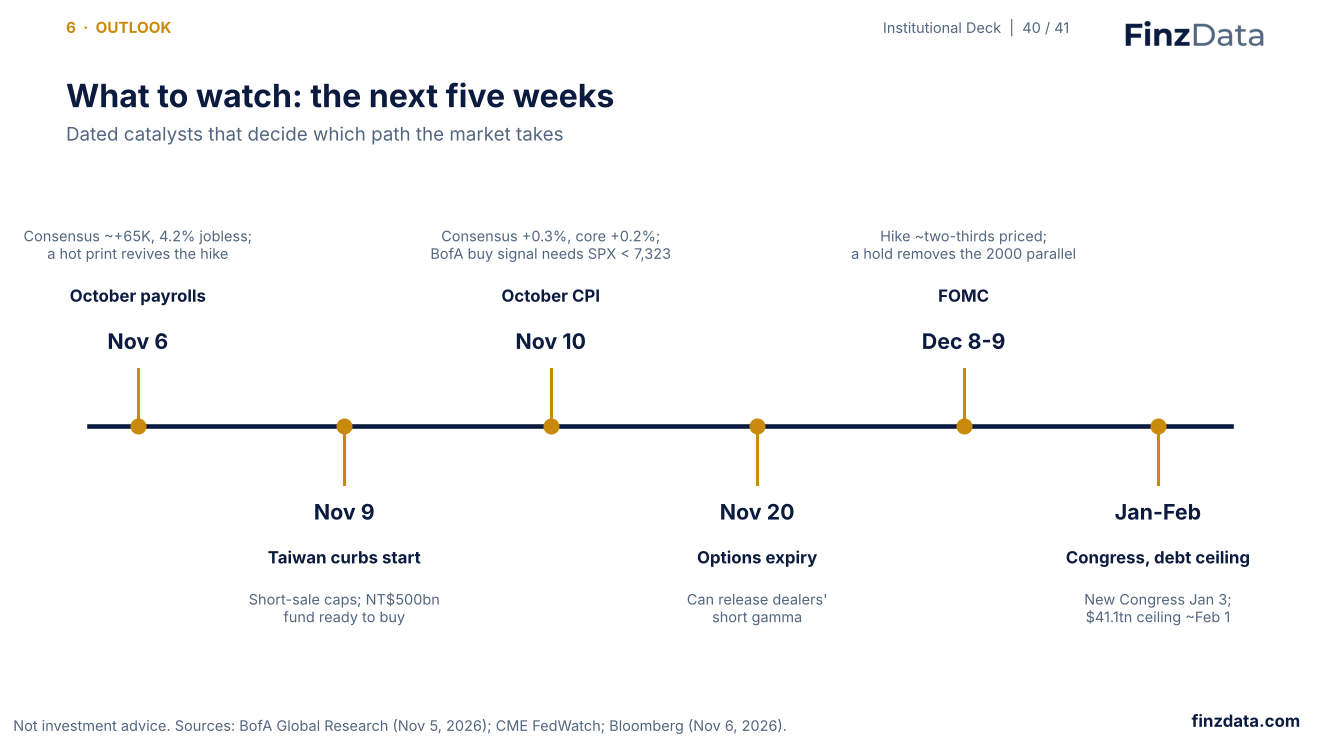
October payrolls (November 6), Taiwan's short-sale curbs (November 9), October CPI (November 10), monthly options expiry (November 20) and the December 8-9 FOMC.
41. The data behind this deck
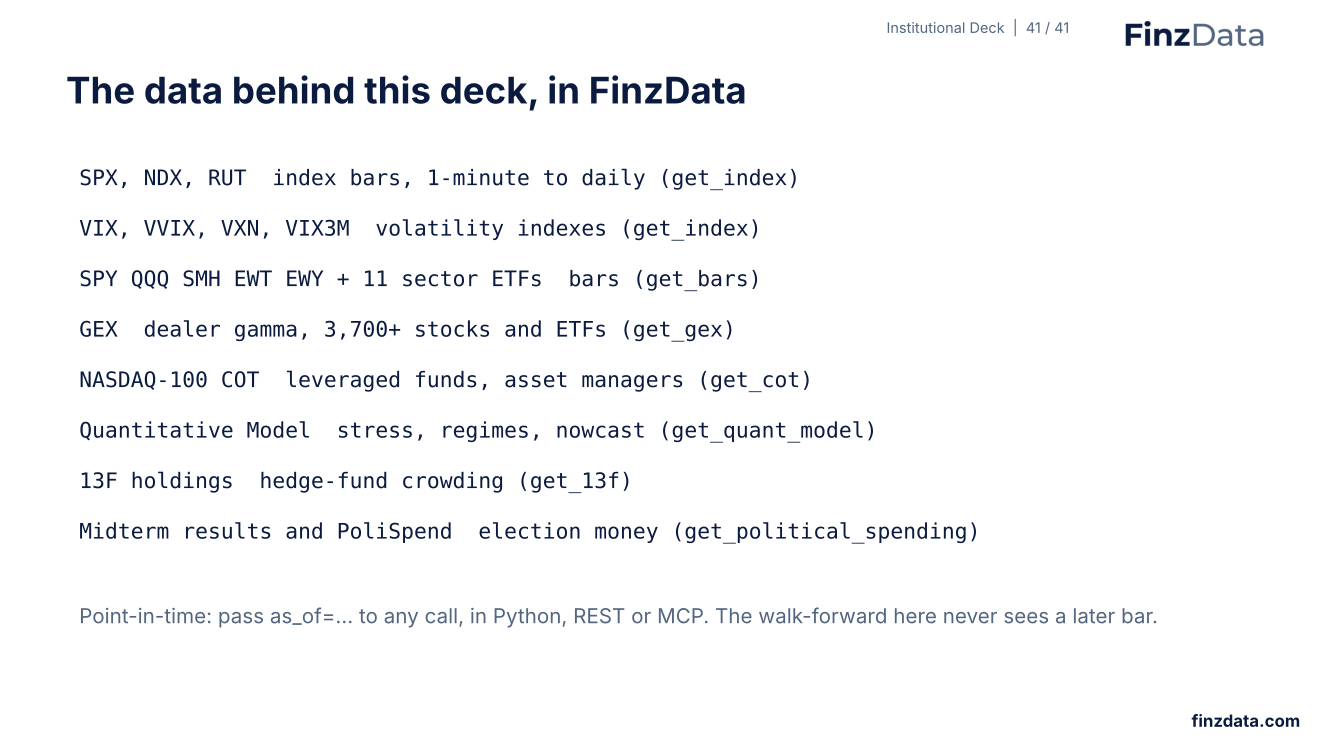
Every chart uses FinzData data: index bars, volatility indexes, ETF bars, GEX, CFTC COT, 13F holdings, the Quantitative Model and election money, all point-in-time through Python, REST or MCP.
Frequently asked questions
Why did the stock market crash on November 5, 2026?
AI and semiconductor stocks led the drop. Democrats won both chambers of Congress on a platform that included limits on new data centers, Qualcomm and Arm disappointed, tanker attacks near Hormuz lifted oil, and markets still priced about a two-in-three chance of a December Fed hike. Forced selling amplified it: hedge funds held crowded AI longs with few index hedges, dealers were short gamma, and volatility-control funds had to cut exposure as volatility doubled.
How much did the stock market fall on November 5, 2026?
The S&P 500 fell 4.36% to 7,353.73, its worst day since April 2025 and the 42nd-worst since 1975. The Nasdaq-100 fell 6.36% to 26,629.81 and the Dow 3.44%. The Financial Times put Wall Street's one-day loss at about $3.2 trillion; Bloomberg reported a record $2.3 trillion erased from tech stocks.
Is the stock market crashing?
The Nasdaq-100 is in a correction, 14.7% below its October 6 peak. The S&P 500 is 5.9% below its record and still 0.4% above its 200-day average, so it is not in a bear market. The FinzData Quantitative Model shows full market stress but benign credit stress; analysts watch credit to tell a correction from a bear market.
Did the AI bubble pop?
Not on this evidence alone. Semiconductors (SMH) fell 11.2% on November 5 and are down 33% from their high, and the best trade of 2026, a semiconductors-energy barbell, is 17% off its peak. But 2027 AI data-center capacity is 75% under construction; the election mainly put 52 of 96 GW of 2028 capacity at risk. History after -6% Nasdaq-100 days is mixed: rebounds were common except in 2000-01, when the Fed was raising rates.
Why are chip stocks down?
Chip stocks fell on fears that new state rules will slow data-center construction after the midterms, weak guidance from Qualcomm and Arm, and crowded positioning: the stocks most widely held by growth hedge funds fell 7.3% on November 5, and SOXL, the 3x semiconductor ETF, fell 38.7%, its worst day since 2010.
Will chip stocks rebound?
History is supportive but not a guarantee. After S&P 500 drops of 3% or more since 1999, semiconductors beat the index by 3.6% on average over the next three months. When SMH fell 15-25% below its 200-day average, its 12-month median return was positive, but a further fall usually came first. This is analysis, not investment advice.
Will the stock market recover?
After S&P 500 drops of 4% or more since 1975, the median return three months later was +6.6%, positive 85% of the time, and all seven drops that came in an uptrend were higher six months later. The S&P 500 also rose in the 12 months after all 12 midterms since 1978. The risk case is a Fed that keeps hiking, as in 2000-01.
What happened to the VIX, SOXL and Nasdaq leveraged ETFs?
The VIX jumped 69.7% to 28.18, its third-largest one-day rise since 1990, and the VVIX rose 49.3%. SOXL fell 38.7%. Cboe recorded a record 11.23 million put contracts as investors bought protection.
How does the stock market do after midterm elections?
The S&P 500 rose in the 12 months after all 12 midterms from 1978 to 2022, by 12.9% on average, including 1994 and 2006, when the President's party lost both chambers.
Where does the data in this report come from?
FinzData: index and ETF bars, VIX and VVIX, point-in-time GEX, CFTC COT, 13F holdings, the FinzData Quantitative Model and election-spending data. Cited research is listed on each slide.
Download the deck (PDF, 41 slides) More research
Related research: Midterm Money: Sweep or Split · Midterm Money: The Results · SPY gamma regimes · FinzData GEX
Built for AI, quants, data scientists and financial analysts who backtest. Clean data. Real insights. Real alpha. finzdata.com. This material is for information only and is not investment advice. Data sources: FinzData index, ETF, GEX, COT, 13F and Quantitative Model data; Cboe; CappNotes; Bloomberg; The Wall Street Journal; Morgan Stanley; Goldman Sachs; J.P. Morgan; BofA Global Research; Nomura; Tier1Alpha.
Get FinzData research free, every morning
The daily brief: what moved, the macro releases that matter, positioning and liquidity, with charts. One email a day, free, unsubscribe anytime.
Topics and related searches
Equity strategy and factors Semiconductors and AI supply chain AI infrastructure and data-center capex Options, gamma and GEX Volatility 13F institutional holdings Elections and political spending Quant models and market regimes Federal Reserve and monetary policy Asian economies and markets Backtesting and research integrity
People also search
- why did the stock market crash today
- what happened to the stock market today
- did the ai bubble just pop
- will chip stocks rebound
- will the stock market recover
- how much money was lost in the stock market today
- why are chip stocks down
- is the stock market crashing
- why did the stock market drop so much today
- why did the stock market crash on november 5 2026
- what happens after the s&p 500 falls 4%
- should i buy the dip after a 4% drop