
FinzData Research · Published 19 October 2026
SPY in short-gamma vs long-gamma regimes
We split every SPY session since October 2019 by the sign of dealer gamma at the close, using only what was known before the next session opened, and measured what happened next. Moves after short-gamma closes were about twice as large.
Get FinzData research free, every morning
The daily brief: what moved, the macro releases that matter, positioning and liquidity, with charts. One email a day, free, unsubscribe anytime.
Contents
- Next-day moves were about twice as large after short-gamma closes
- Realized volatility over the next week followed the same split
- Short-gamma days have fatter tails on both sides
- Frequently asked questions
1. Dealer gamma after every close since October 2019
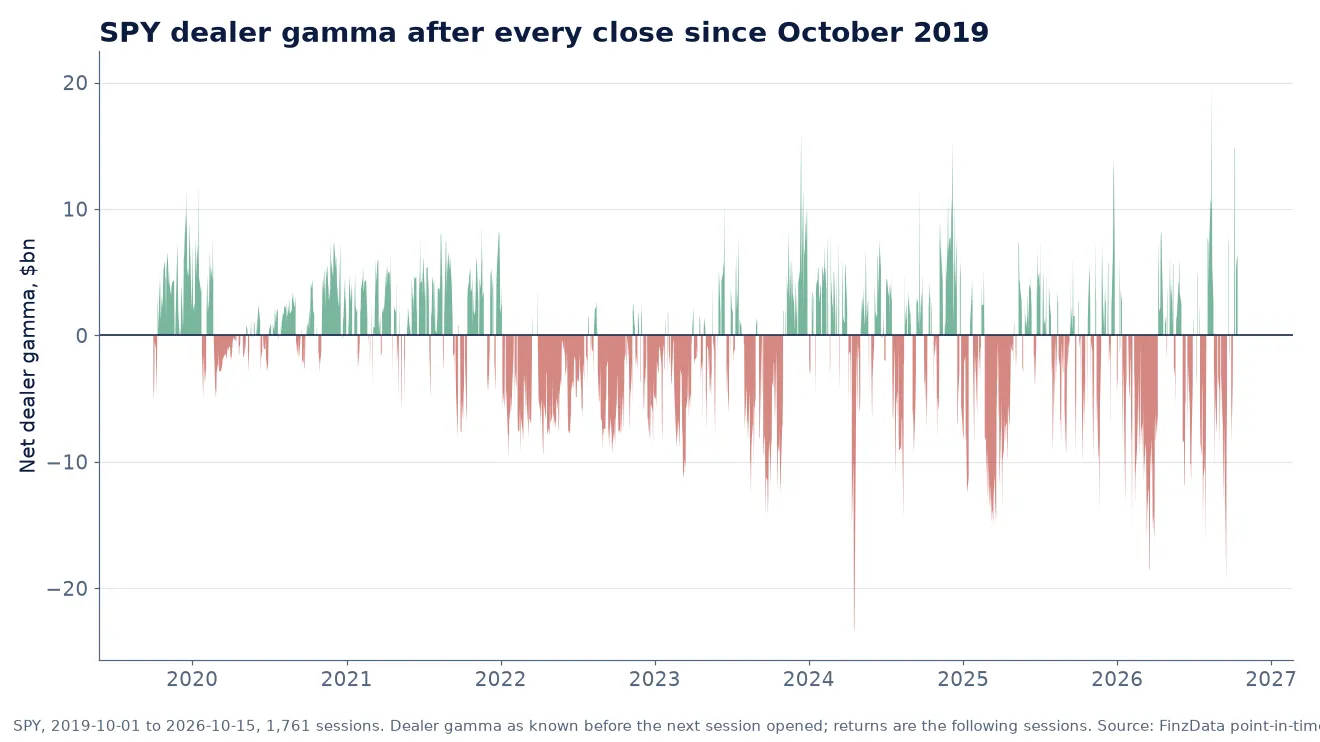
Net dealer gamma for SPY at each close, in billions. Green: dealers long gamma. Red: dealers short gamma.
Dealer gamma exposure (GEX) adds up the gamma of every listed SPY option out to 90 days, with calls counted positive and puts negative from the dealer side. When the total is positive, dealers are long gamma; when it is negative, they are short gamma. Of the 1,761 sessions from 2019-10-01 to 2026-10-15, 816 closed long gamma and 945 closed short gamma.
Every value here is point-in-time: it is what could be computed from the option chain at that close, stamped with when it became known (17:00 New York time for the history), with no later revisions. That is what makes the next-day comparison fair.
2. Next-day moves were about twice as large after short-gamma closes
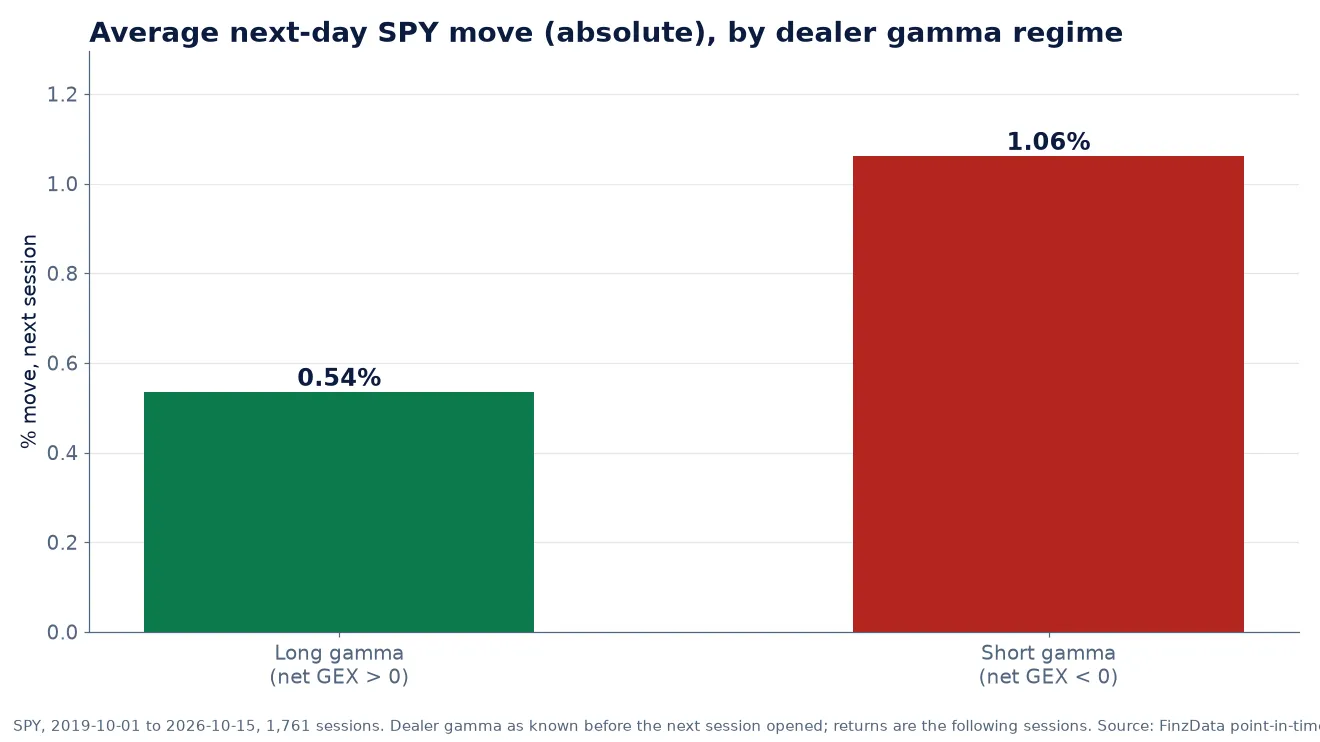
Average absolute SPY return on the next session, by dealer gamma regime at the prior close.
After a long-gamma close, SPY moved 0.54% on average the next session, up or down. After a short-gamma close it moved 1.06%, a ratio of 1.98. A Welch t-test on the size of the move gives t = 12.8, so the gap is far larger than chance would produce over this many sessions.
Direction is a different story. SPY rose on 55.8% of sessions after long-gamma closes and 54.1% after short-gamma closes, and the average next-day return was slightly positive in both regimes (0.04% and 0.07%). Dealer gamma told you how much SPY was likely to move, not which way.
3. Realized volatility over the next week followed the same split
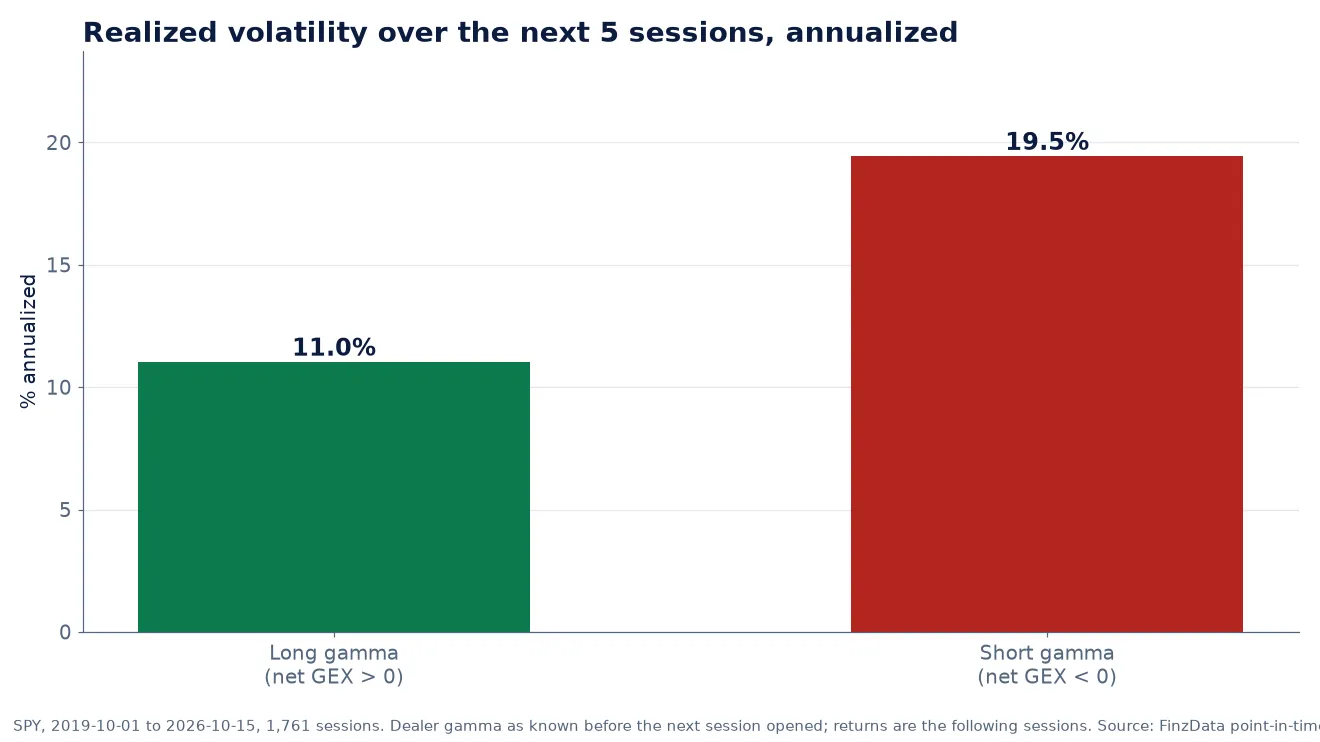
Annualized standard deviation of SPY's daily returns over the five sessions after each close.
The effect was not a one-day blip. Realized volatility over the following five sessions averaged 11.0% annualized after long-gamma closes and 19.5% after short-gamma closes. The average worst point within those five sessions was a 0.73% drawdown after long-gamma closes and 1.18% after short-gamma closes.
4. Short-gamma days have fatter tails on both sides
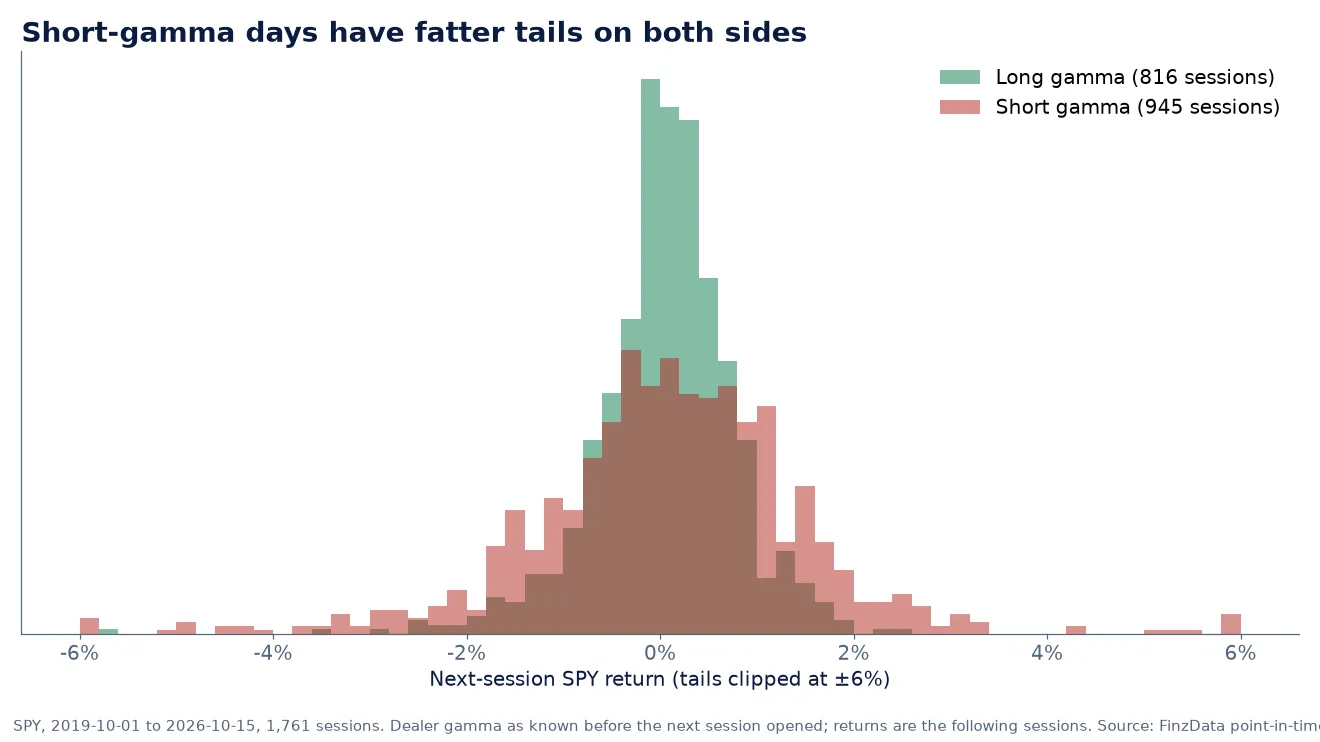
Distribution of next-session SPY returns by regime (tails clipped at plus or minus 6% for display).
Long-gamma sessions cluster tightly around zero. Short-gamma sessions spread out in both directions. The worst next-day return after a long-gamma close was minus 5.8%; after a short-gamma close it was minus 10.9%, in March 2020. In 94.8% of short-gamma sessions SPY was also trading below its gamma flip.
| Measure | Long gamma | Short gamma |
|---|---|---|
| Sessions | 816 | 945 |
| Average next-day move (absolute) | 0.54% | 1.06% |
| Average next-day return | 0.04% | 0.07% |
| Share of up days | 55.8% | 54.1% |
| Next-5-day realized volatility | 11.0% | 19.5% |
| Average worst point, next 5 days | -0.73% | -1.18% |
| Worst next-day return | -5.8% | -10.9% |
Method: regime from the sign of net dealer gamma at the close of day t; returns from SPY closes on t+1 to t+5; no parameters were fitted. Data: FinzData point-in-time GEX and daily prices. Past behavior does not guarantee future results, and this is not investment advice.
The full history is available through the point-in-time GEX data API.
Frequently asked questions
What does it mean when dealers are short gamma?
Options dealers' combined gamma is negative, so their hedging tends to add to price moves rather than offset them. In this study, SPY's next-day moves were about twice as large after short-gamma closes.
Does short gamma predict whether SPY goes up or down?
Not in this sample. SPY rose on 54.1% of sessions after short-gamma closes and 55.8% after long-gamma closes. Dealer gamma was informative about the size of moves, not their direction.
Where does the GEX data come from?
FinzData's point-in-time GEX history: dealer gamma computed from each session's closing option chain and stamped with when it became known, covering 8,755 US stocks and ETFs since October 2019.
Can I reproduce this study?
Yes. Pull SPY GEX with the Python client (yf.gex) or the /v1/gex/daily endpoint, join it with next-session SPY returns, and split by the sign of net_gex_bn.
Download the deck (PDF, 4 slides) More research
Built for AI, quants, data scientists and financial analysts who backtest. Clean data. Real insights. Real alpha. finzdata.com. This material is for information only and is not investment advice. Data sources: FinzData point-in-time GEX (net dealer gamma, gamma flip) and daily prices, SPY, 2019-10-01 to 2026-10-15.
Get FinzData research free, every morning
The daily brief: what moved, the macro releases that matter, positioning and liquidity, with charts. One email a day, free, unsubscribe anytime.
Topics and related searches
Options, gamma and GEX Volatility Quant models and market regimes Equity strategy and factors
People also search
- what does short gamma mean for spy
- why are spy moves larger after short gamma
- will spy move more after short gamma close
- how to calculate dealer gamma for spy
- is spy gamma predictive of direction
- can short gamma predict spy volatility
- does dealer gamma affect next day spy returns
- when does spy gamma flip occur
- how to reproduce spy gamma study
- spy gamma exposure data by day
- spy gex history 2019 to 2026
- download spy gamma exposure csv