
FinzData Research · Published 4 November 2026
Midterm Money: Divided Government
A Democratic Congress, a Republican President, and what it means for policy, sectors and markets. 57 slides: the results and the money, policy consequences, the Street's playbook, market history and positioning, and a trade map.
Get FinzData research free, every morning
The daily brief: what moved, the macro releases that matter, positioning and liquidity, with charts. One email a day, free, unsubscribe anytime.
Contents
- Key takeaways
- Contents
- The results and the money
- Democrats hold at least 54 Senate and 228 House seats
- Battleground Senate money: candidates vs outside groups
- The bigger campaign won 12 of 13; outside money, 5 of 13
- 64% of outside money paid to attack a candidate
- The biggest Republican super PACs lost their marquee races
- Maine and Iowa were paid for mostly from out of state
- Senate outside money topped candidate money in 2026
- So far in 2026, fundraising costs topped TV spending
- For 2028: outside money is now 43% of the total
- 02
- Who controls what: sweep vs split Congress
- Policy scorecard: what changes with a Democratic Senate
- The fiscal calendar: three cliffs inside 14 months
- Tariffs: the courts moved them, Congress will not
- Healthcare: ACA credits can pass in 2027; drug pricing unites
- AI power: the fight is over who pays the bill
- Texas: the governor, the PUC and the data-center bill
- Texas utilities: who owns the wires
- Tech and crypto: courts set antitrust, the Senate sets crypto
- Defense: the $1.5T request loses its $350B leg
- Oversight: subpoenas certain, conviction out of reach
- Split Congresses pass the fewest laws; output keeps falling
- What would change the picture
- The Street's playbook
- Goldman's sweep book: long the grid, short pharma
- Goldman: AI power, healthcare, and government vs defense
- Goldman: Wall Street meets Washington, housing, taxes
- $33B
- Earnings rose, multiples fell: AI hardware de-rated most
- Rubner: the midterm calendar and the vol reset favor buyers
- Where the Street agrees, and where it splits
- Day one beat JPM's blue-wave range
- JPMorgan's scenario map: AI, deficits and probes
- Checking Goldman's baskets against the example stocks
- Markets: history, cross-asset and positioning
- S&P 500 rose 12 months after all 20 midterms since 1946
- Sector ETFs 12 months after each midterm
- 2006 sweep: defense, energy, materials led; housing lagged
- Treasury yields: no consistent post-midterm direction
- Dollar mixed, gold higher in 5 of 6 midterms since 2002
- Volatility: VIX usually eases after Election Day
- Nov-Apr after midterms: up in 19 of 20 since 1946
- Dealers went into the vote short gamma
- Futures positioning: asset managers long, levered funds short
- 2026 leadership and the first post-election move
- What history says, and how much to trust it
- The playbook: sweep vs split
- Trade map: what the sweep changes, theme by theme
- Day one vs the 2006 sweep: the market is not trading history
- What could go wrong
- The calendar to watch
- The data behind this deck
- Methodology and disclosures
- Frequently asked questions
1. Midterm Money: Divided Government
A Democratic Congress, a Republican President, and what it means for policy, sectors and markets
2. Key takeaways
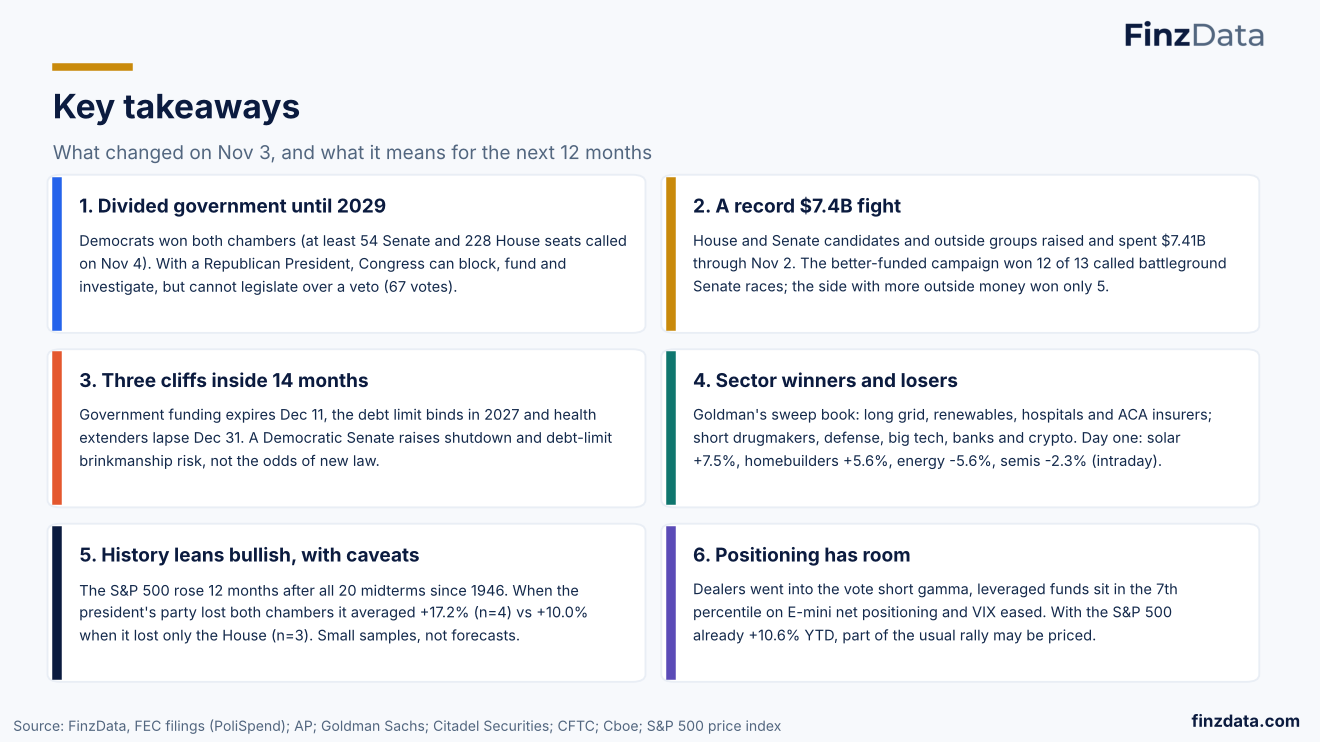
What changed on Nov 3, and what it means for the next 12 months
3. Contents
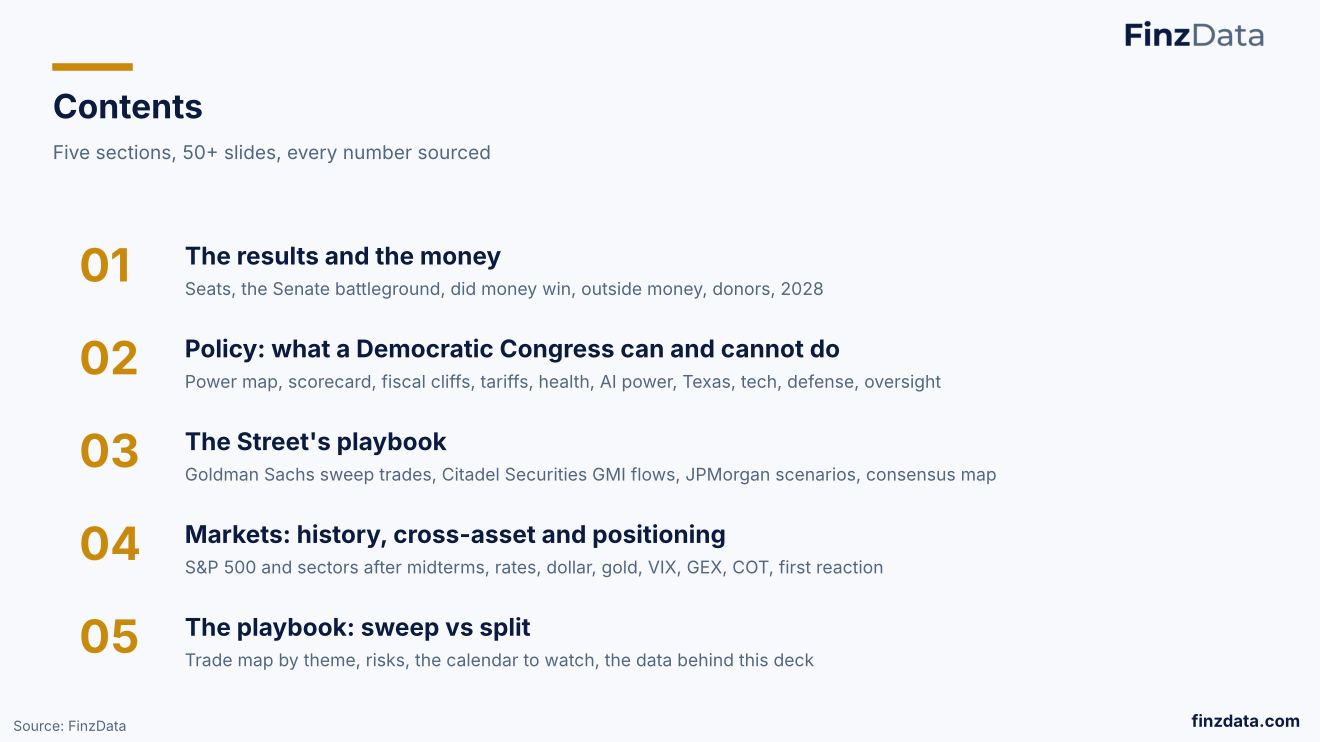
Five sections, 50+ slides, every number sourced
4. The results and the money
Democrats won both chambers in the most expensive midterm on record. What $7.41B of FEC-reported money bought, and what it did not.
5. Democrats hold at least 54 Senate and 228 House seats
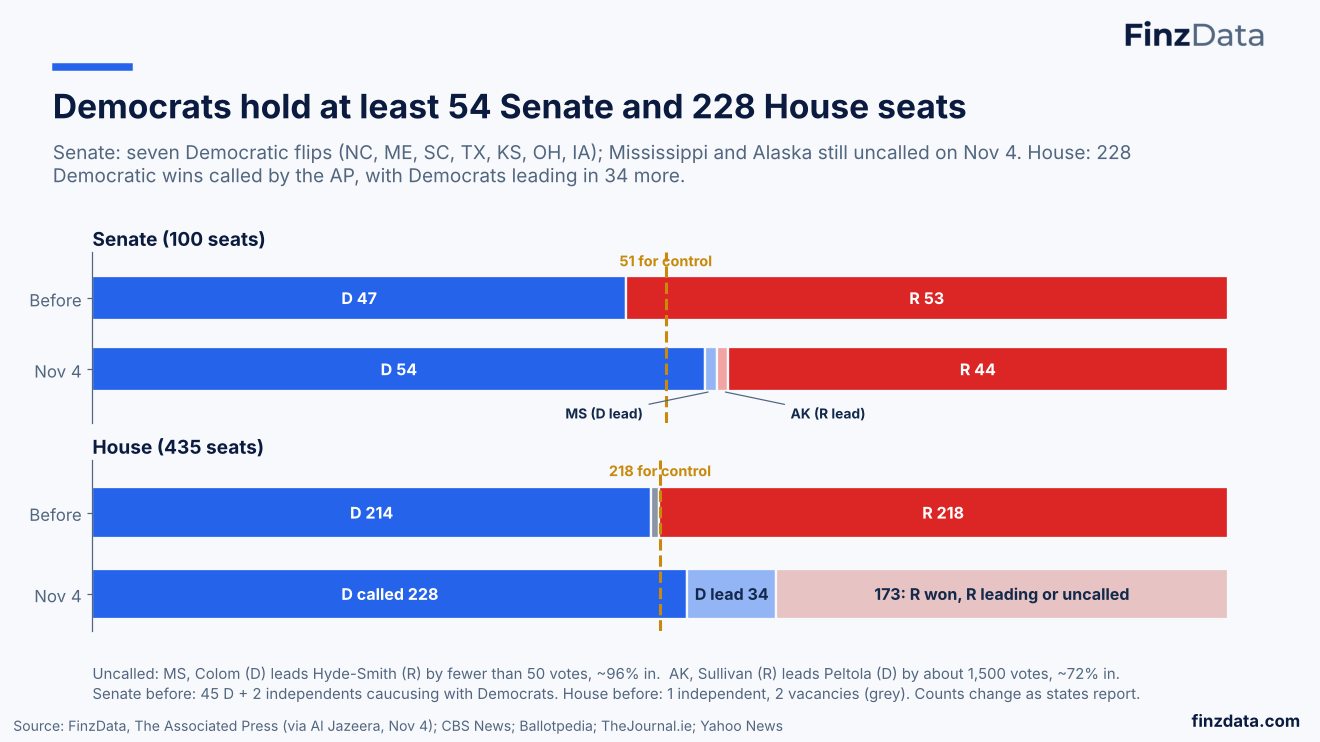
Senate: seven Democratic flips (NC, ME, SC, TX, KS, OH, IA); Mississippi and Alaska still uncalled on Nov 4. House: 228 Democratic wins called by the AP, with Democrats leading in 34 more.
6. Battleground Senate money: candidates vs outside groups
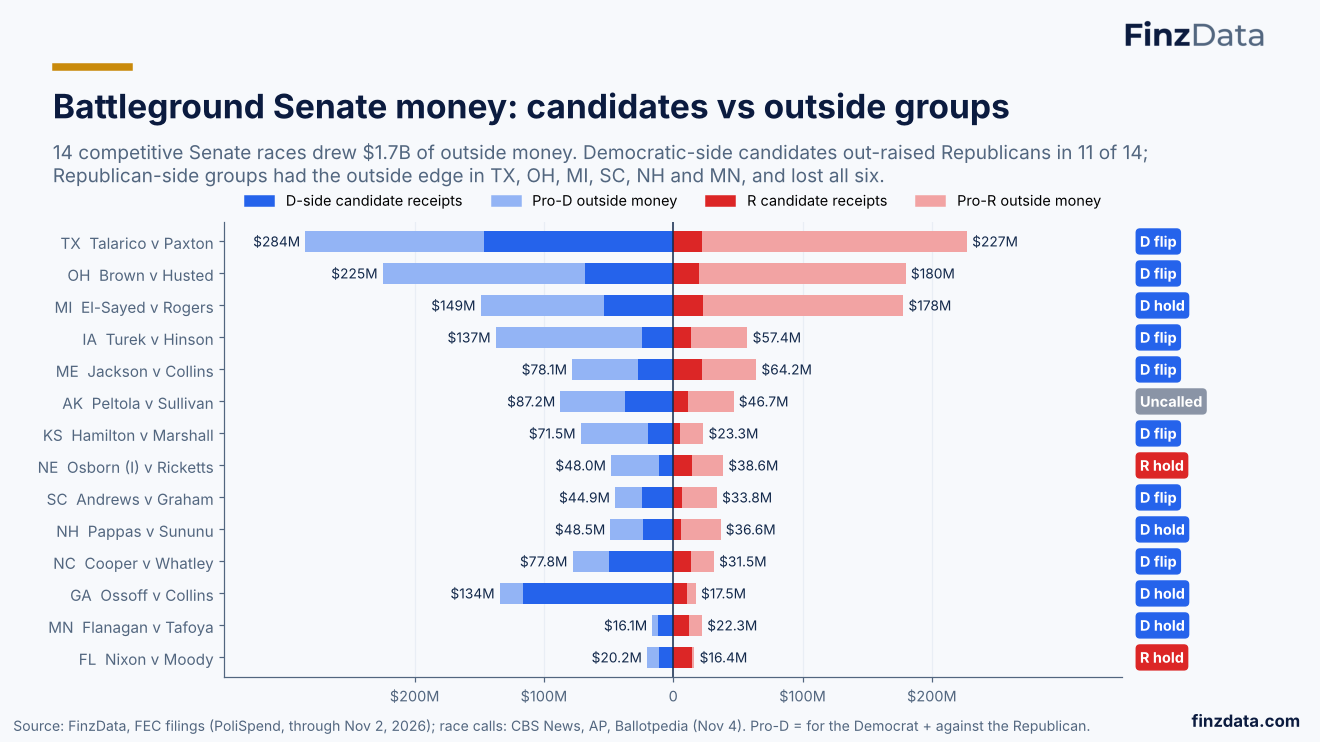
14 competitive Senate races drew $1.7B of outside money. Democratic-side candidates out-raised Republicans in 11 of 14; Republican-side groups had the outside edge in TX, OH, MI, SC, NH and MN, and lost all six.
7. The bigger campaign won 12 of 13; outside money, 5 of 13
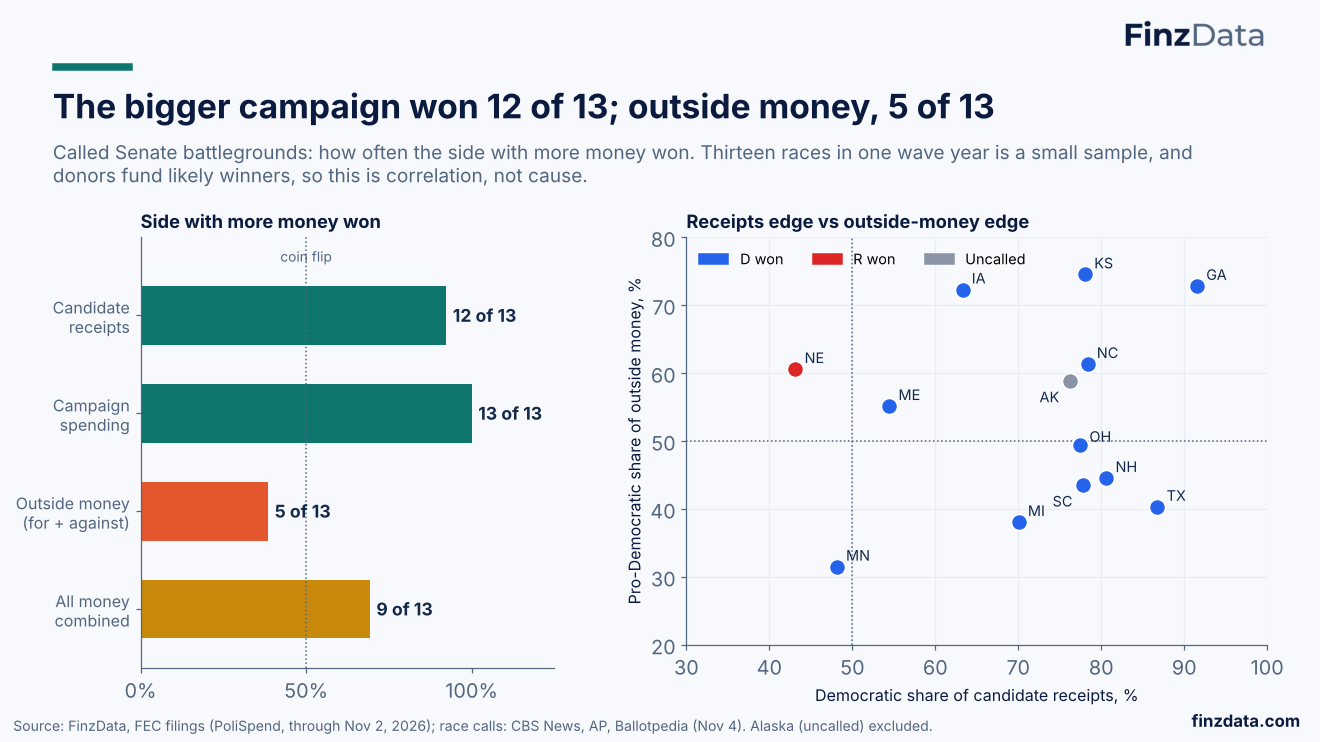
Called Senate battlegrounds: how often the side with more money won. Thirteen races in one wave year is a small sample, and donors fund likely winners, so this is correlation, not cause.
8. 64% of outside money paid to attack a candidate
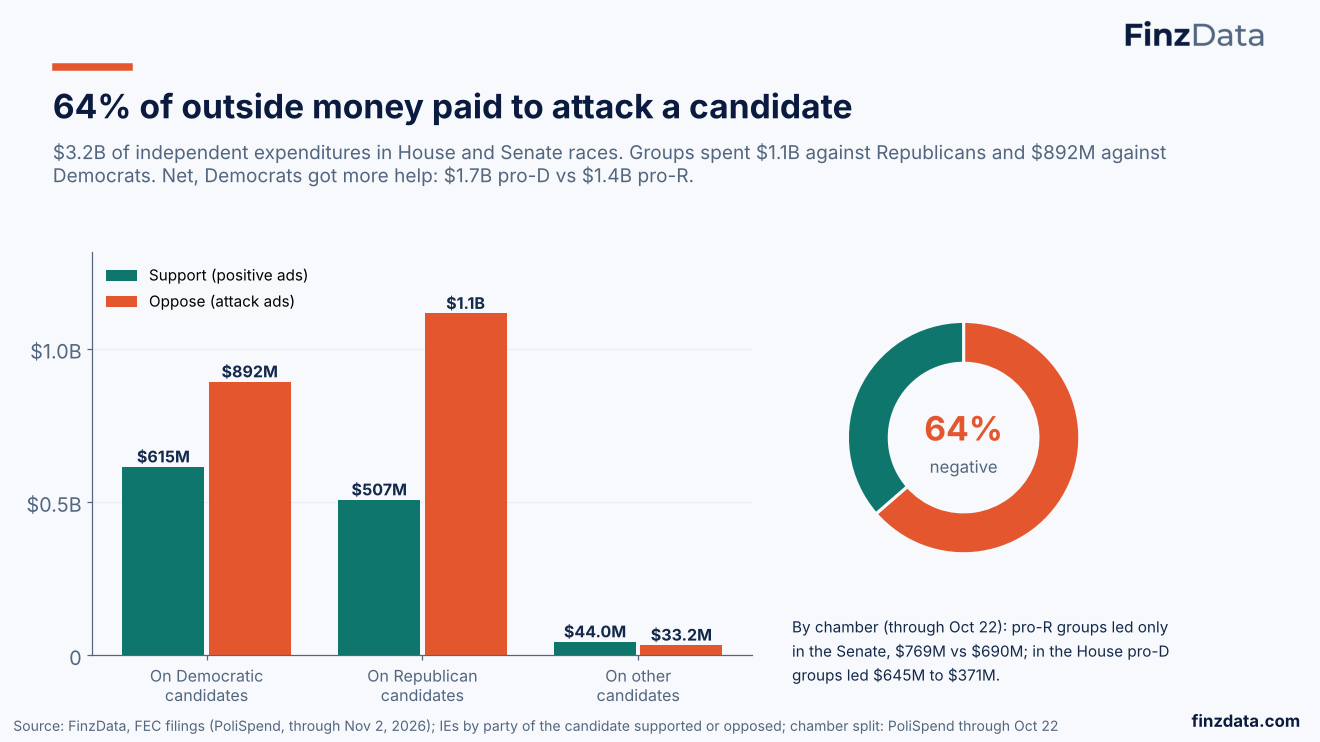
$3.2B of independent expenditures in House and Senate races. Groups spent $1.1B against Republicans and $892M against Democrats. Net, Democrats got more help: $1.7B pro-D vs $1.4B pro-R.
9. The biggest Republican super PACs lost their marquee races
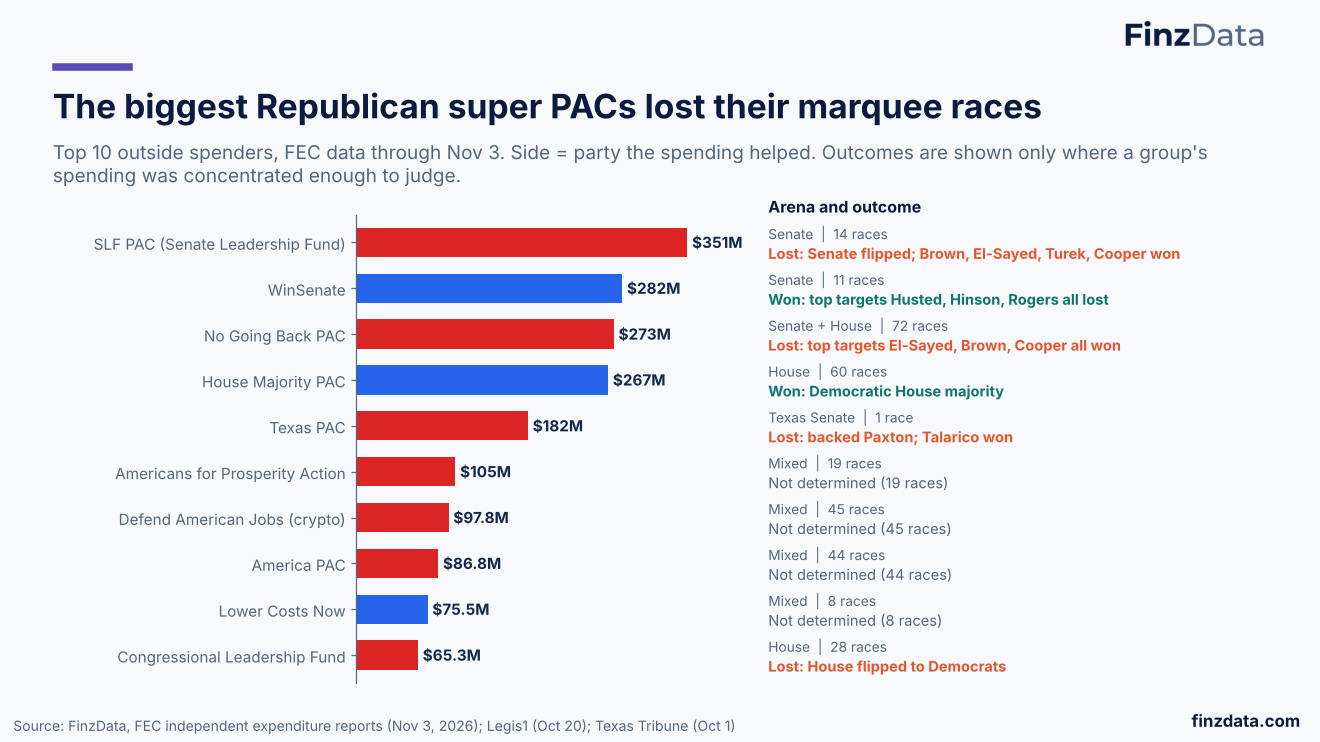
Top 10 outside spenders, FEC data through Nov 3. Side = party the spending helped. Outcomes are shown only where a group's spending was concentrated enough to judge.
10. Maine and Iowa were paid for mostly from out of state
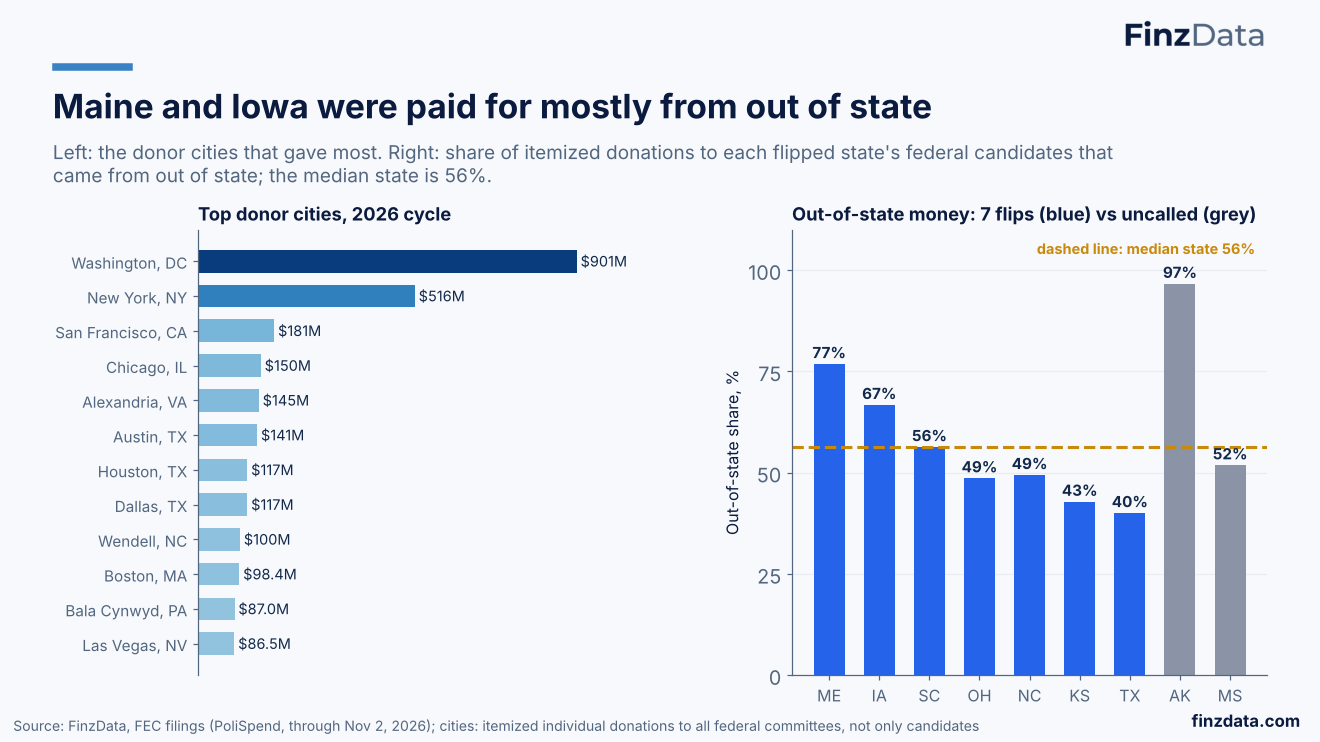
Left: the donor cities that gave most. Right: share of itemized donations to each flipped state's federal candidates that came from out of state; the median state is 56%.
11. Senate outside money topped candidate money in 2026
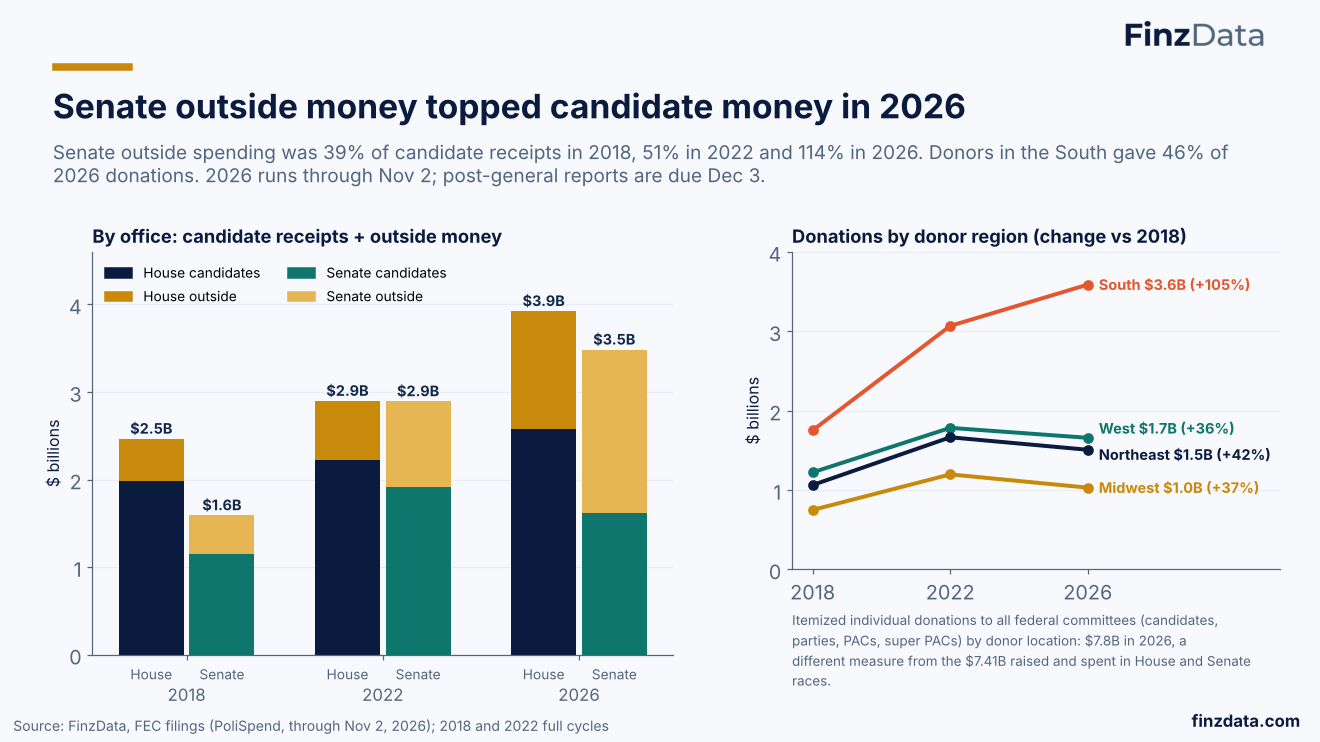
Senate outside spending was 39% of candidate receipts in 2018, 51% in 2022 and 114% in 2026. Donors in the South gave 46% of 2026 donations. 2026 runs through Nov 2; post-general reports are due Dec 3.
12. So far in 2026, fundraising costs topped TV spending
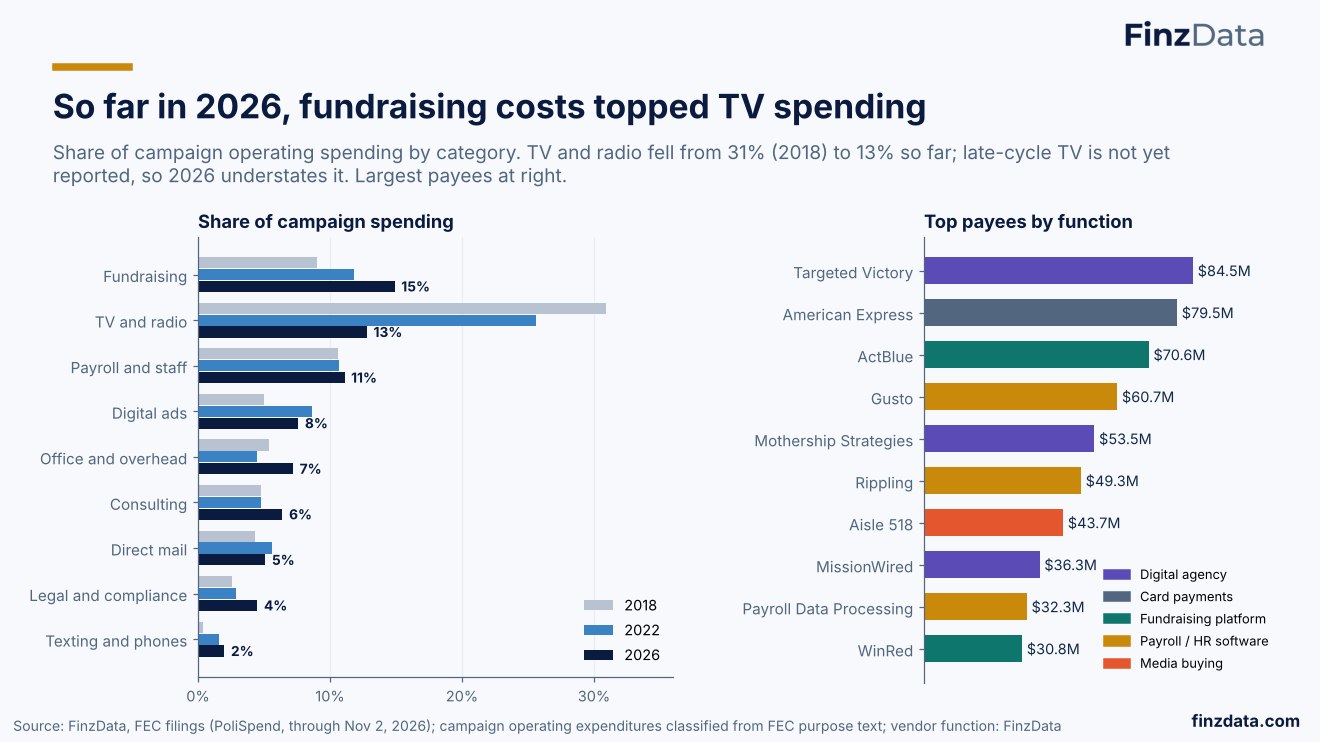
Share of campaign operating spending by category. TV and radio fell from 31% (2018) to 13% so far; late-cycle TV is not yet reported, so 2026 understates it. Largest payees at right.
13. For 2028: outside money is now 43% of the total
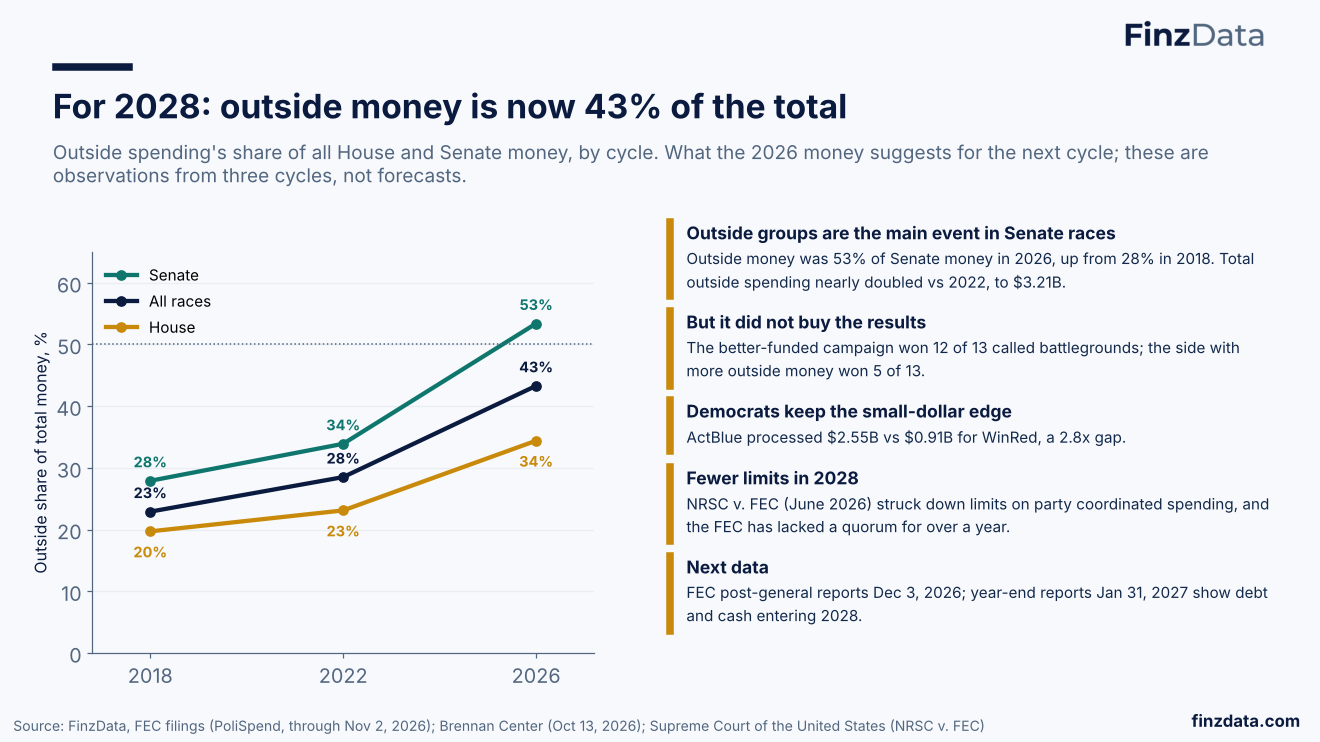
Outside spending's share of all House and Senate money, by cycle. What the 2026 money suggests for the next cycle; these are observations from three cycles, not forecasts.
14. 02
Sweep vs split under President Trump: the power of the purse, the subpoena and the Senate calendar, but not the veto
15. Who controls what: sweep vs split Congress
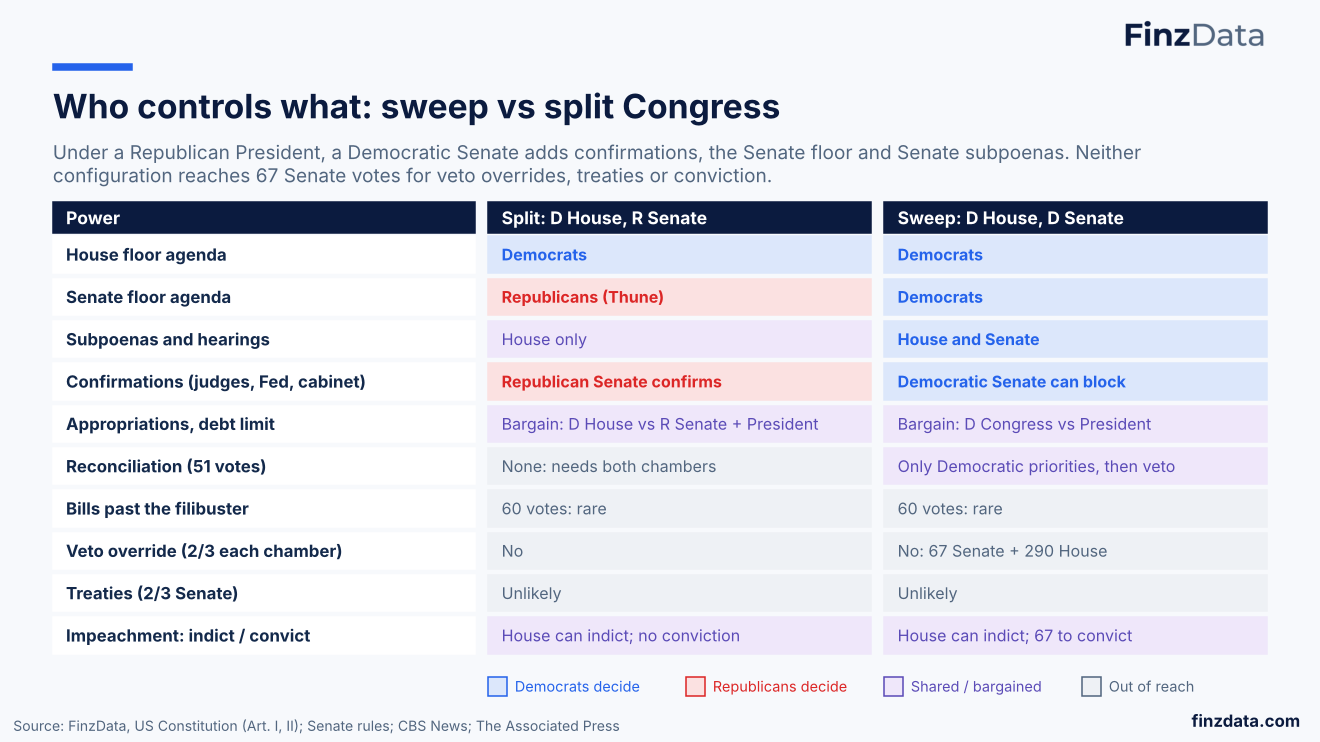
Under a Republican President, a Democratic Senate adds confirmations, the Senate floor and Senate subpoenas. Neither configuration reaches 67 Senate votes for veto overrides, treaties or conviction.
16. Policy scorecard: what changes with a Democratic Senate
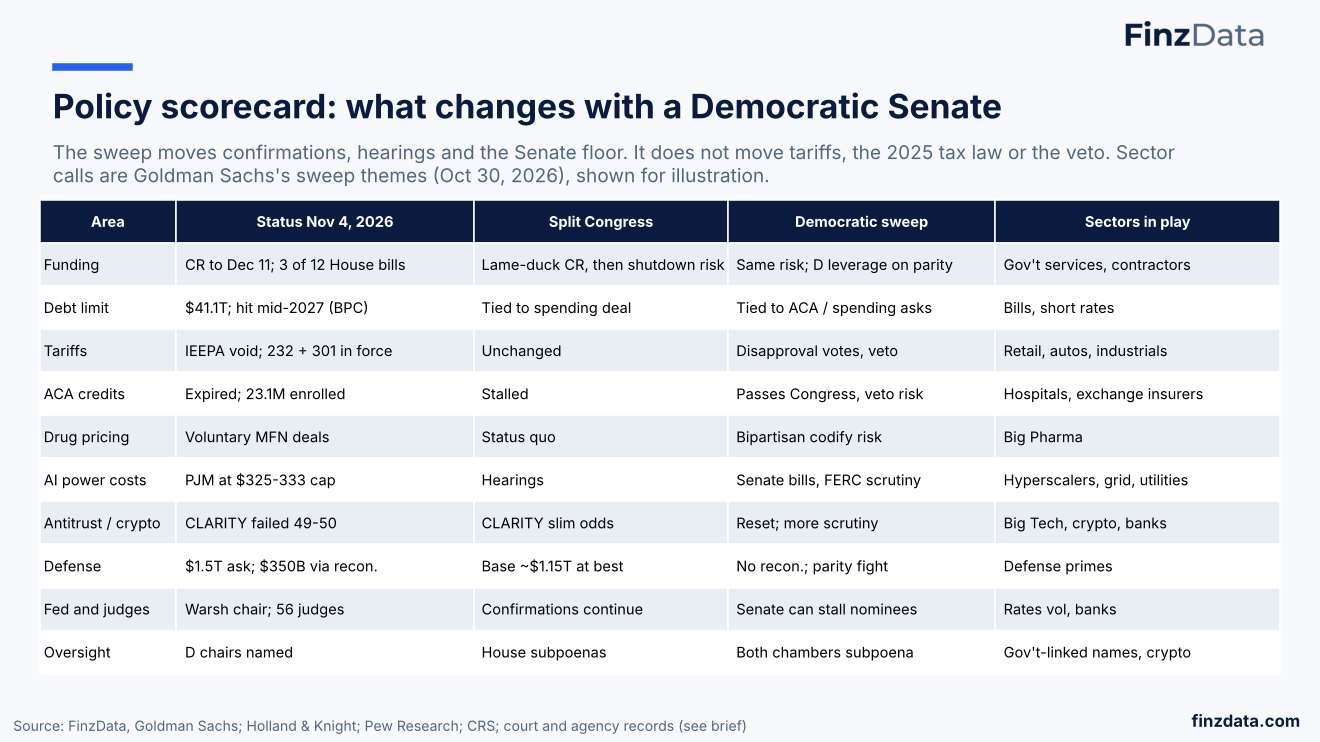
The sweep moves confirmations, hearings and the Senate floor. It does not move tariffs, the 2025 tax law or the veto. Sector calls are Goldman Sachs's sweep themes (Oct 30, 2026), shown for illustration.
17. The fiscal calendar: three cliffs inside 14 months
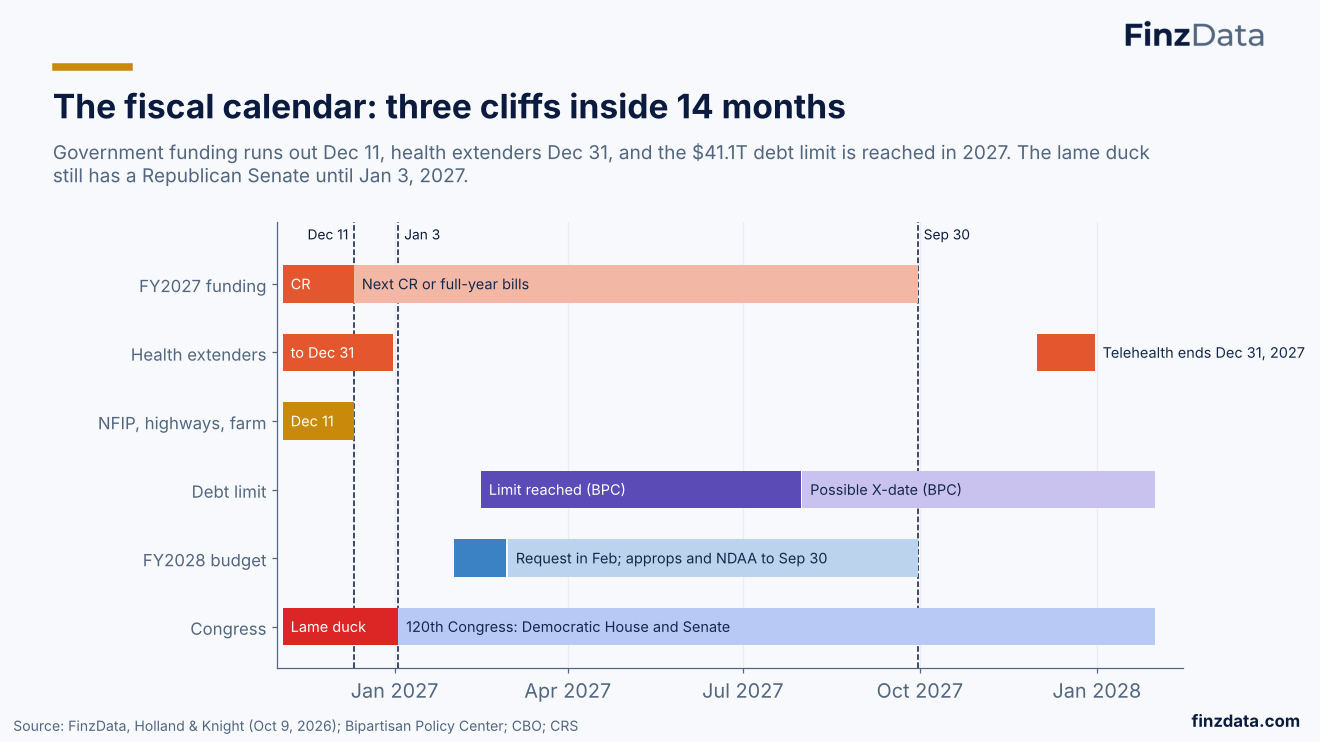
Government funding runs out Dec 11, health extenders Dec 31, and the $41.1T debt limit is reached in 2027. The lame duck still has a Republican Senate until Jan 3, 2027.
18. Tariffs: the courts moved them, Congress will not
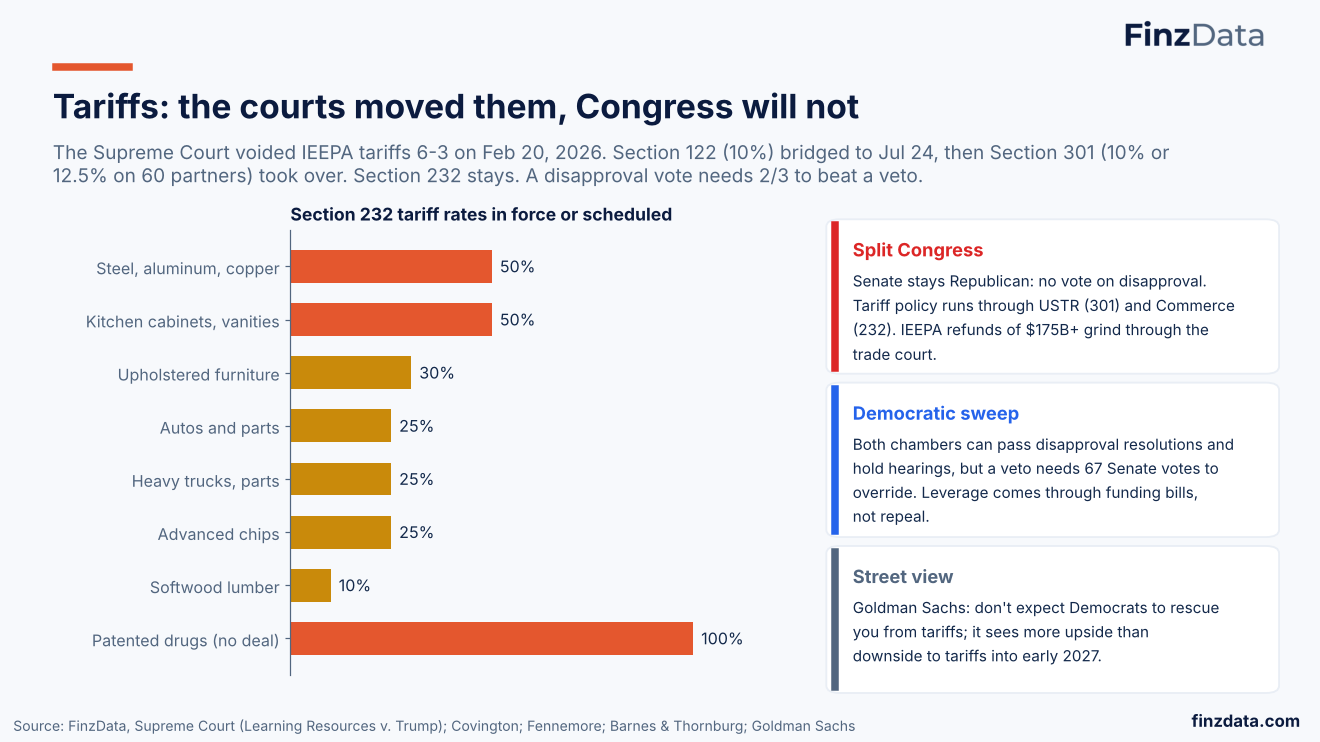
The Supreme Court voided IEEPA tariffs 6-3 on Feb 20, 2026. Section 122 (10%) bridged to Jul 24, then Section 301 (10% or 12.5% on 60 partners) took over. Section 232 stays. A disapproval vote needs 2/3 to beat a veto.
19. Healthcare: ACA credits can pass in 2027; drug pricing unites
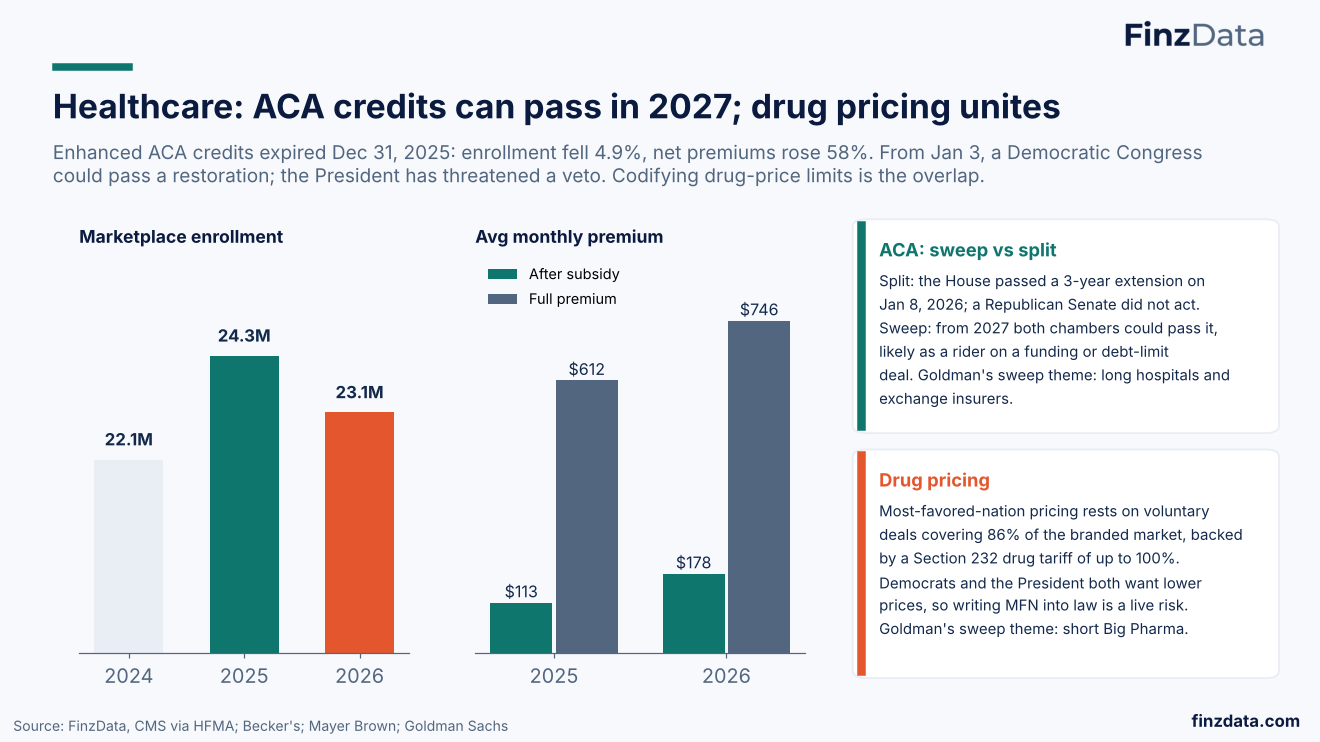
Enhanced ACA credits expired Dec 31, 2025: enrollment fell 4.9%, net premiums rose 58%. From Jan 3, a Democratic Congress could pass a restoration; the President has threatened a veto. Codifying drug-price limits is the overlap.
20. AI power: the fight is over who pays the bill
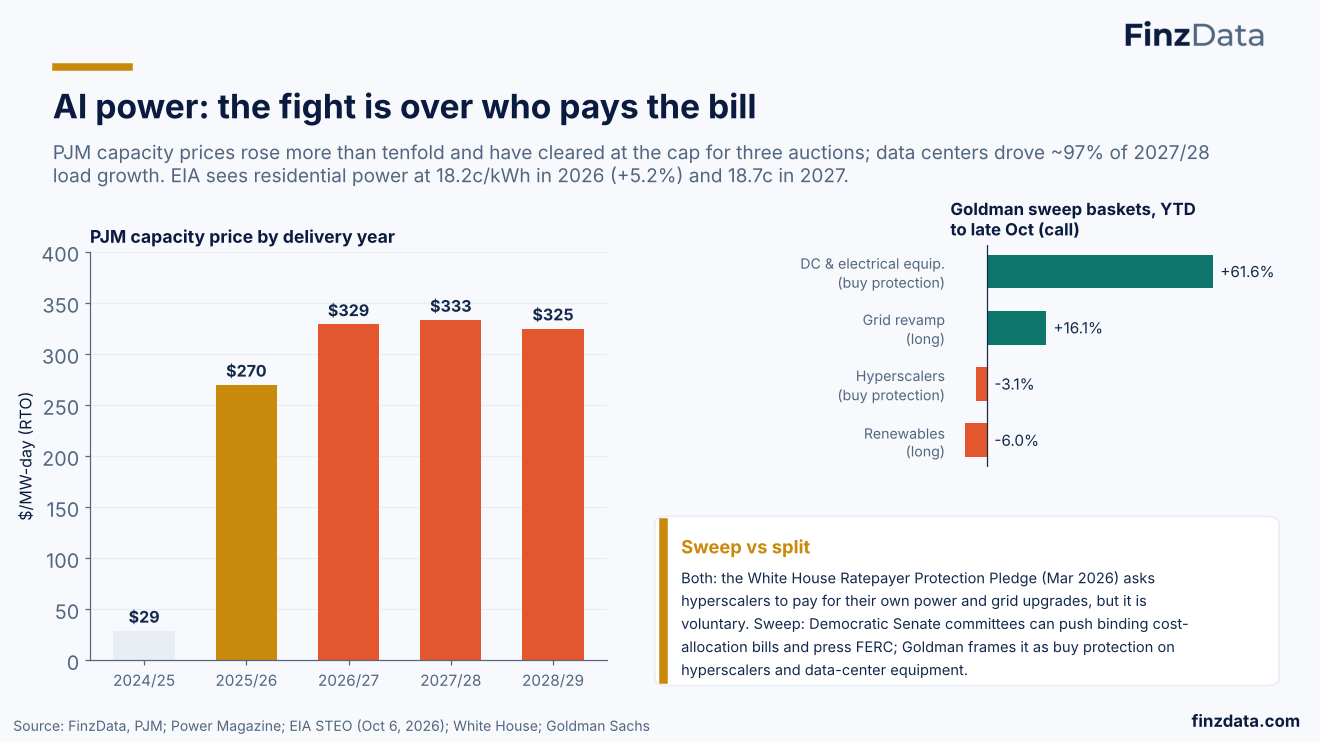
PJM capacity prices rose more than tenfold and have cleared at the cap for three auctions; data centers drove ~97% of 2027/28 load growth. EIA sees residential power at 18.2c/kWh in 2026 (+5.2%) and 18.7c in 2027.
21. Texas: the governor, the PUC and the data-center bill
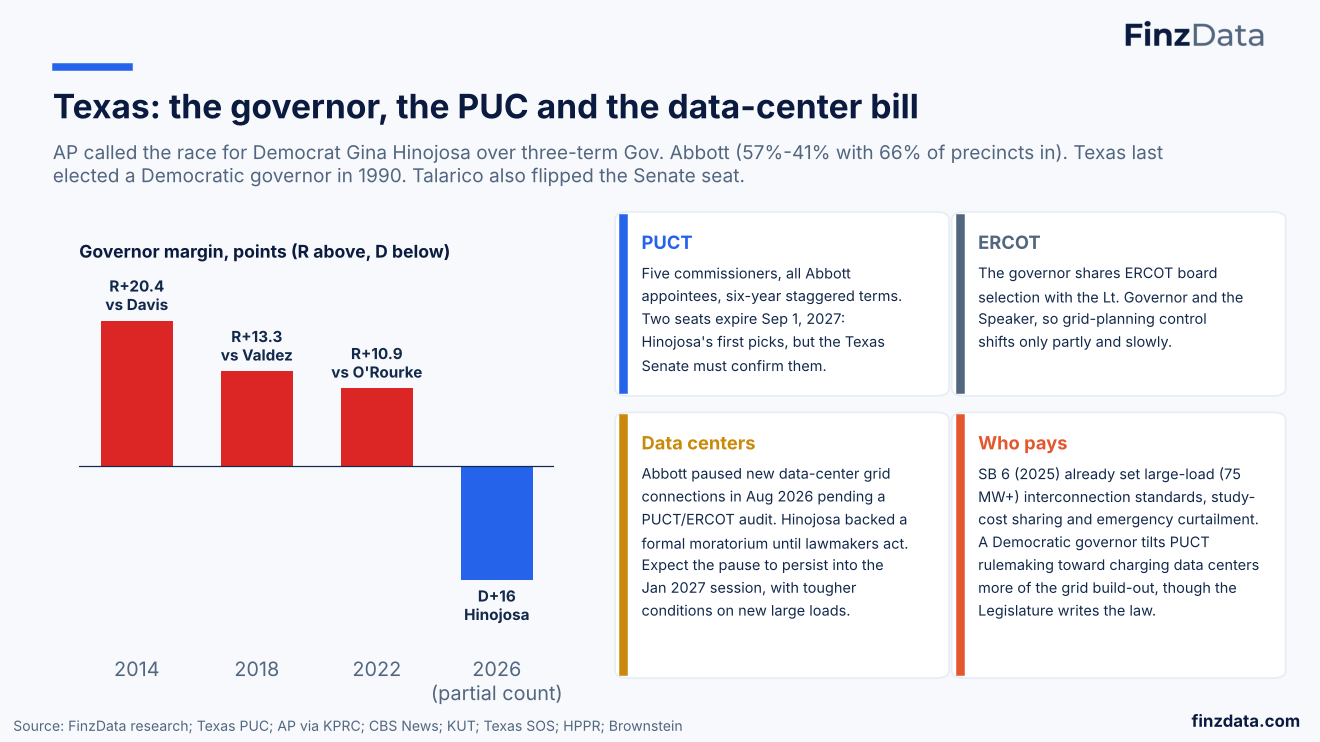
AP called the race for Democrat Gina Hinojosa over three-term Gov. Abbott (57%-41% with 66% of precincts in). Texas last elected a Democratic governor in 1990. Talarico also flipped the Senate seat.
22. Texas utilities: who owns the wires
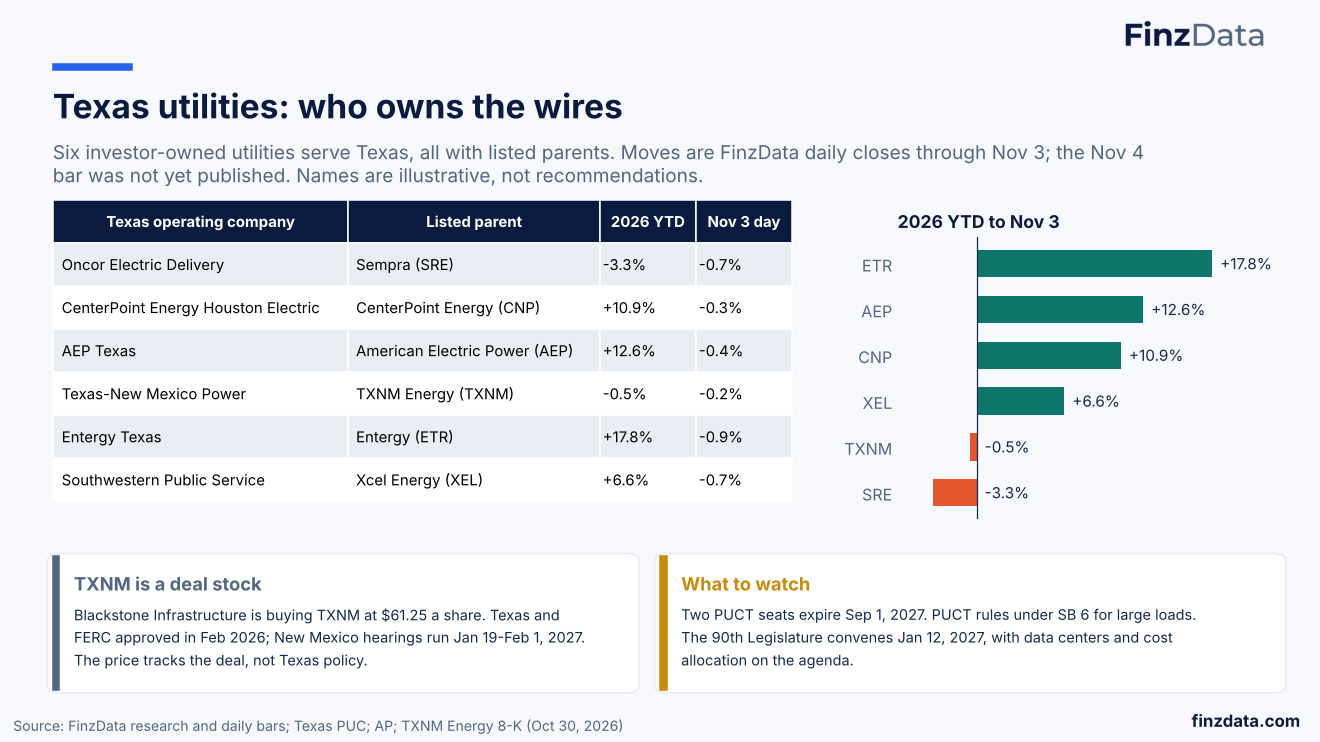
Six investor-owned utilities serve Texas, all with listed parents. Moves are FinzData daily closes through Nov 3; the Nov 4 bar was not yet published. Names are illustrative, not recommendations.
23. Tech and crypto: courts set antitrust, the Senate sets crypto
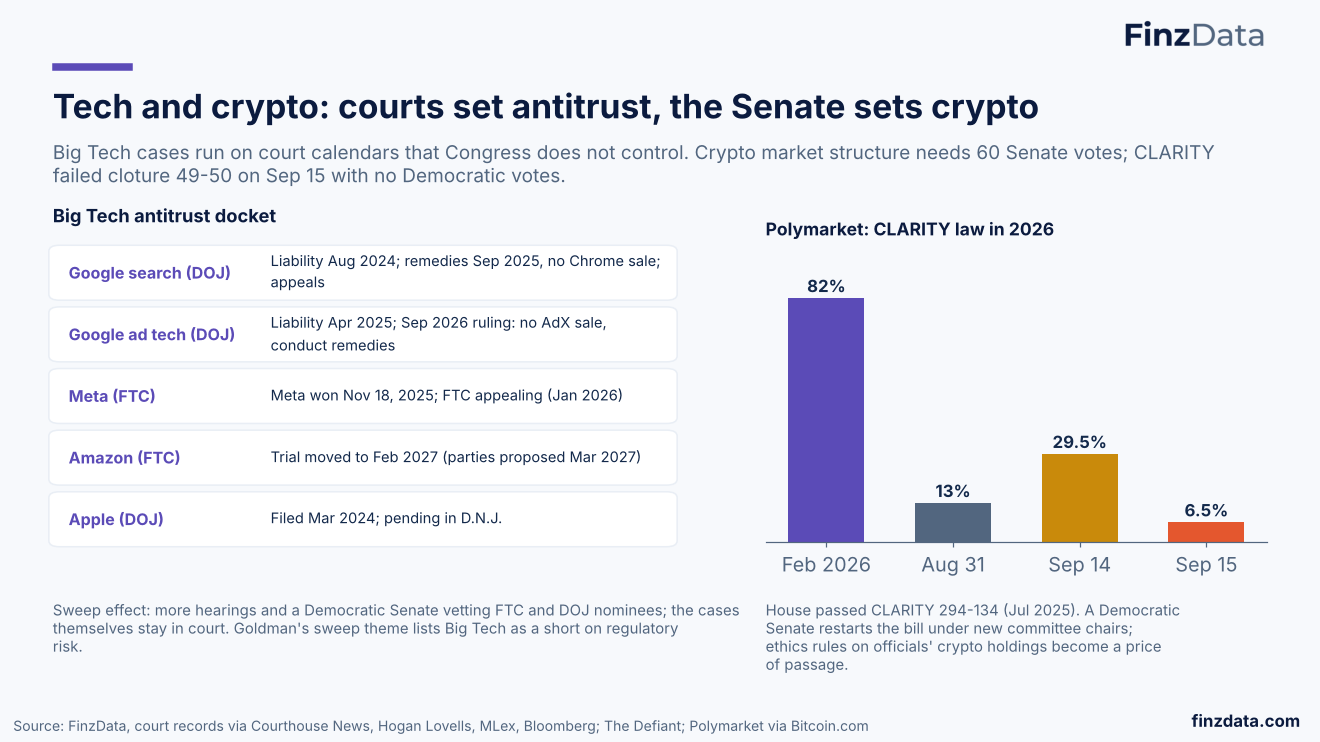
Big Tech cases run on court calendars that Congress does not control. Crypto market structure needs 60 Senate votes; CLARITY failed cloture 49-50 on Sep 15 with no Democratic votes.
24. Defense: the $1.5T request loses its $350B leg
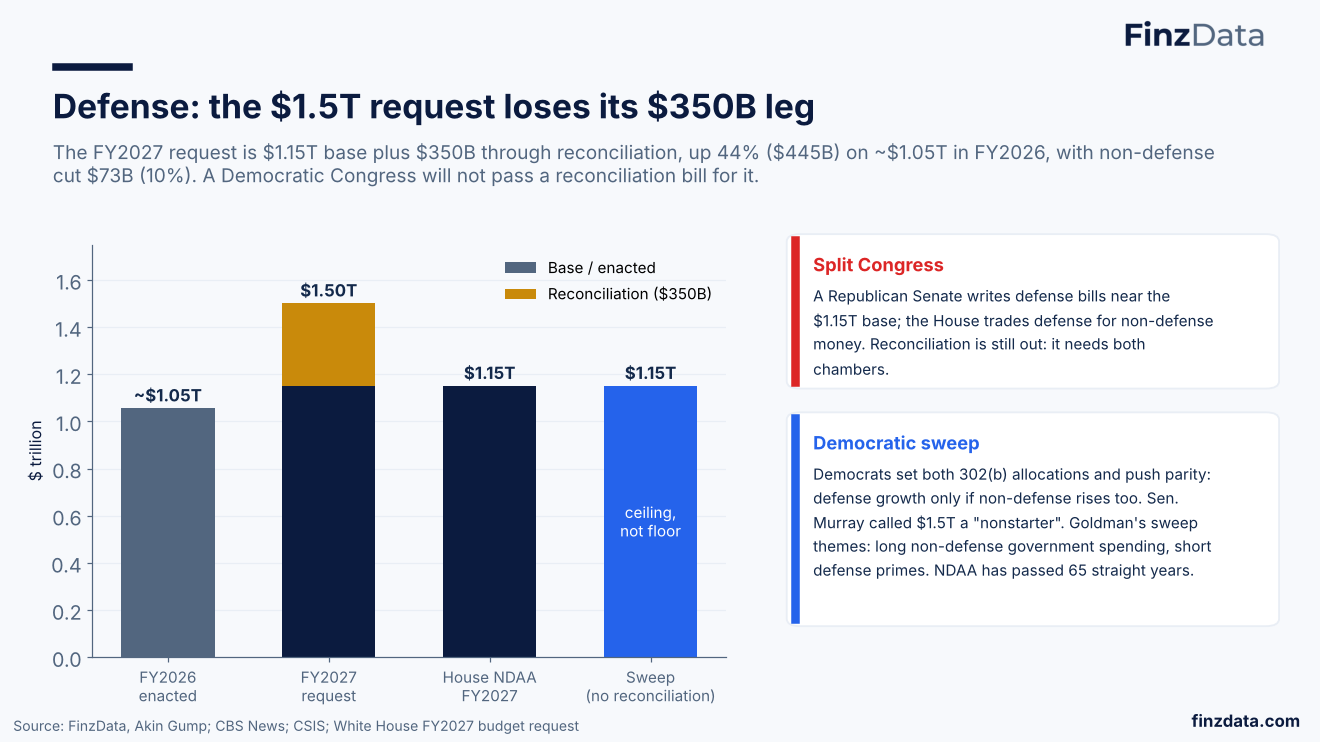
The FY2027 request is $1.15T base plus $350B through reconciliation, up 44% ($445B) on ~$1.05T in FY2026, with non-defense cut $73B (10%). A Democratic Congress will not pass a reconciliation bill for it.
25. Oversight: subpoenas certain, conviction out of reach
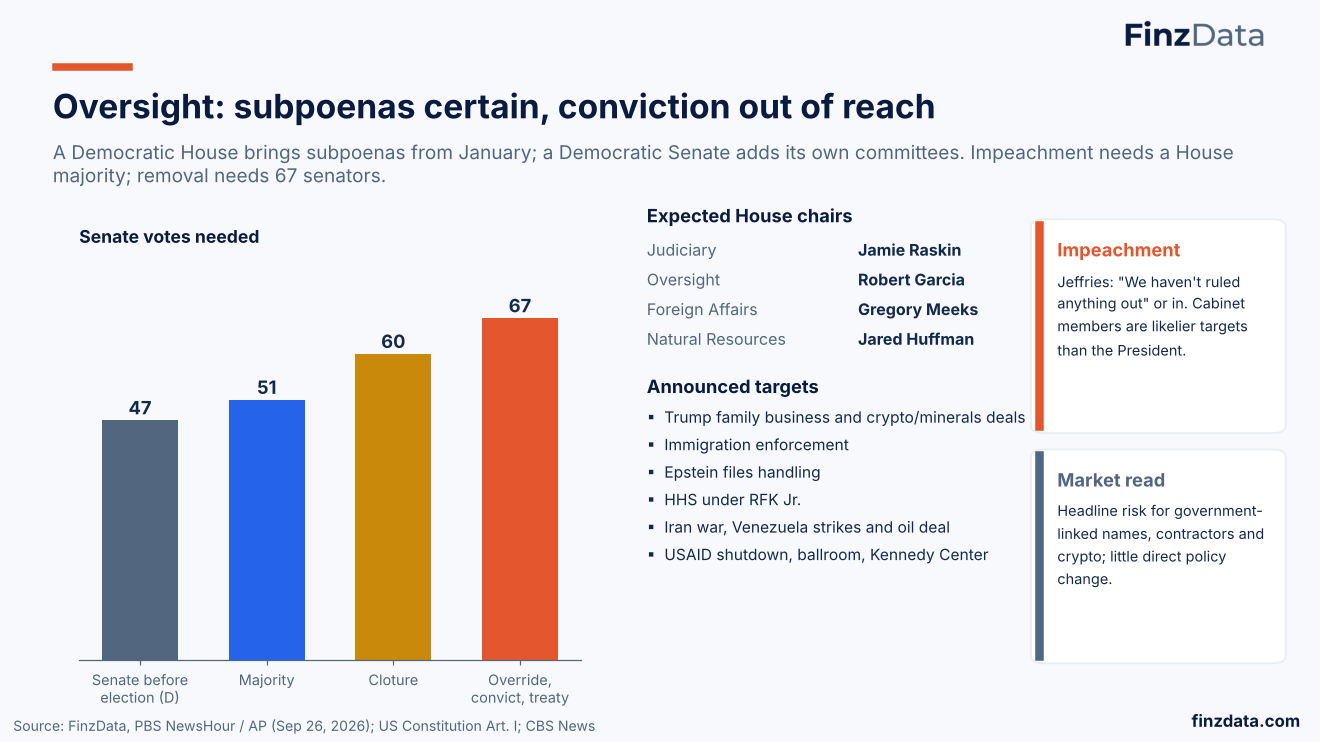
A Democratic House brings subpoenas from January; a Democratic Senate adds its own committees. Impeachment needs a House majority; removal needs 67 senators.
26. Split Congresses pass the fewest laws; output keeps falling
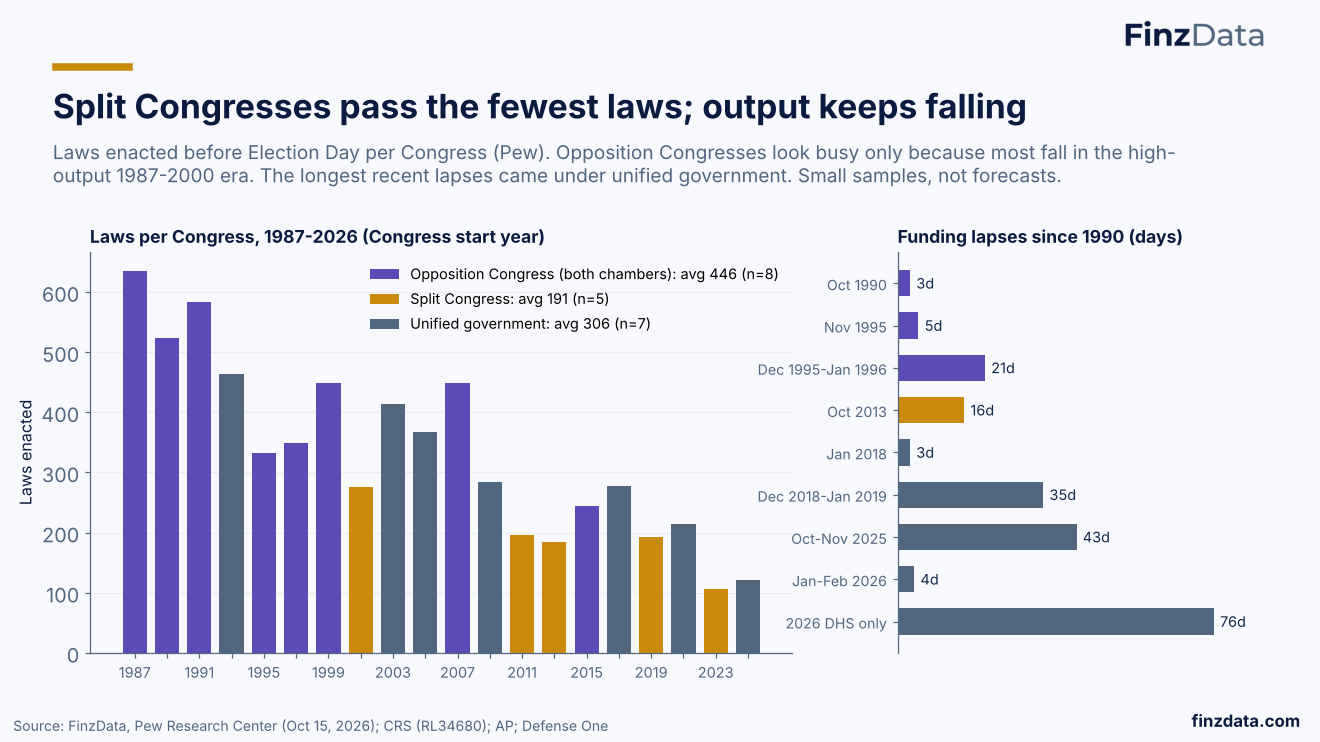
Laws enacted before Election Day per Congress (Pew). Opposition Congresses look busy only because most fall in the high- output 1987-2000 era. The longest recent lapses came under unified government. Small samples, not forecasts.
27. What would change the picture
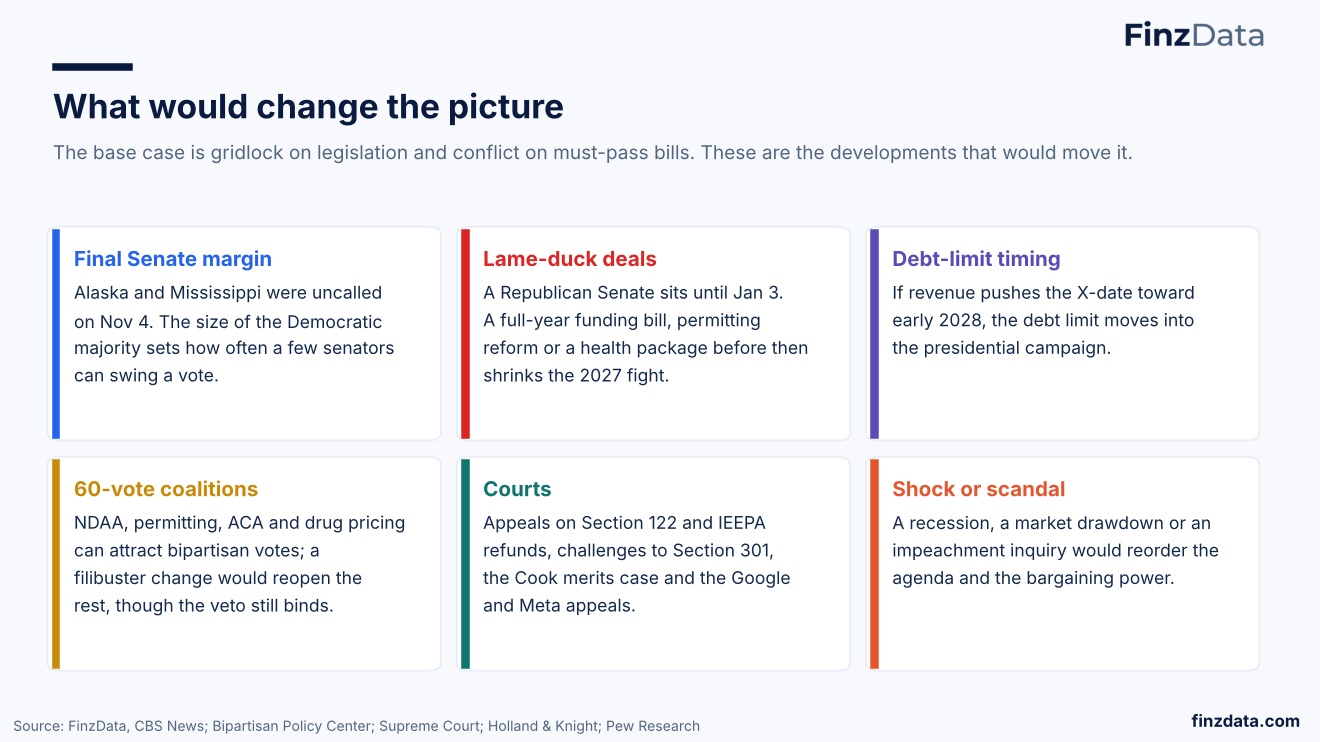
The base case is gridlock on legislation and conflict on must-pass bills. These are the developments that would move it.
28. The Street's playbook
What Goldman Sachs, Citadel Securities and other banks told clients to do around the vote, and how their baskets have actually traded
29. Goldman's sweep book: long the grid, short pharma
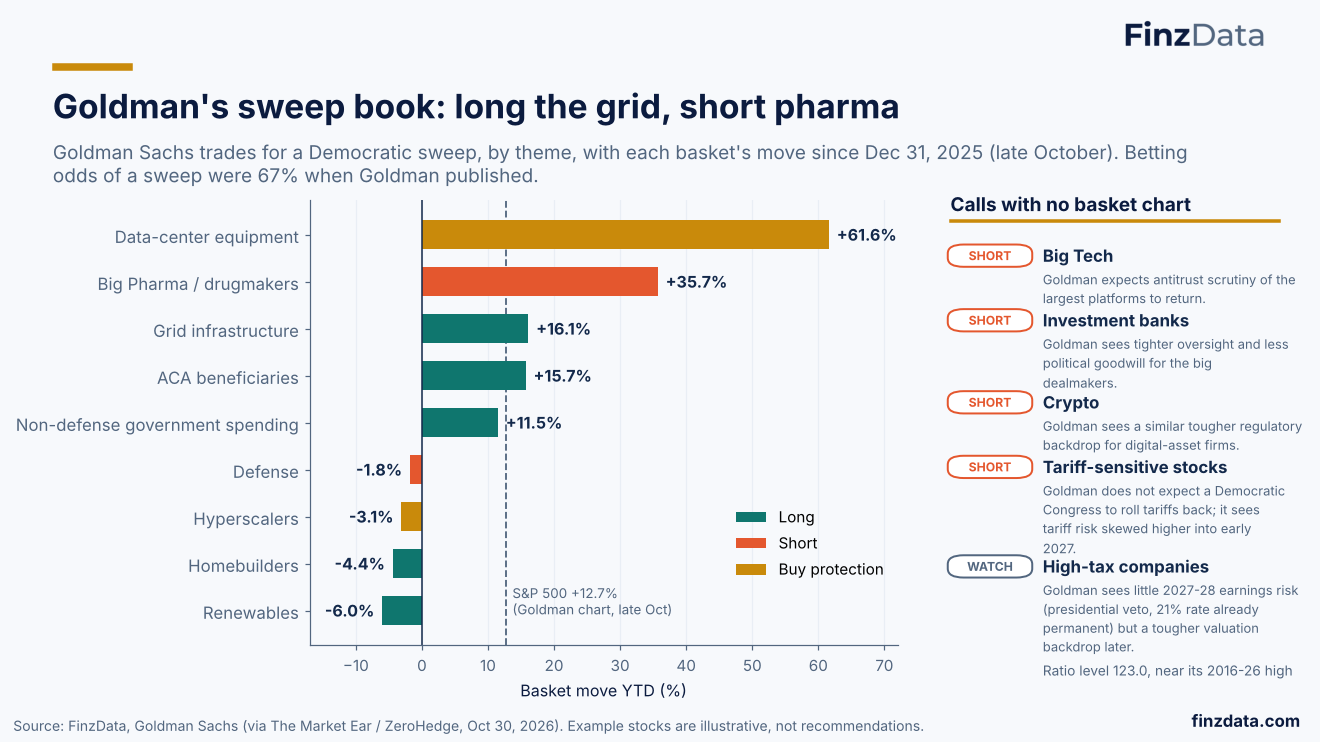
Goldman Sachs trades for a Democratic sweep, by theme, with each basket's move since Dec 31, 2025 (late October). Betting odds of a sweep were 67% when Goldman published.
30. Goldman: AI power, healthcare, and government vs defense
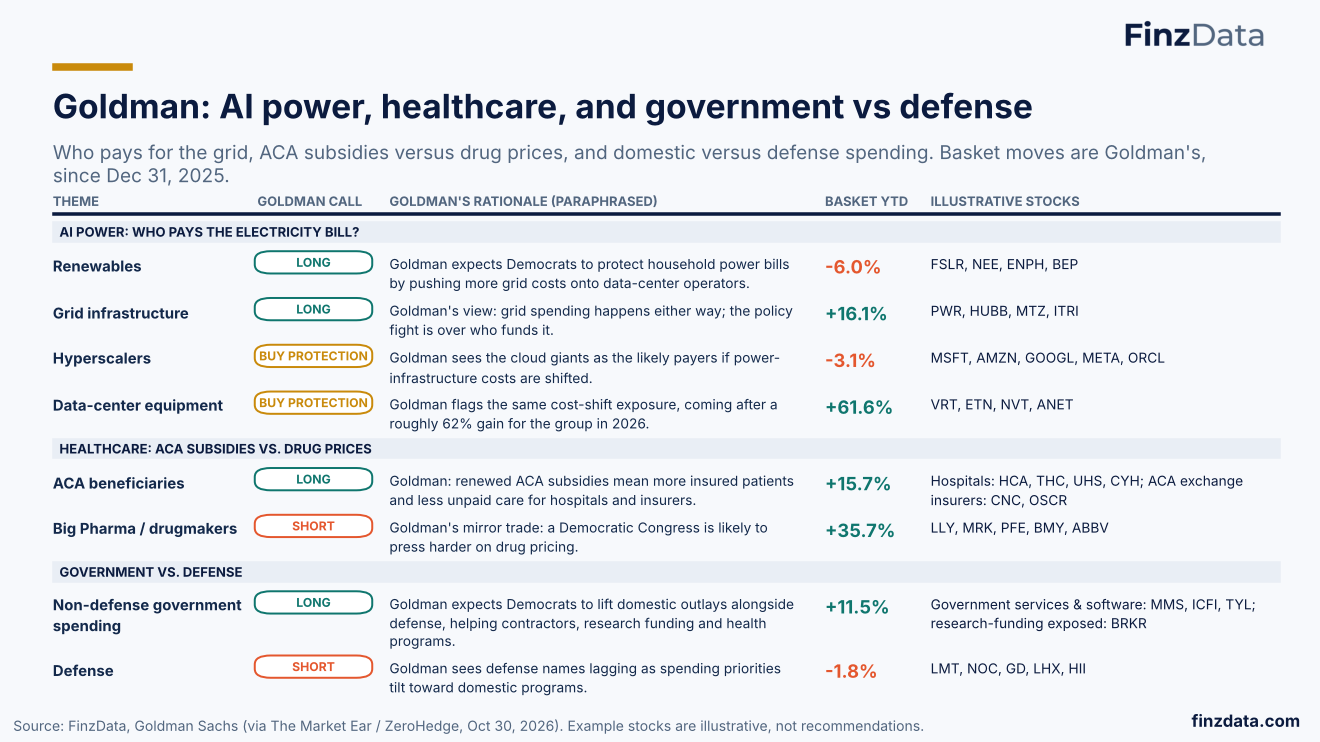
Who pays for the grid, ACA subsidies versus drug prices, and domestic versus defense spending. Basket moves are Goldman's, since Dec 31, 2025.
31. Goldman: Wall Street meets Washington, housing, taxes
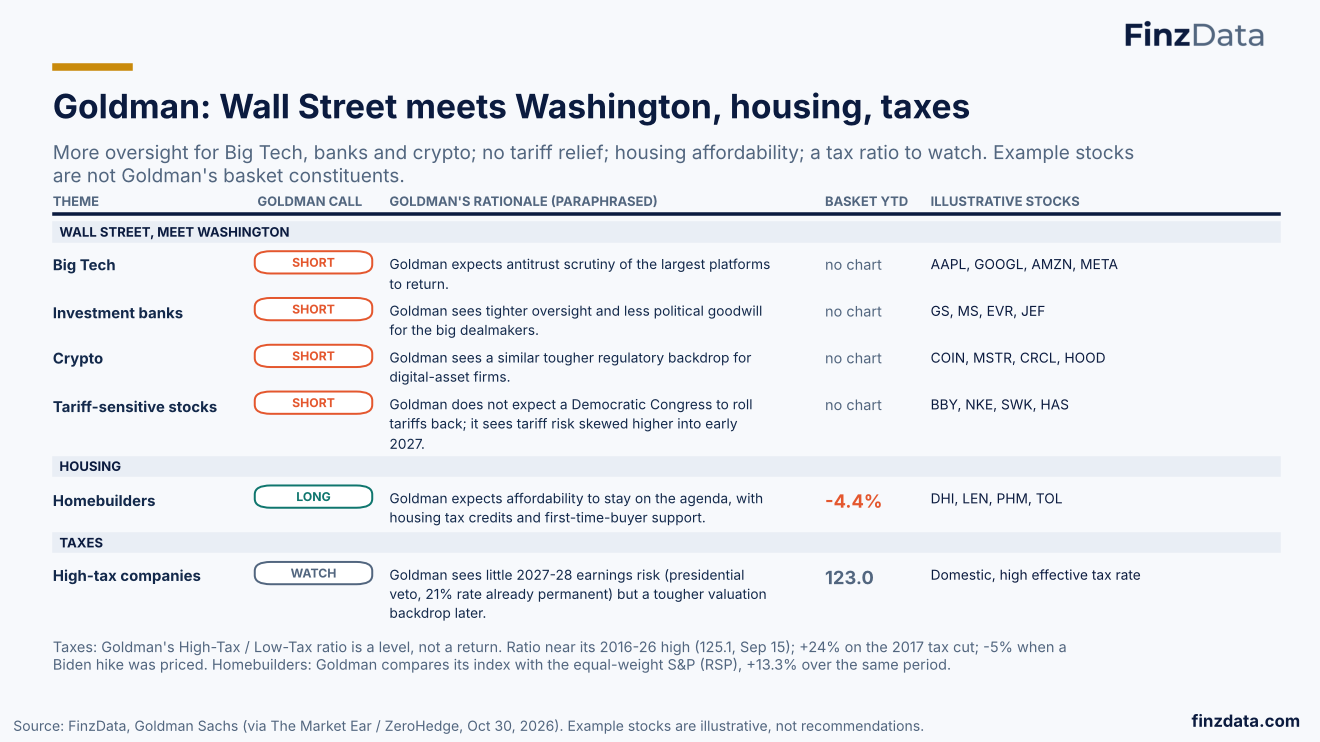
More oversight for Big Tech, banks and crypto; no tariff relief; housing affordability; a tax ratio to watch. Example stocks are not Goldman's basket constituents.
32. $33B
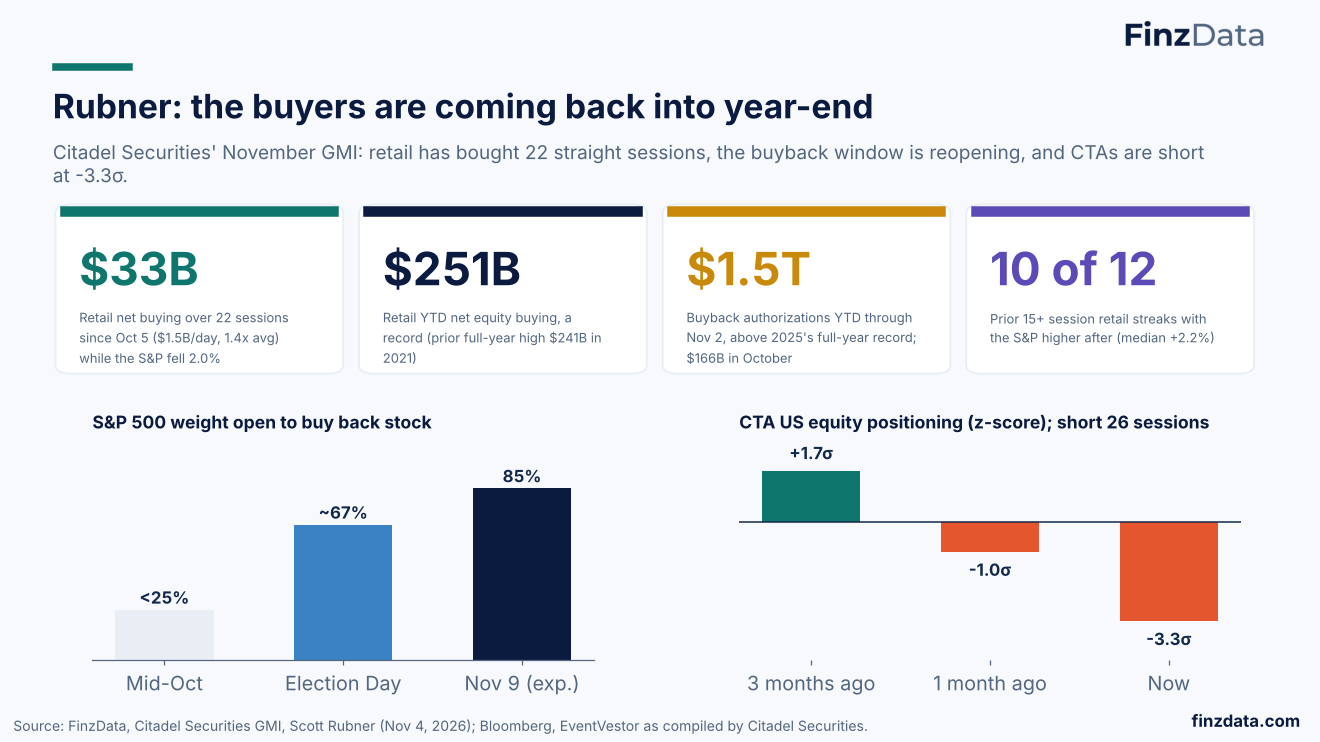
Citadel Securities' November GMI: retail has bought 22 straight sessions, the buyback window is reopening, and CTAs are short at -3.3σ.
33. Earnings rose, multiples fell: AI hardware de-rated most
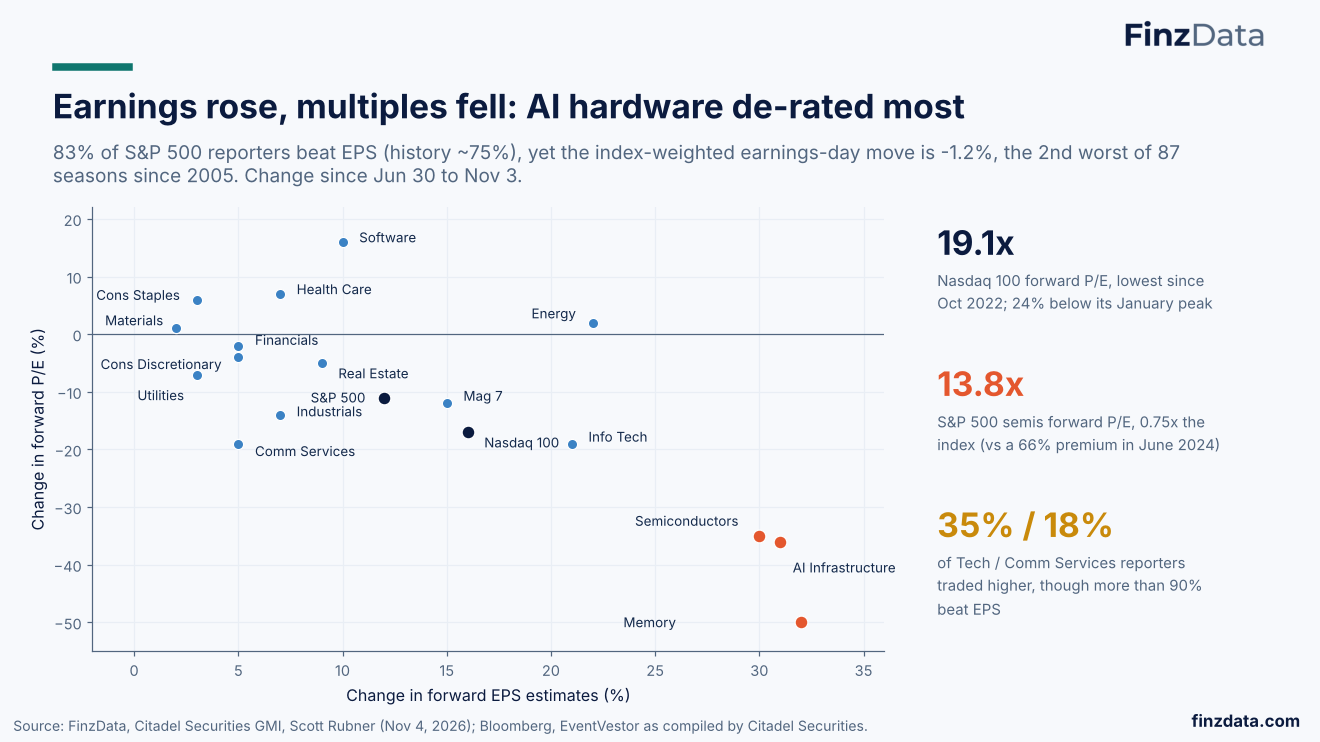
83% of S&P 500 reporters beat EPS (history ~75%), yet the index-weighted earnings-day move is -1.2%, the 2nd worst of 87 seasons since 2005. Change since Jun 30 to Nov 3.
34. Rubner: the midterm calendar and the vol reset favor buyers
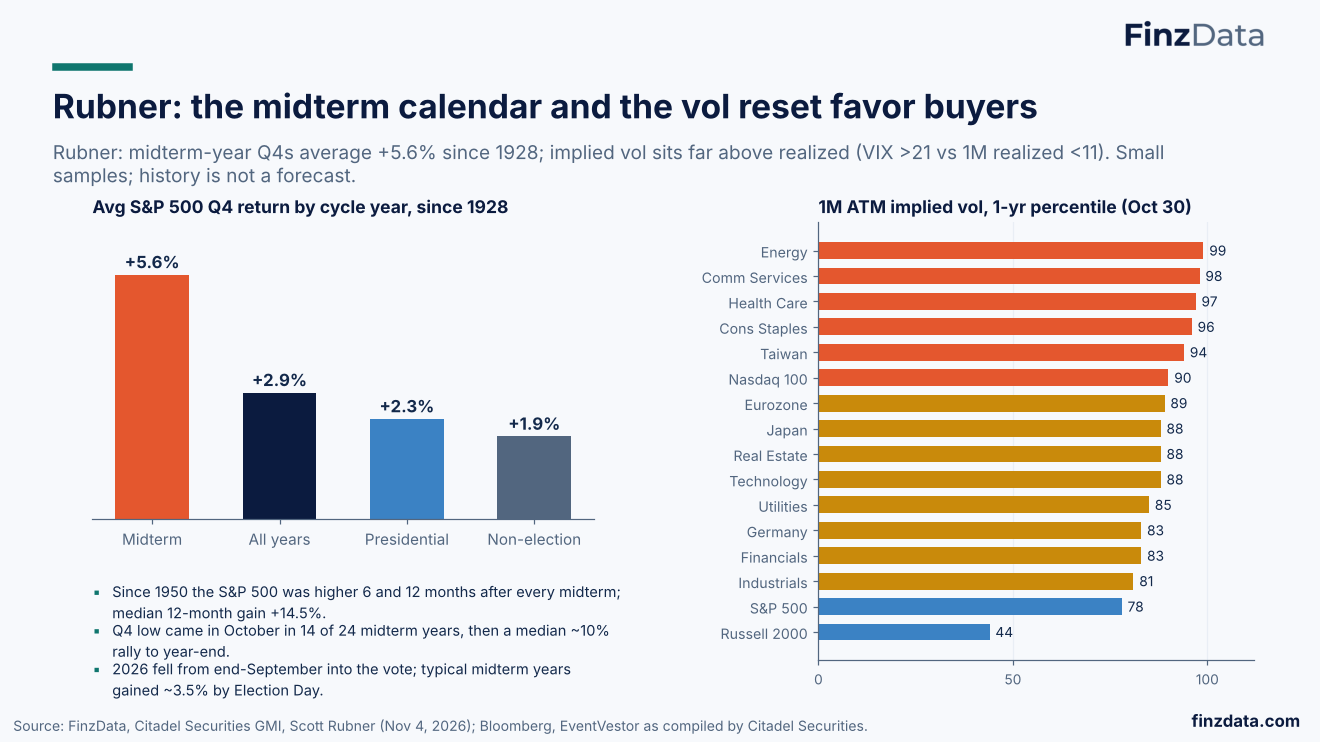
Rubner: midterm-year Q4s average +5.6% since 1928; implied vol sits far above realized (VIX >21 vs 1M realized <11). Small samples; history is not a forecast.
35. Where the Street agrees, and where it splits
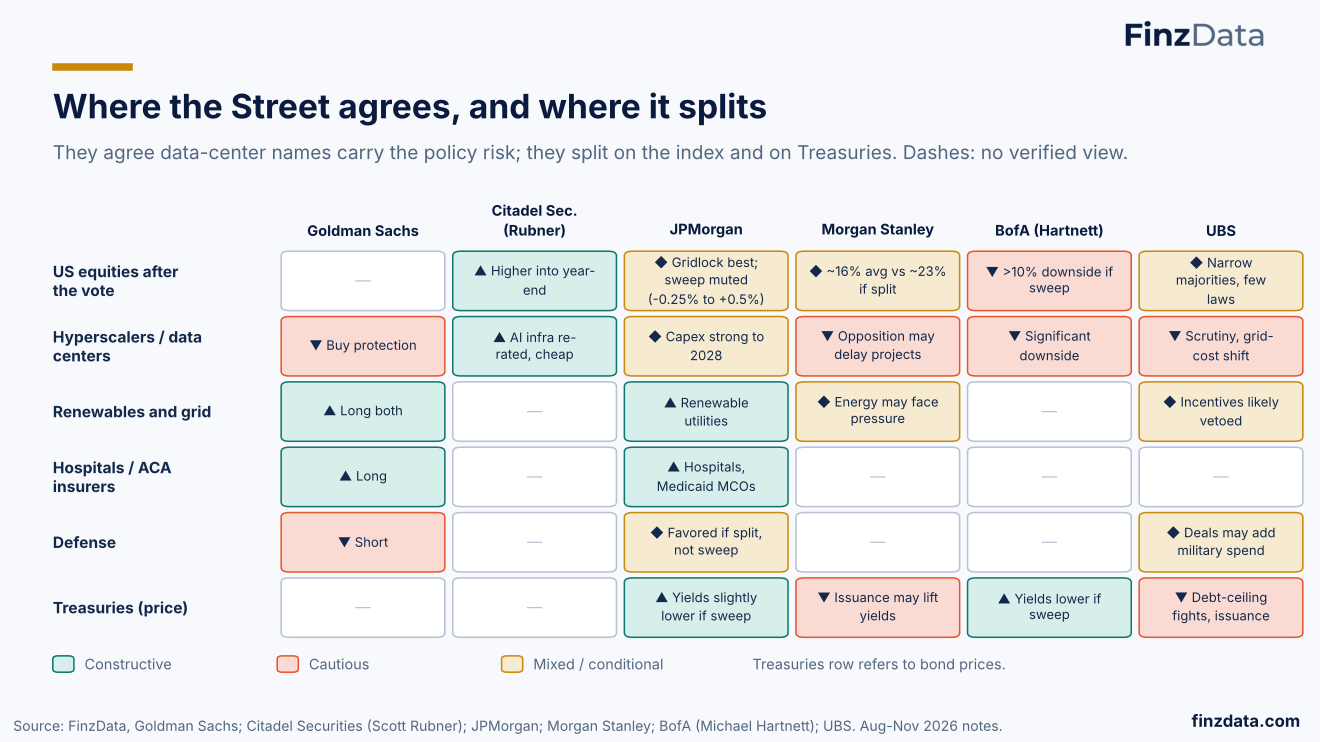
They agree data-center names carry the policy risk; they split on the index and on Treasuries. Dashes: no verified view.
36. Day one beat JPM's blue-wave range
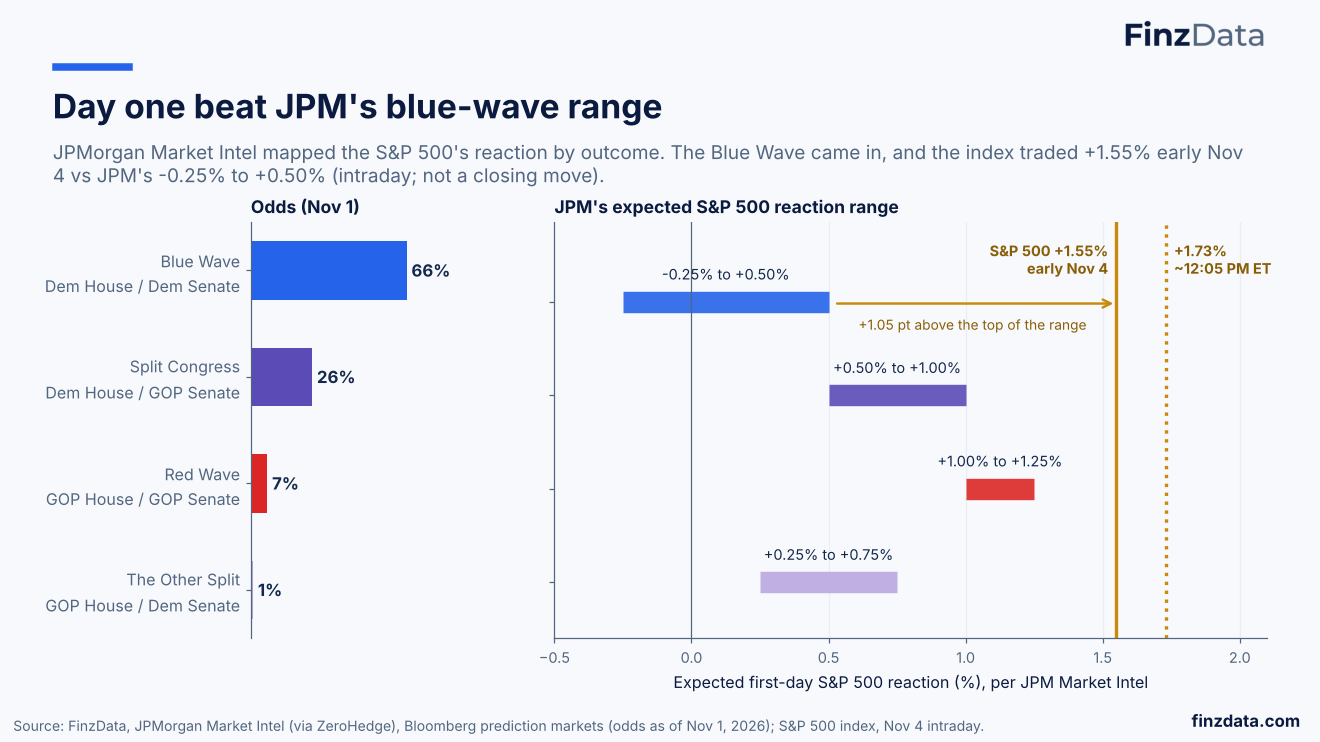
JPMorgan Market Intel mapped the S&P 500's reaction by outcome. The Blue Wave came in, and the index traded +1.55% early Nov 4 vs JPM's -0.25% to +0.50% (intraday; not a closing move).
37. JPMorgan's scenario map: AI, deficits and probes
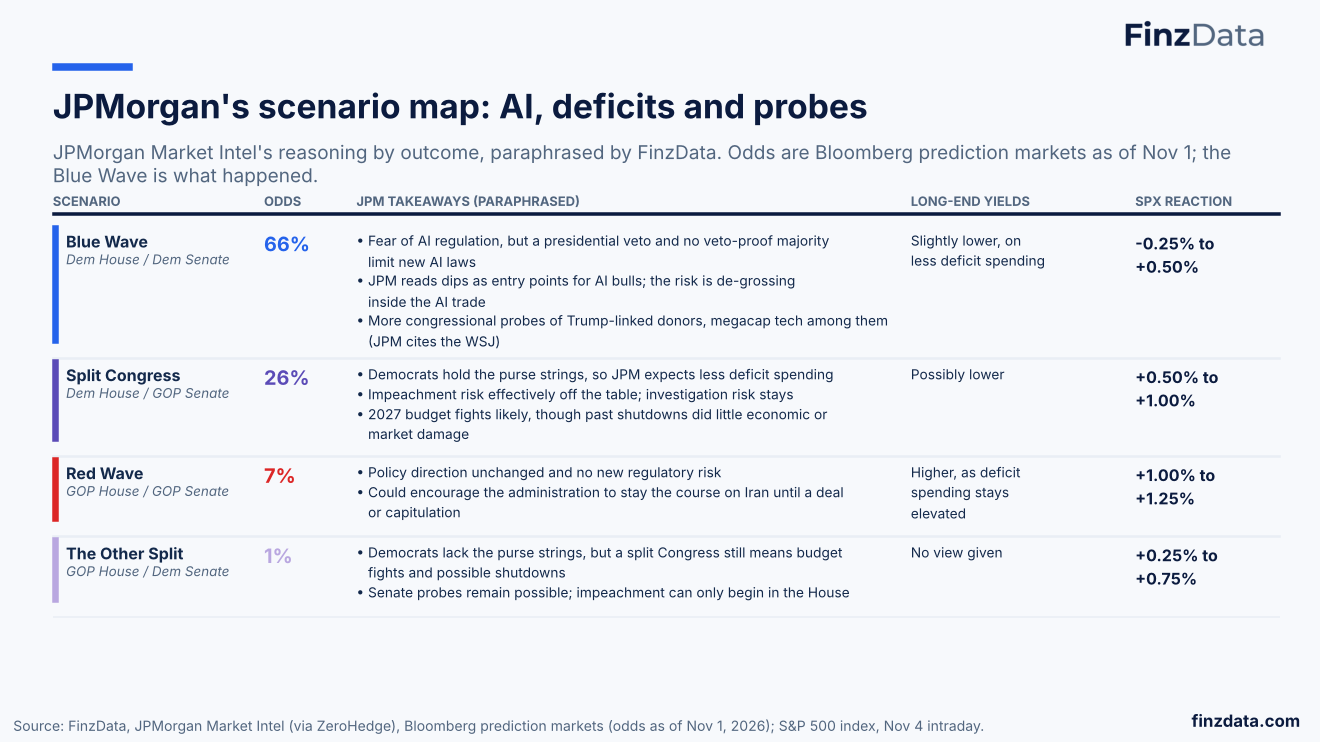
JPMorgan Market Intel's reasoning by outcome, paraphrased by FinzData. Odds are Bloomberg prediction markets as of Nov 1; the Blue Wave is what happened.
38. Checking Goldman's baskets against the example stocks
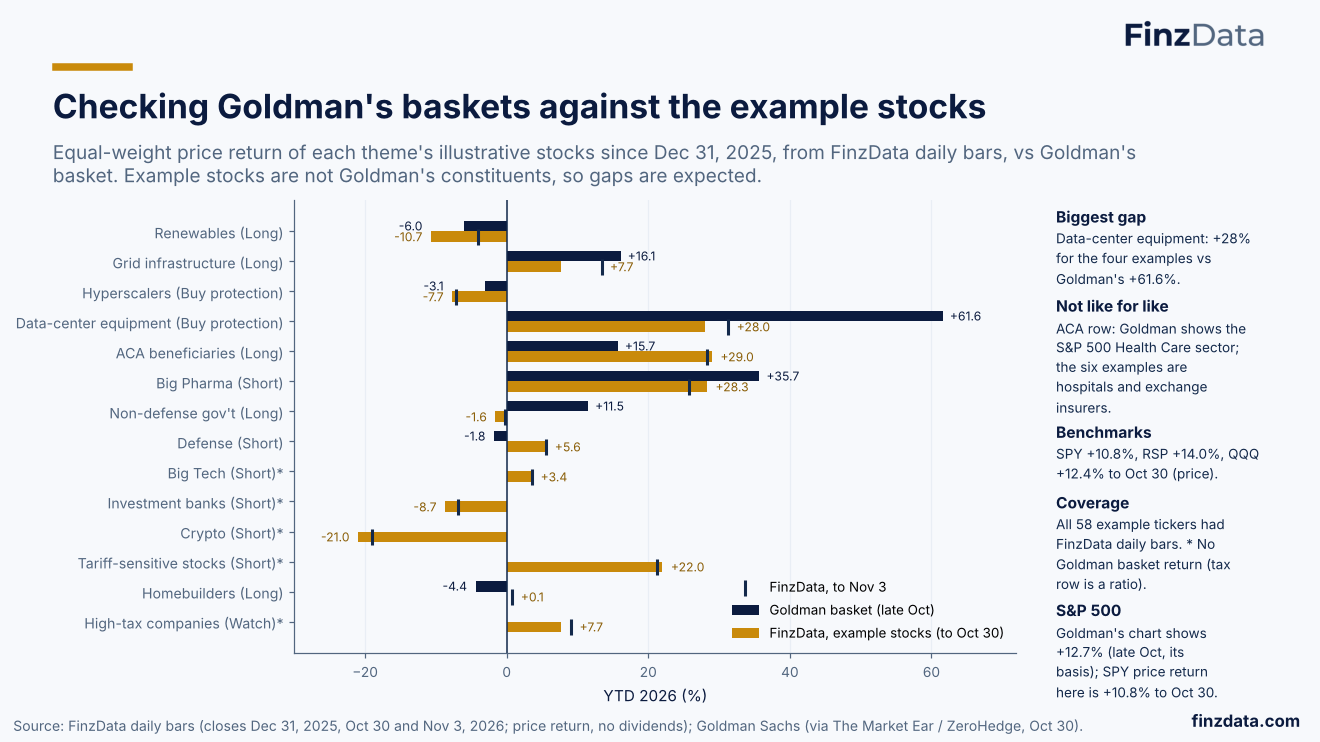
Equal-weight price return of each theme's illustrative stocks since Dec 31, 2025, from FinzData daily bars, vs Goldman's basket. Example stocks are not Goldman's constituents, so gaps are expected.
39. Markets: history, cross-asset and positioning
What stocks, sectors, rates, the dollar, gold and volatility did after past midterms, and how dealers and futures traders are positioned now.
40. S&P 500 rose 12 months after all 20 midterms since 1946
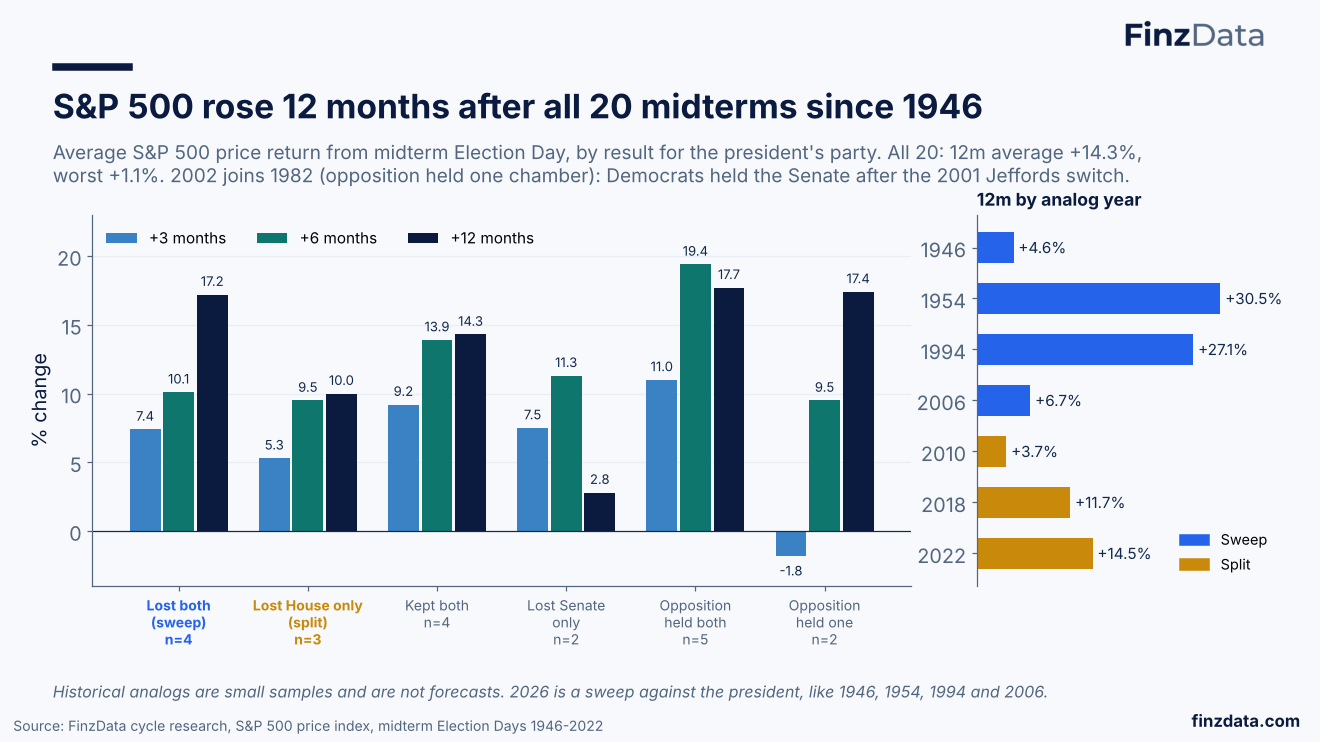
Average S&P 500 price return from midterm Election Day, by result for the president's party. All 20: 12m average +14.3%, worst +1.1%. 2002 joins 1982 (opposition held one chamber): Democrats held the Senate after the 2001 Jeffords switch.
41. Sector ETFs 12 months after each midterm
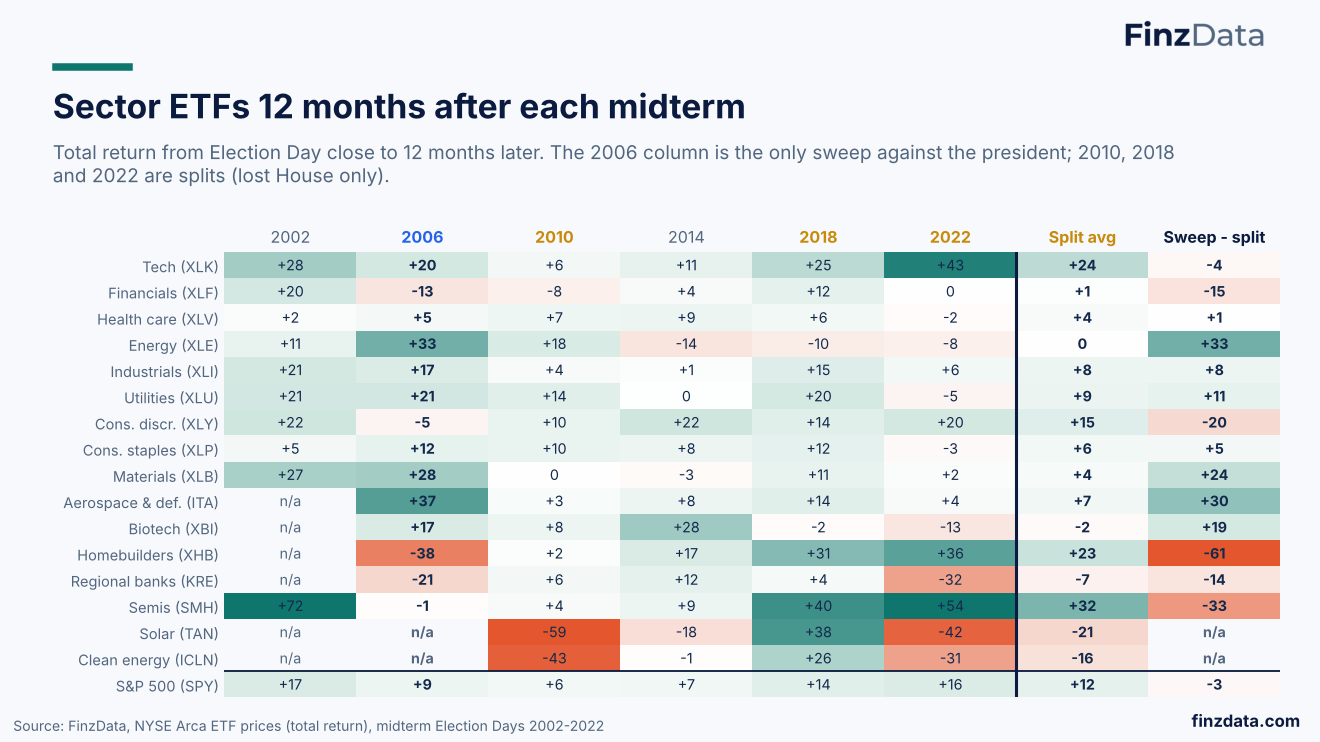
Total return from Election Day close to 12 months later. The 2006 column is the only sweep against the president; 2010, 2018 and 2022 are splits (lost House only).
42. 2006 sweep: defense, energy, materials led; housing lagged
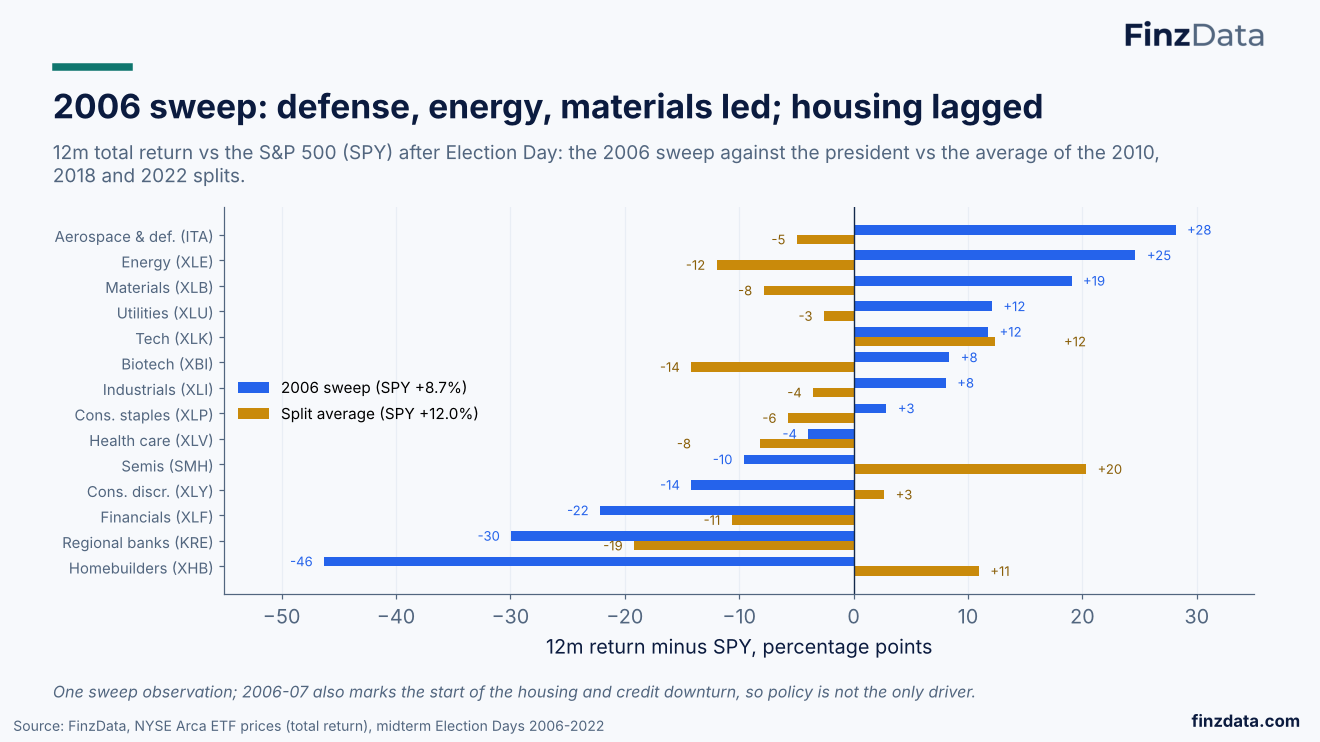
12m total return vs the S&P 500 (SPY) after Election Day: the 2006 sweep against the president vs the average of the 2010, 2018 and 2022 splits.
43. Treasury yields: no consistent post-midterm direction
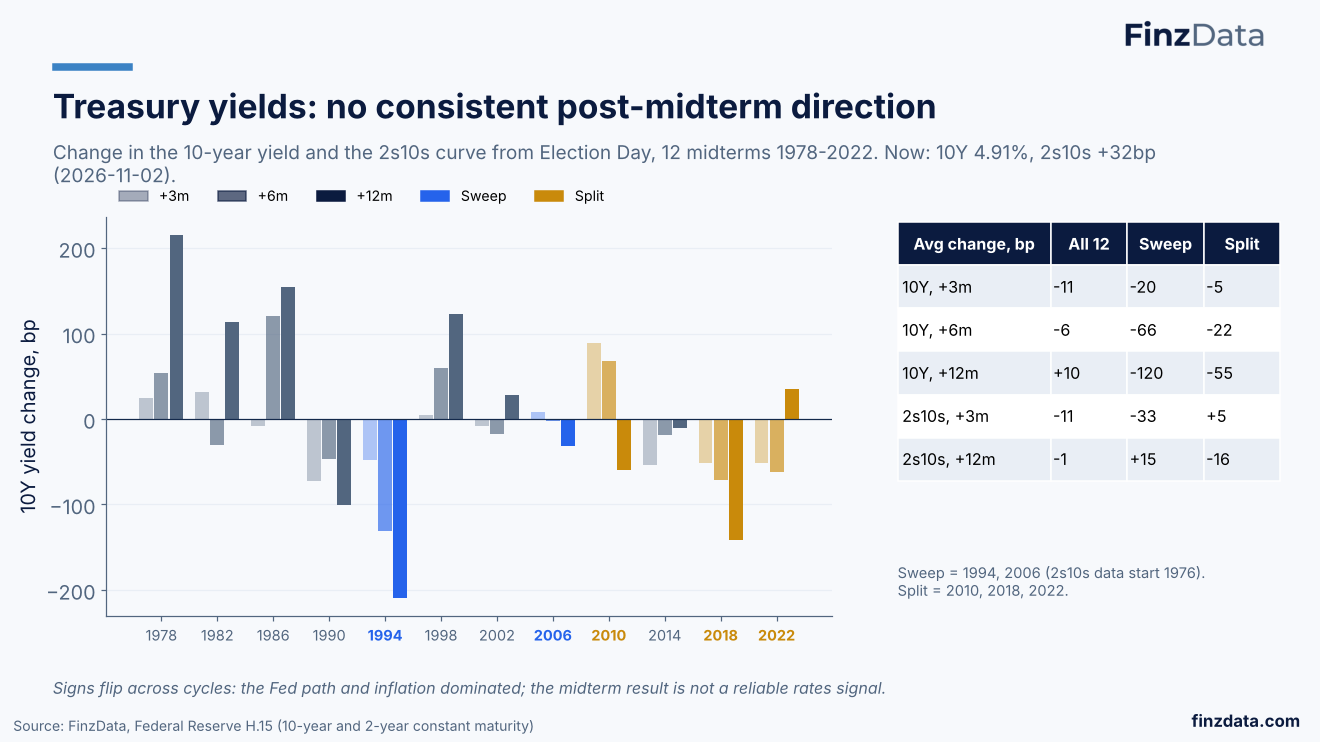
Change in the 10-year yield and the 2s10s curve from Election Day, 12 midterms 1978-2022. Now: 10Y 4.91%, 2s10s +32bp (2026-11-02).
44. Dollar mixed, gold higher in 5 of 6 midterms since 2002
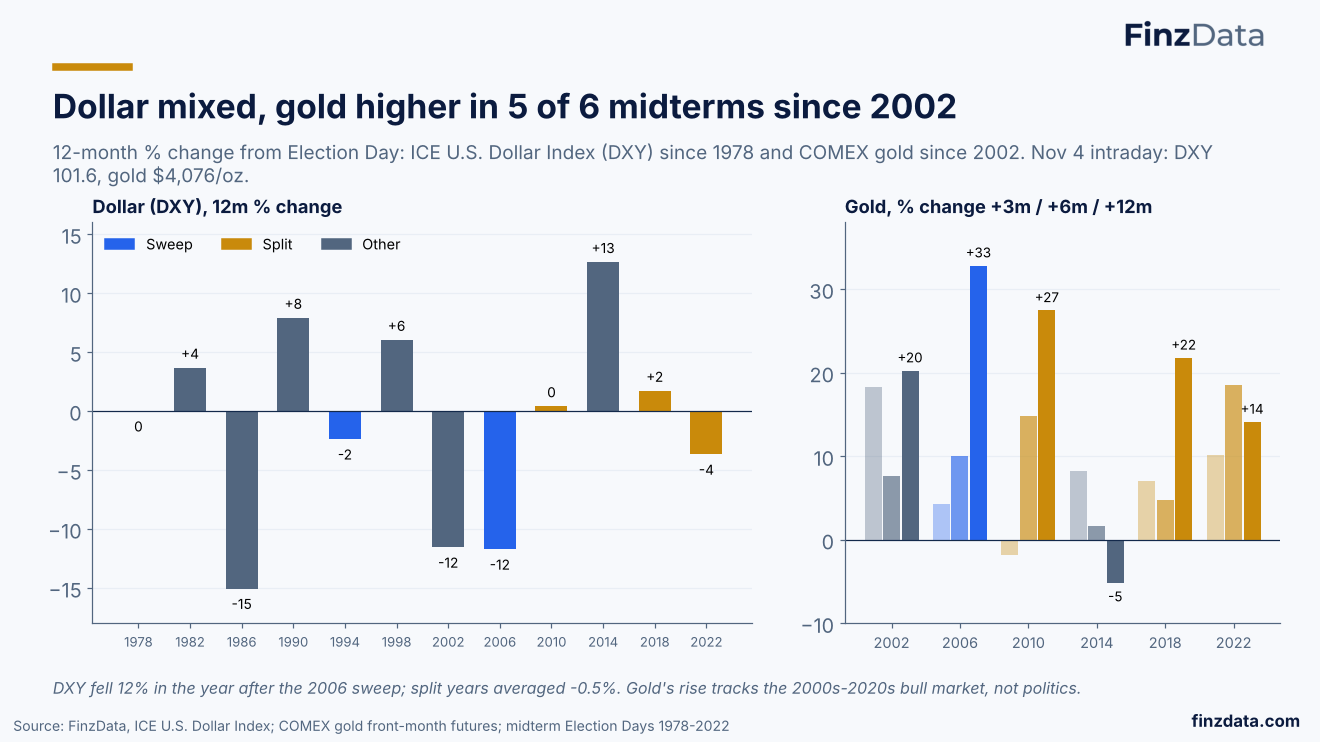
12-month % change from Election Day: ICE U.S. Dollar Index (DXY) since 1978 and COMEX gold since 2002. Nov 4 intraday: DXY 101.6, gold $4,076/oz.
45. Volatility: VIX usually eases after Election Day
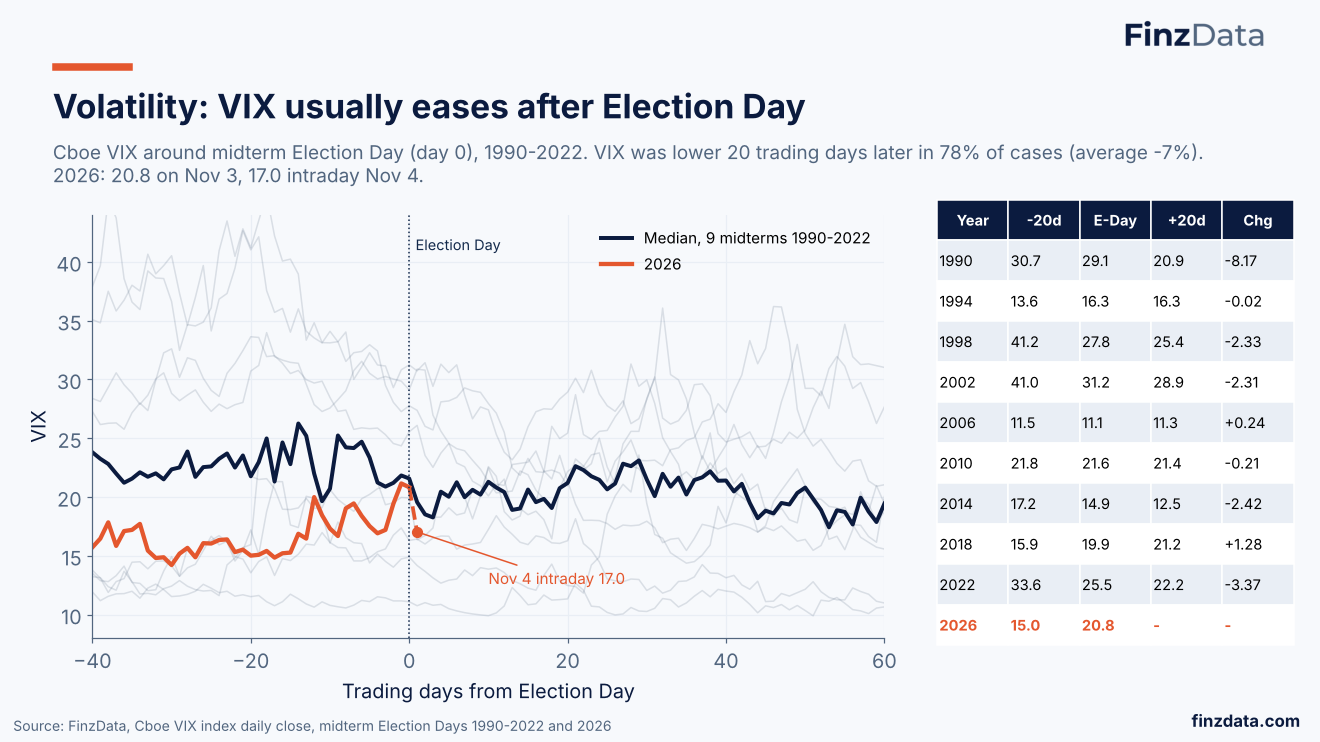
Cboe VIX around midterm Election Day (day 0), 1990-2022. VIX was lower 20 trading days later in 78% of cases (average -7%). 2026: 20.8 on Nov 3, 17.0 intraday Nov 4.
46. Nov-Apr after midterms: up in 19 of 20 since 1946
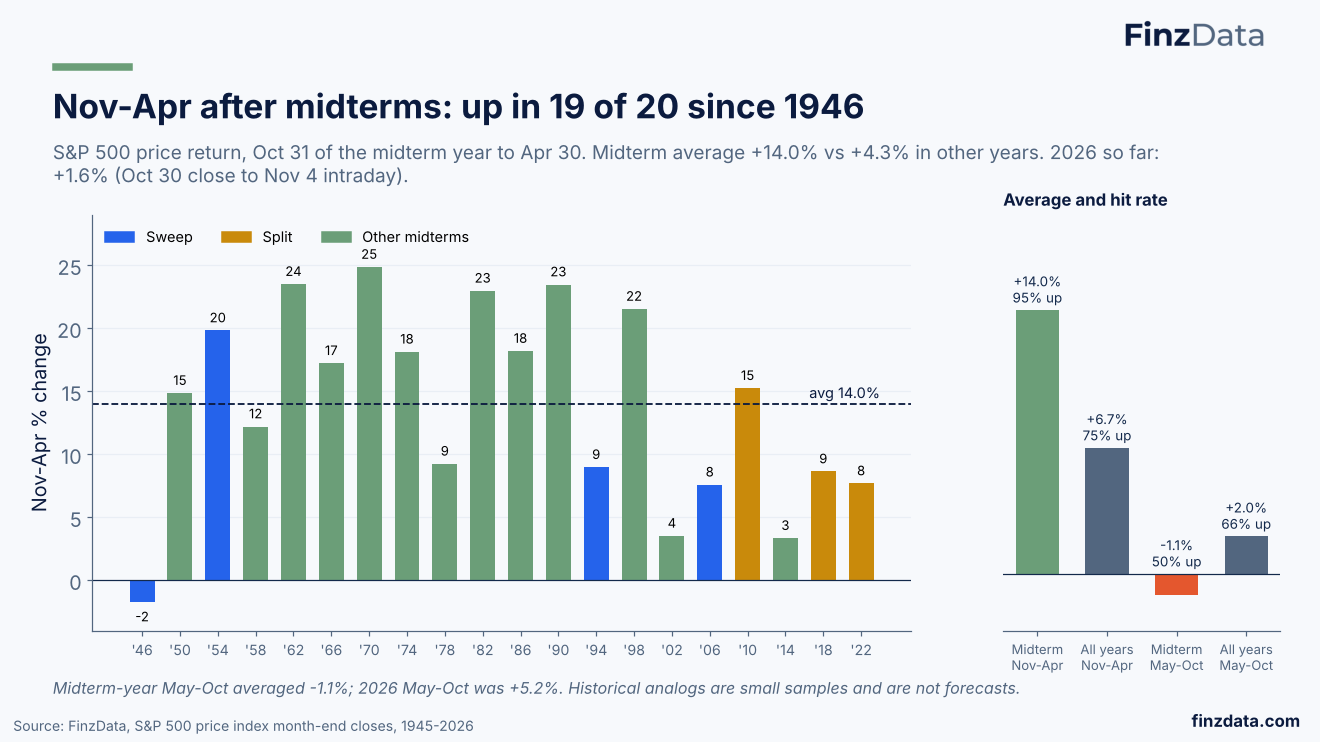
S&P 500 price return, Oct 31 of the midterm year to Apr 30. Midterm average +14.0% vs +4.3% in other years. 2026 so far: +1.6% (Oct 30 close to Nov 4 intraday).
47. Dealers went into the vote short gamma
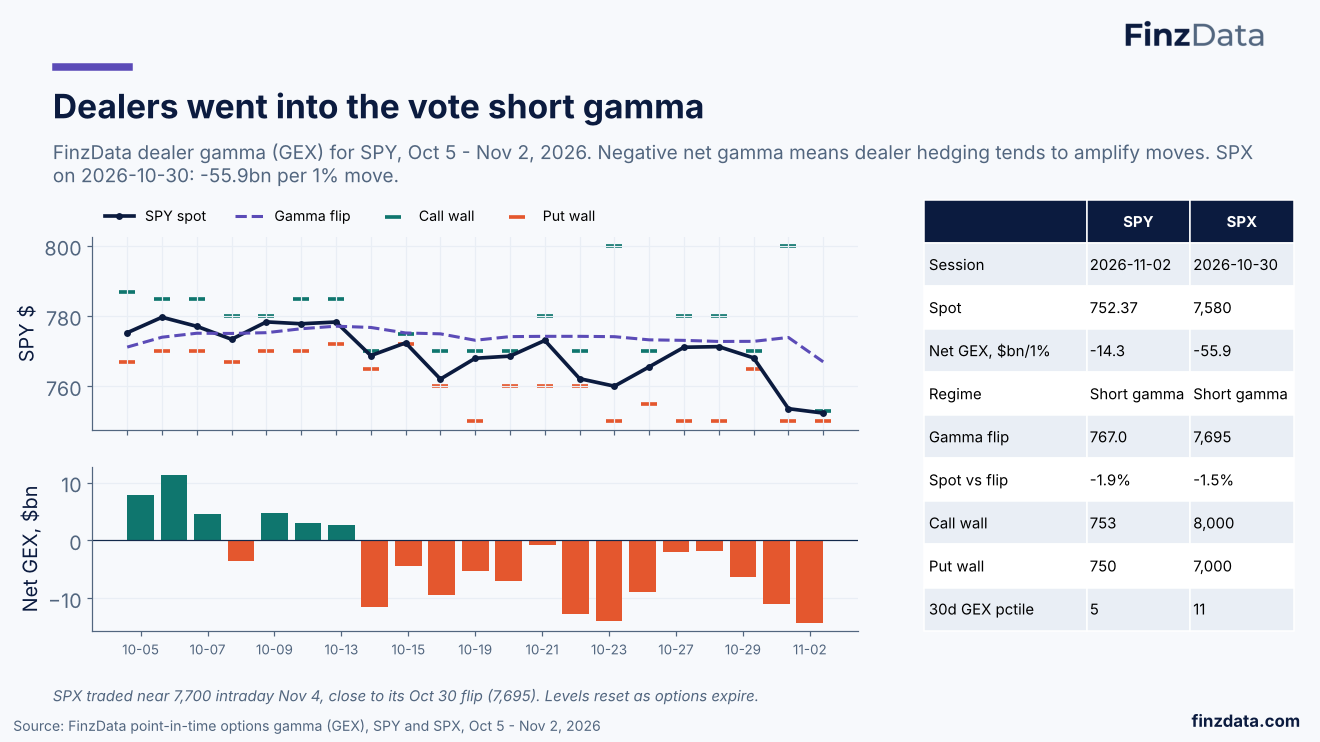
FinzData dealer gamma (GEX) for SPY, Oct 5 - Nov 2, 2026. Negative net gamma means dealer hedging tends to amplify moves. SPX on 2026-10-30: -55.9bn per 1% move.
48. Futures positioning: asset managers long, levered funds short
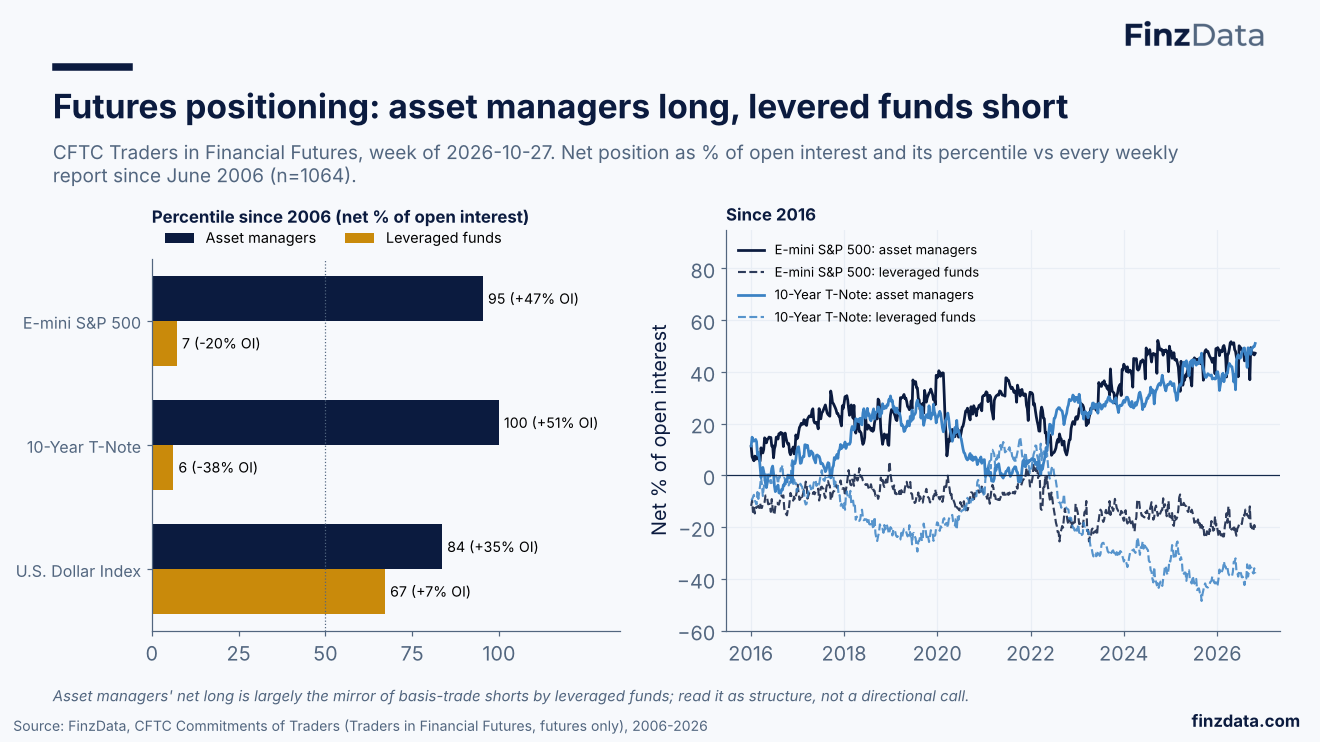
CFTC Traders in Financial Futures, week of 2026-10-27. Net position as % of open interest and its percentile vs every weekly report since June 2006 (n=1064).
49. 2026 leadership and the first post-election move
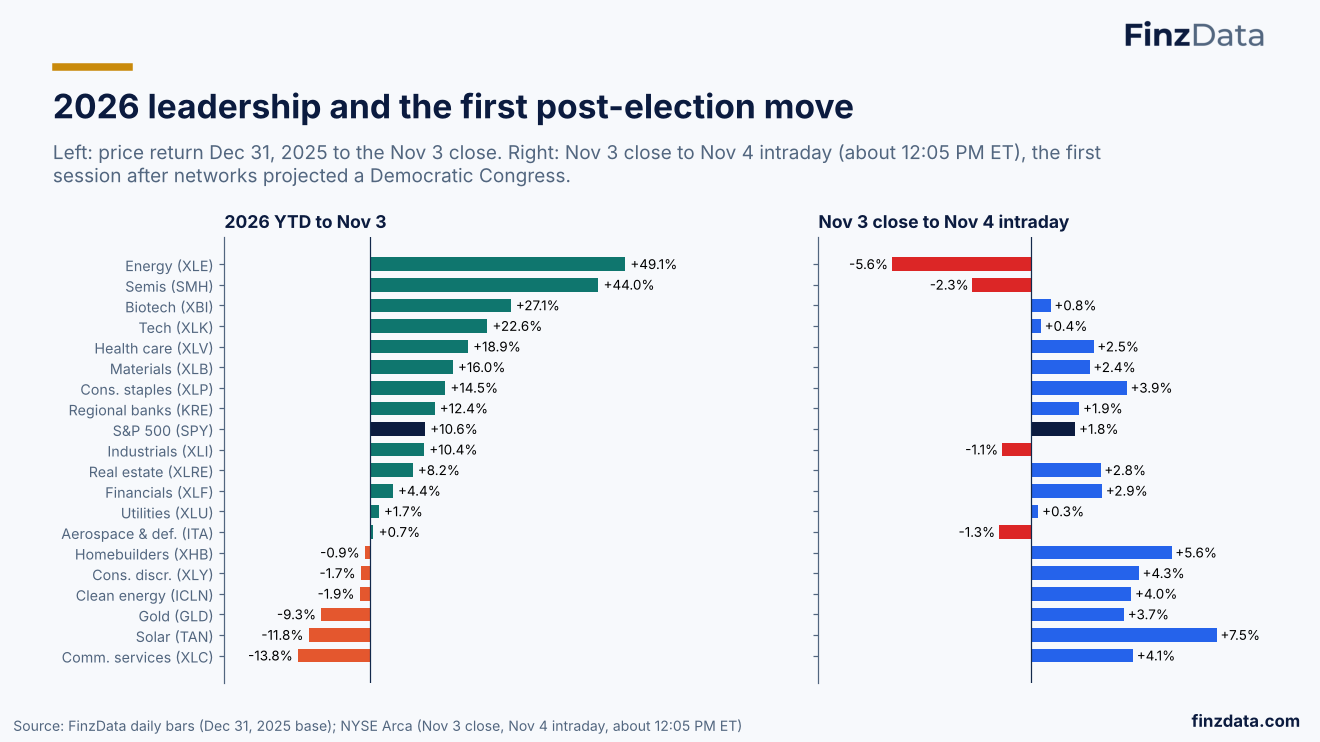
Left: price return Dec 31, 2025 to the Nov 3 close. Right: Nov 3 close to Nov 4 intraday (about 12:05 PM ET), the first session after networks projected a Democratic Congress.
50. What history says, and how much to trust it
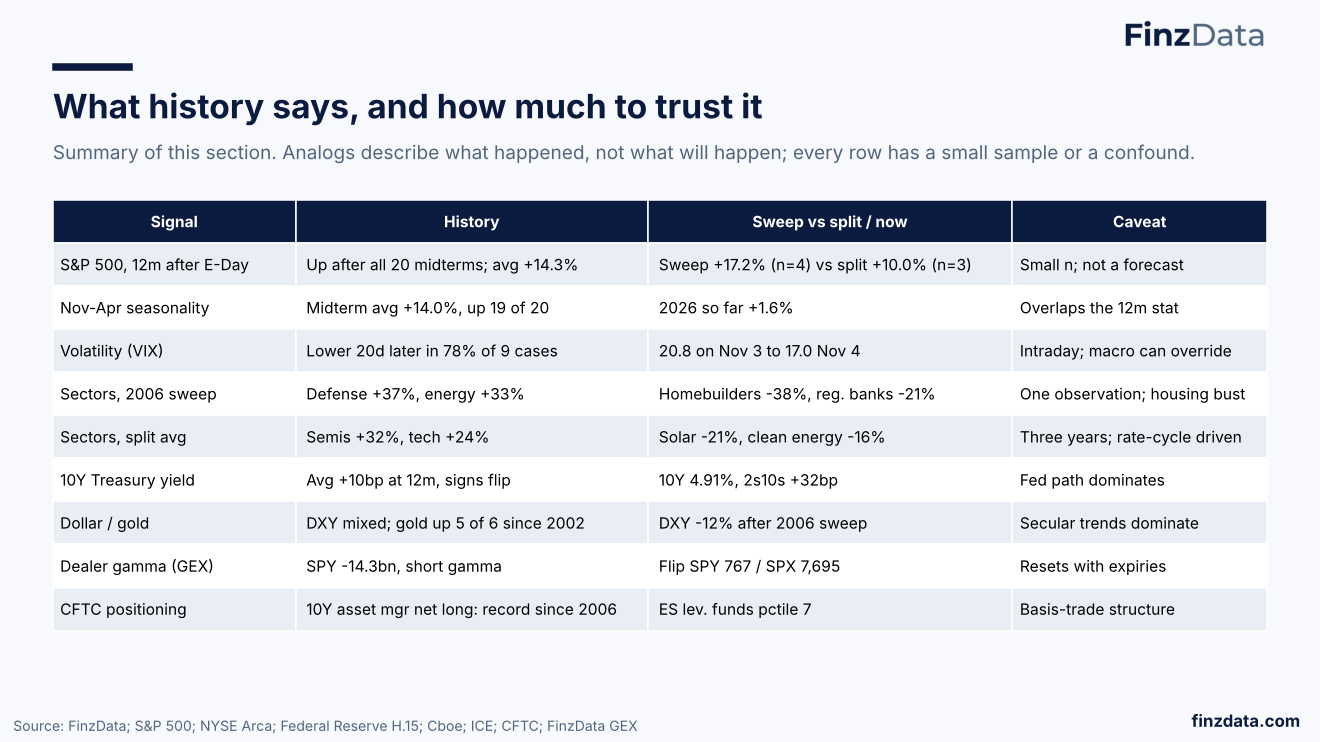
Summary of this section. Analogs describe what happened, not what will happen; every row has a small sample or a confound.
51. The playbook: sweep vs split
How each theme changes with a Democratic Senate, the risks, and the dates that matter
52. Trade map: what the sweep changes, theme by theme
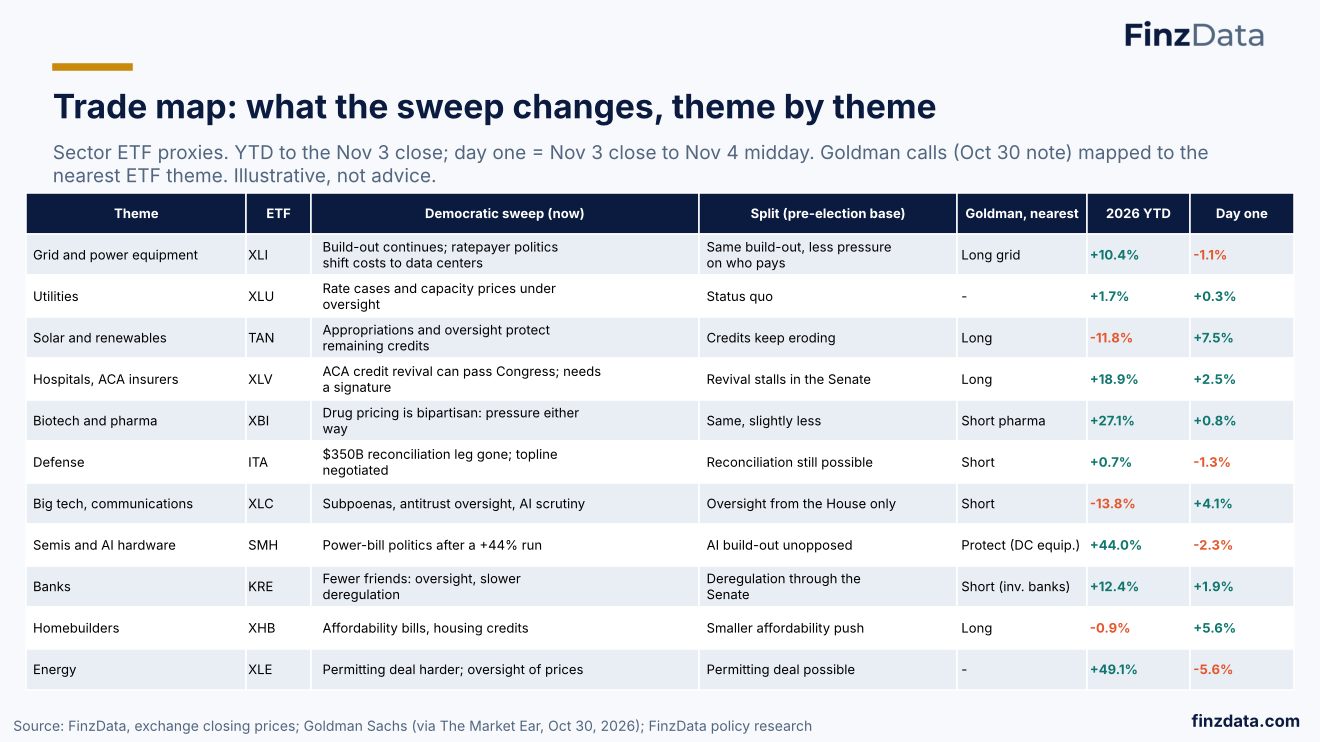
Sector ETF proxies. YTD to the Nov 3 close; day one = Nov 3 close to Nov 4 midday. Goldman calls (Oct 30 note) mapped to the nearest ETF theme. Illustrative, not advice.
53. Day one vs the 2006 sweep: the market is not trading history
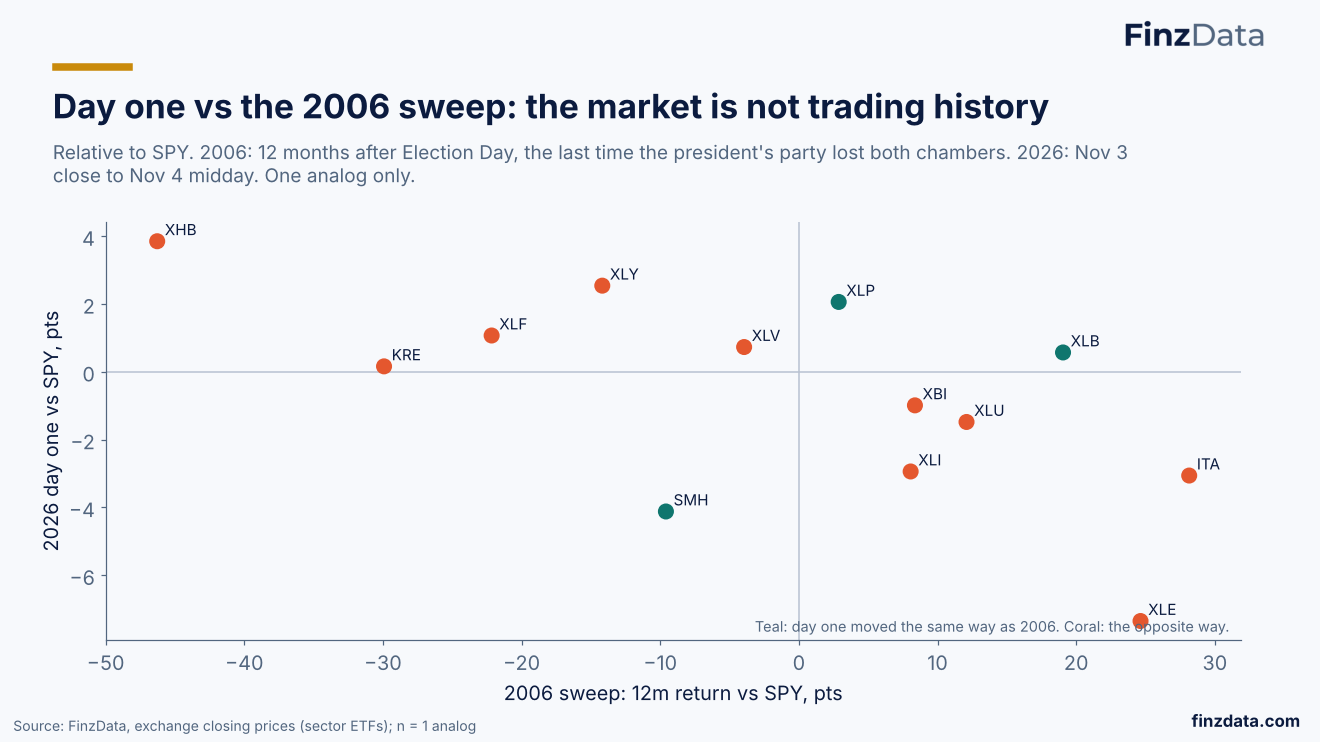
Relative to SPY. 2006: 12 months after Election Day, the last time the president's party lost both chambers. 2026: Nov 3 close to Nov 4 midday. One analog only.
54. What could go wrong
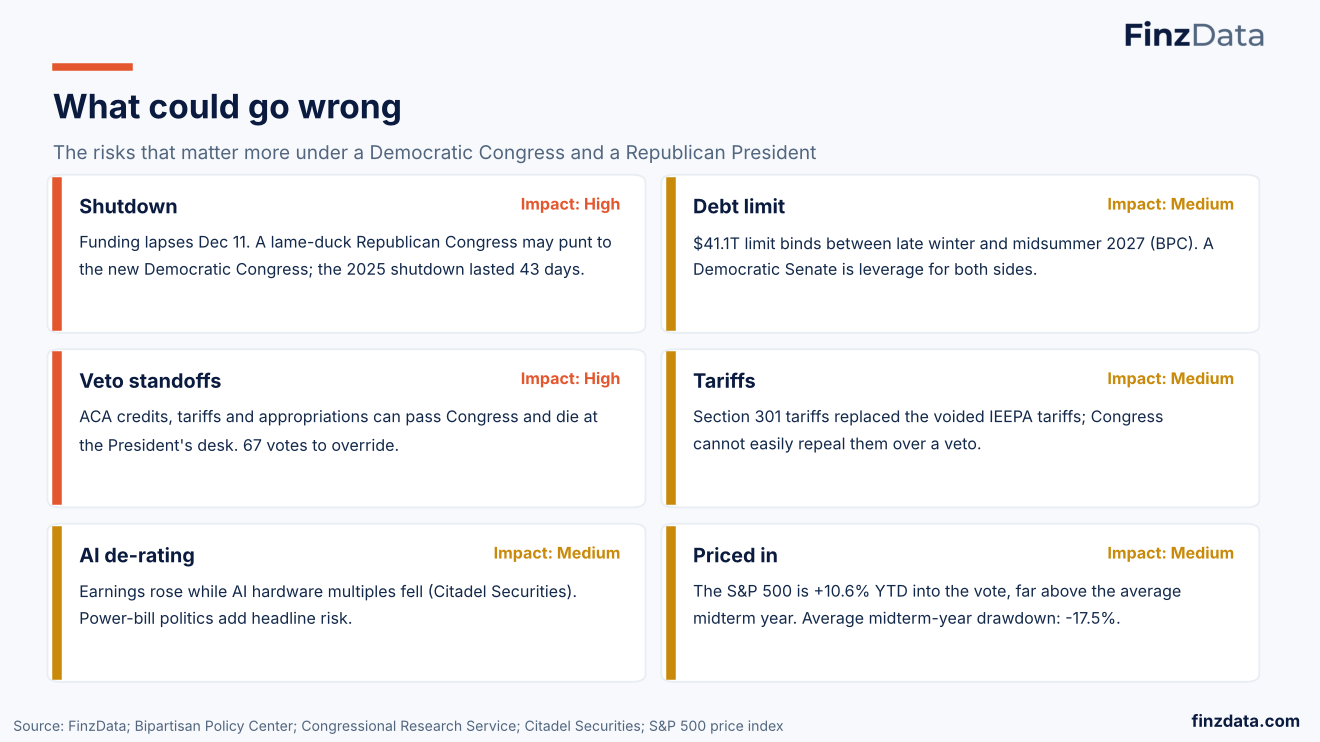
The risks that matter more under a Democratic Congress and a Republican President
55. The calendar to watch
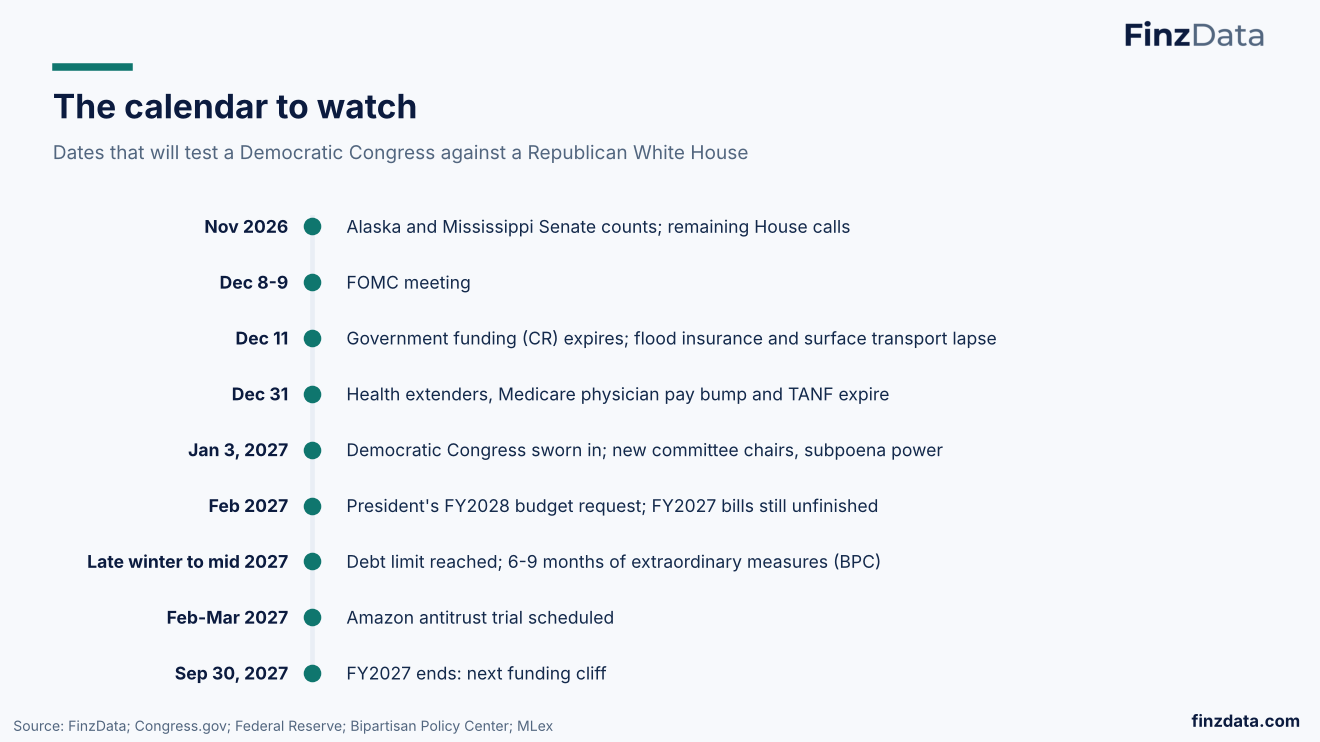
Dates that will test a Democratic Congress against a Republican White House
56. The data behind this deck
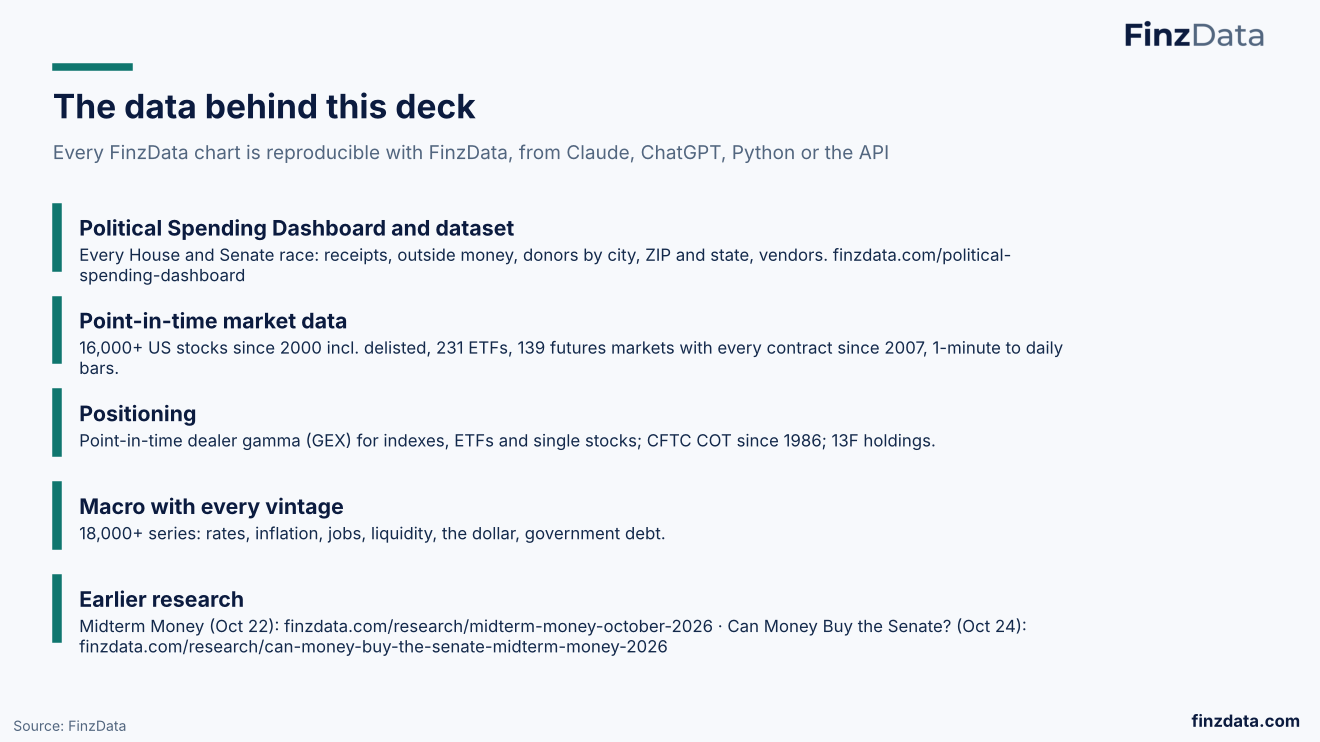
Every FinzData chart is reproducible with FinzData, from Claude, ChatGPT, Python or the API
57. Methodology and disclosures
Frequently asked questions
Who controls Congress after the 2026 midterms?
Democrats won both the House and the Senate, per AP and network projections on Nov 3-4, 2026. With President Trump in the White House, Washington is a divided government until January 2029.
What can a Democratic Congress do with a Republican President?
It controls the agenda, appropriations, subpoenas and Senate confirmations, but it cannot pass laws over a veto without 67 Senate votes. Expect oversight and must-pass fights, not sweeping new law.
How do stocks perform after midterm elections?
The S&P 500 was higher 12 months after all 20 midterm Election Days since 1946, averaging +14.3%. When the president's party lost both chambers (1946, 1954, 1994, 2006) it averaged +17.2%. These are small samples, not forecasts.
Which sectors does a Democratic sweep affect?
Goldman Sachs's sweep note favored grid infrastructure, renewables, hospitals and ACA insurers, and flagged drugmakers, defense, big tech, banks and crypto. See the trade map in section 05.
Download the deck (PDF, 57 slides) More research
Related: Political Spending Dashboard · Midterm Money (Oct 22) · Can Money Buy the Senate? (Oct 24)
Built for AI, quants, data scientists and financial analysts who backtest. Clean data. Real insights. Real alpha. finzdata.com. This material is for information only and is not investment advice. Data sources: FEC filings (FinzData PoliSpend); AP and network projections; Goldman Sachs; Citadel Securities (Scott Rubner, GMI); Congress.gov; CBO; Bipartisan Policy Center; Federal Reserve H.15; Cboe; ICE; CFTC; exchange closing prices.
Get FinzData research free, every morning
The daily brief: what moved, the macro releases that matter, positioning and liquidity, with charts. One email a day, free, unsubscribe anytime.
Topics and related searches
Elections and political spending Equity strategy and factors Volatility Options, gamma and GEX Interest rates and Treasury yields AI infrastructure and data-center capex
People also search
- who won the senate 2026
- did democrats win house and senate
- texas governor election results 2026
- what is the stock market reaction to midterms
- will the government shut down december 2026
- when does government funding expire
- are aca subsidies expired
- what are trump tariffs after ieepa
- s&p 500 performance after midterms
- how much was spent on 2026 midterms
- texas senate flip 2026
- divided government with trump president