
FinzData Research · Published 4 November 2026
Midterm Money: The Results
Democrats win the House and the Senate. What the record money did, what markets priced, and what history says comes next.
Get FinzData research free, every morning
The daily brief: what moved, the macro releases that matter, positioning and liquidity, with charts. One email a day, free, unsubscribe anytime.
Contents
- Democrats win control of Congress
- Markets had Democrats favored in both chambers
- The most expensive midterm on record
- The seven Senate flips and the money
- When the president's party lost both chambers
- 2026 vs a normal midterm year, and the morning after
- Follow the money with FinzData
- Frequently asked questions
1. Midterm Money: The Results
Our October decks followed the money into Election Day. This refresh lines up the result against what the money and the markets showed beforehand.
2. Democrats win control of Congress
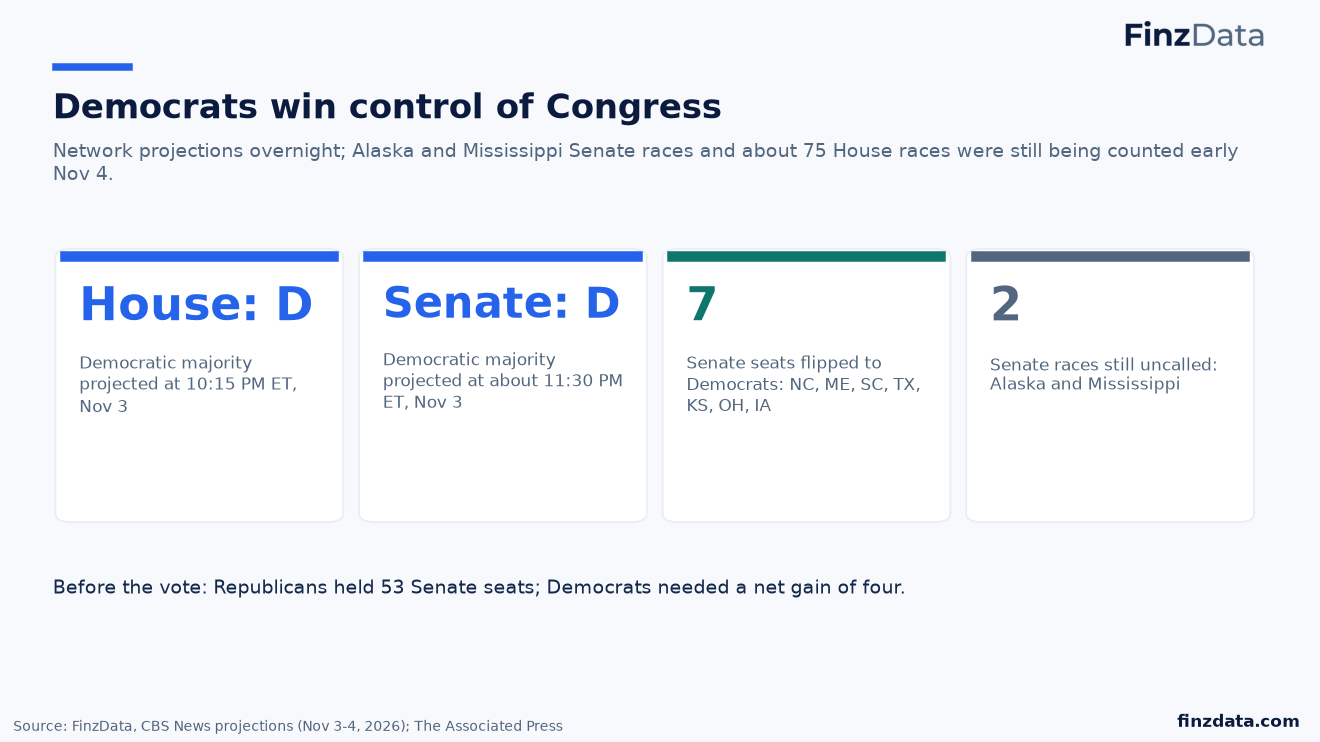
CBS News projected a Democratic House at 10:15 PM ET and a Democratic Senate shortly after 11:30 PM ET on November 3. Democrats flipped Senate seats in North Carolina, Maine, South Carolina, Texas, Kansas, Ohio and Iowa. Alaska and Mississippi were still being counted on the morning of November 4.
3. Markets had Democrats favored in both chambers
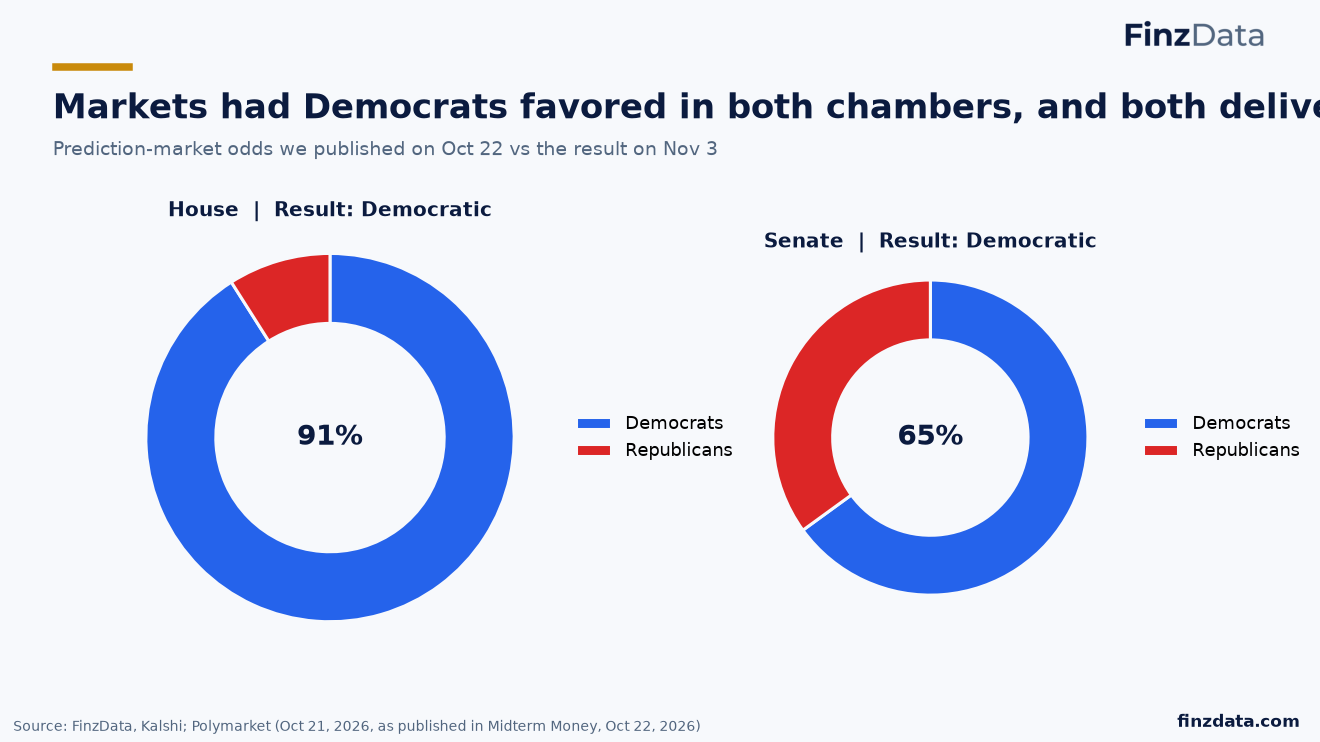
On October 22 we published prediction-market odds of 91% for a Democratic House and 65% for a Democratic Senate. Both chambers went Democratic. The Senate was the less certain call and produced the bigger surprise in scale, with seven flips.
4. The most expensive midterm on record
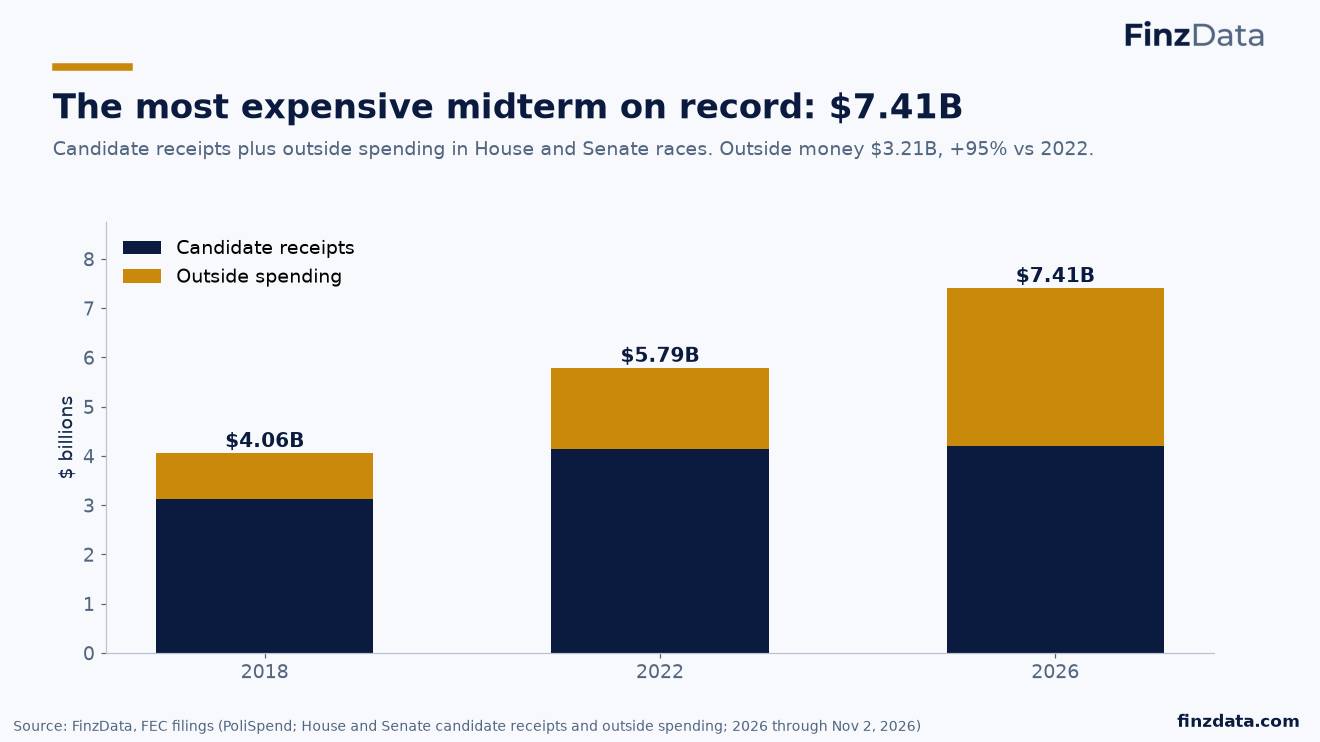
FEC filings in FinzData PoliSpend show $7.41B raised and spent in House and Senate races through November 2: $4.20B of candidate receipts and $3.21B of outside spending, almost double 2022's outside total. Explore it race by race on the Political Spending Dashboard.
5. The seven Senate flips and the money
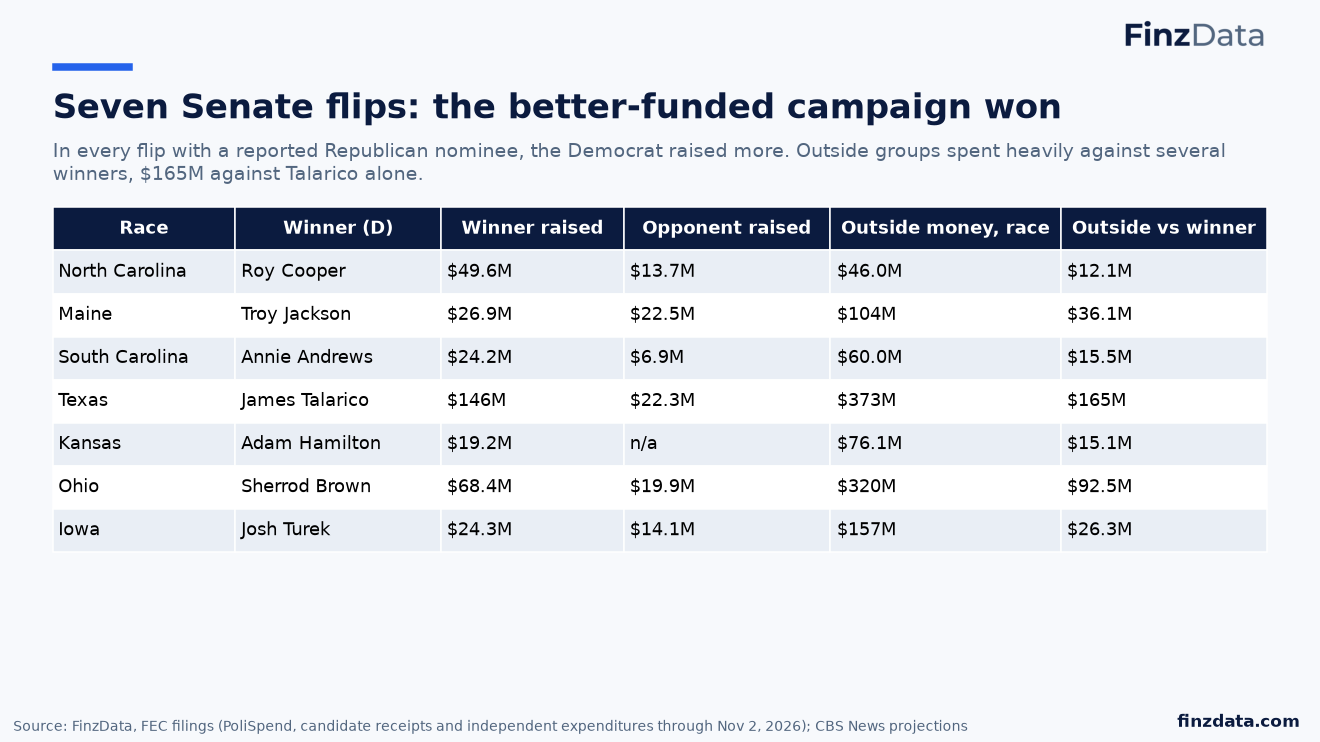
| Race | Winner (D) | Winner raised | Opponent raised | Outside money |
|---|---|---|---|---|
| North Carolina | Roy Cooper | $49.6M | $13.7M | $46.0M |
| Maine | Troy Jackson | $26.9M | $22.5M | $104M |
| South Carolina | Annie Andrews | $24.2M | $6.9M | $60.0M |
| Texas | James Talarico | $146M | $22.3M | $373M |
| Kansas | Adam Hamilton | $19.2M | n/a | $76.1M |
| Ohio | Sherrod Brown | $68.4M | $19.9M | $320M |
| Iowa | Josh Turek | $24.3M | $14.1M | $157M |
Candidate money tracked the winners; outside money did not decide these races. Outside groups spent $165M opposing James Talarico in Texas and he still won. Kansas: the Republican nominee's receipts are not in our top-candidate file, so we show n/a.
6. When the president's party lost both chambers
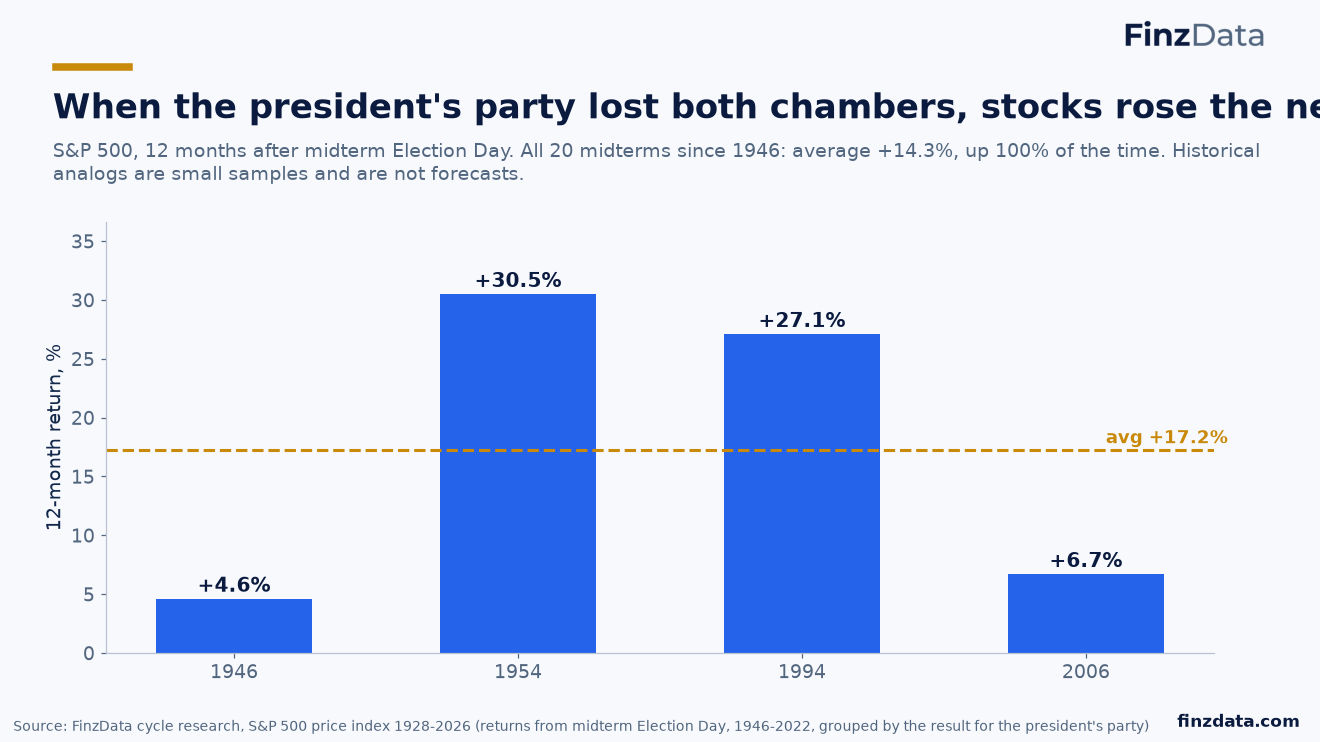
The closest analogs to 2026 are midterms where the president's party lost both chambers: 1946, 1954, 1994, 2006. The S&P 500 rose in the 12 months after each, averaging +17.2%. Across all 20 midterms since 1946 the average was +14.3% and stocks were higher every time. These are small samples, not forecasts.
7. 2026 vs a normal midterm year, and the morning after
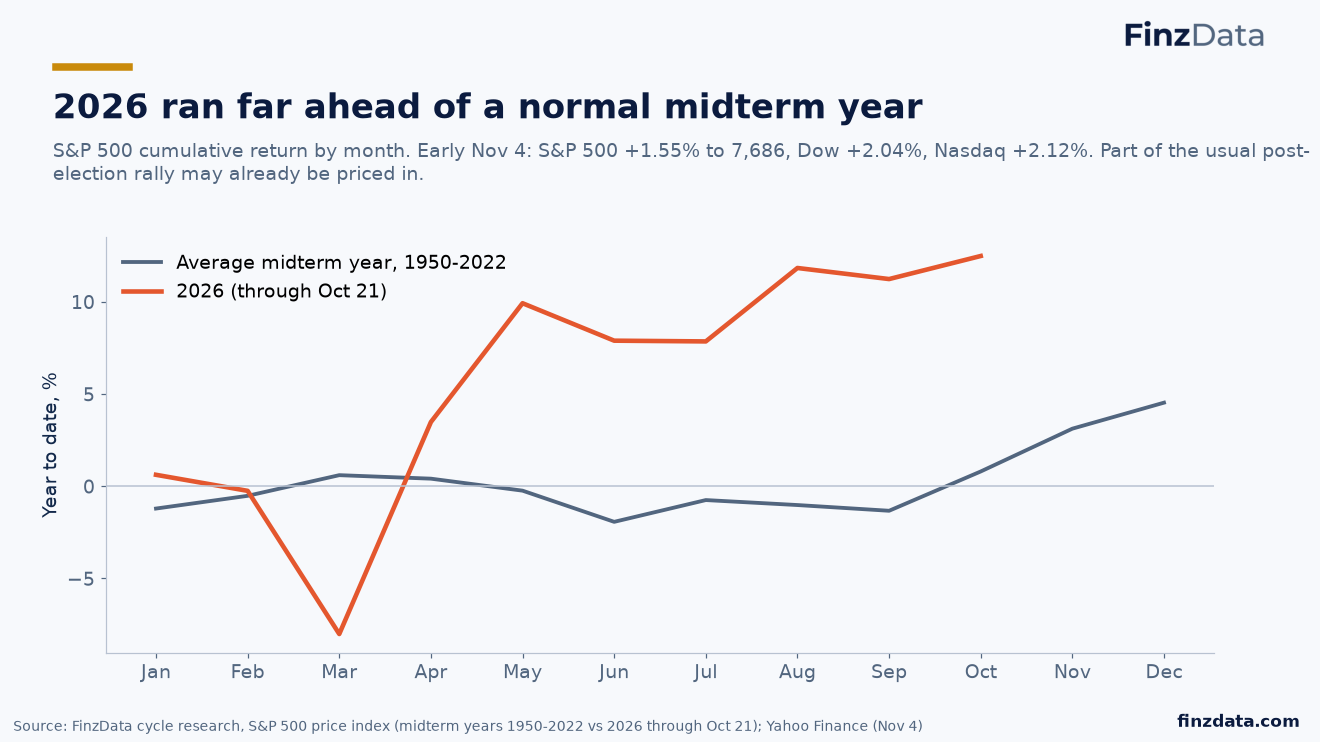
2026 was already far ahead of the average midterm year through October. In early trading on November 4 the S&P 500 rose +1.55% to 7,686, the Dow +2.04% and the Nasdaq +2.12%. With a strong year already in the price, part of the usual post-election rally may already be done.
8. Follow the money with FinzData
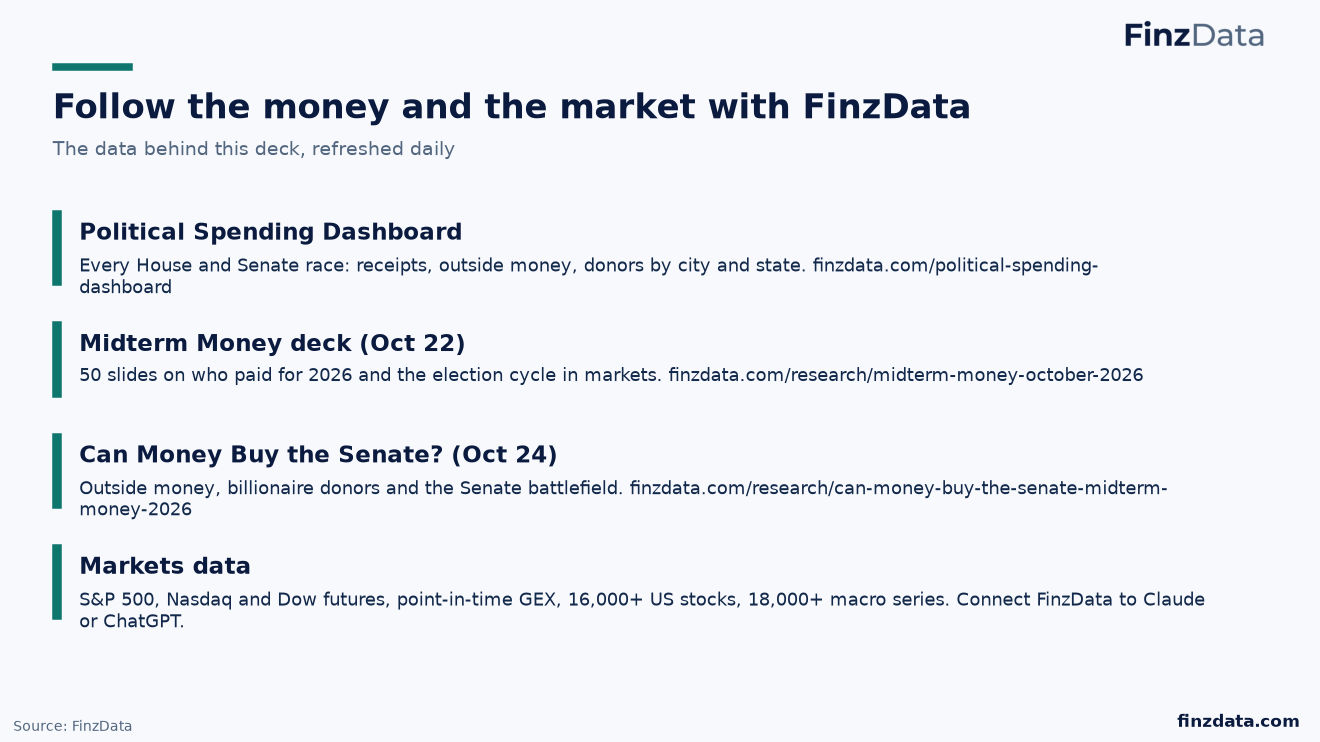
Use the Political Spending Dashboard and the political spending dataset, or ask FinzData from Claude or ChatGPT: "Show me outside spending in the Texas Senate race" or "How did the S&P 500 do 12 months after past midterms?"
Frequently asked questions
Who won the 2026 midterms?
Democrats won control of both the House and the Senate, per network projections on election night, November 3, 2026.
How much was spent on the 2026 midterms?
FEC filings show $7.41B in House and Senate candidate receipts and outside spending through November 2, 2026, a record for a midterm.
How do stocks do after midterm elections?
Since 1946 the S&P 500 has been higher 12 months after every midterm Election Day, averaging +14.3%. Past results are small samples, not forecasts.
Download the deck (PDF, 8 slides) More research
Earlier research: Midterm Money (Oct 22) · Can Money Buy the Senate? (Oct 24) · Political Spending Dashboard
Built for AI, quants, data scientists and financial analysts who backtest. Clean data. Real insights. Real alpha. finzdata.com. This material is for information only and is not investment advice. Data sources: FEC filings (FinzData PoliSpend); CBS News and AP election projections; Kalshi; Polymarket; S&P 500 price index; Yahoo Finance.
Get FinzData research free, every morning
The daily brief: what moved, the macro releases that matter, positioning and liquidity, with charts. One email a day, free, unsubscribe anytime.
Topics and related searches
Elections and political spending Equity strategy and factors Volatility Options, gamma and GEX Interest rates and Treasury yields AI infrastructure and data-center capex
People also search
- who won the senate 2026
- who won the house and senate 2026
- what are the midterm election results 2026
- did democrats win congress 2026
- who won texas governor 2026
- what happened in the 2026 midterms
- will the stock market go up after midterms
- is the government going to shut down 2026
- what is the debt ceiling deadline 2026
- did tariffs change after midterms
- are aca subsidies expired
- how much was spent on 2026 elections