
FinzData Research · Published 14 October 2026
September 2026 CPI: an energy shock meets a firming core
Gasoline did most of the work in September, but core inflation is running at 3.4% annualized over three months, and the bond market is pricing tighter real policy rather than higher inflation expectations. A 15-slide deep dive on CPI and what it means for the Fed, Treasuries, CPI-day volatility and sectors.
Contents
- Four things that matter in this report
- Energy led, and everything underneath edged up
- The 3-month pace is running ahead of the 12-month rate
- Fuel costs are reaching travel services
- Tech goods are heating up; insurance and drugs are falling
- Core rarely follows energy shocks
- One exception, and it started with core rising
- Yields are rising on real rates, not inflation expectations
- CPI day became a market event again in 2022
- In energy-hot regimes, growth lagged and energy led
- What the evidence points to, by asset class
- Five readings decide which history repeats
- How the numbers were built
- Every chart in this deck is one API call
1. An energy shock meets a firming core
Purpose: a one-hour read of the September CPI. Thesis: energy did most of the work this month, but core momentum is now running well above its 12-month rate, and the bond market is pricing tighter real policy rather than higher inflation expectations.
2. Four things that matter in this report
Executive summary
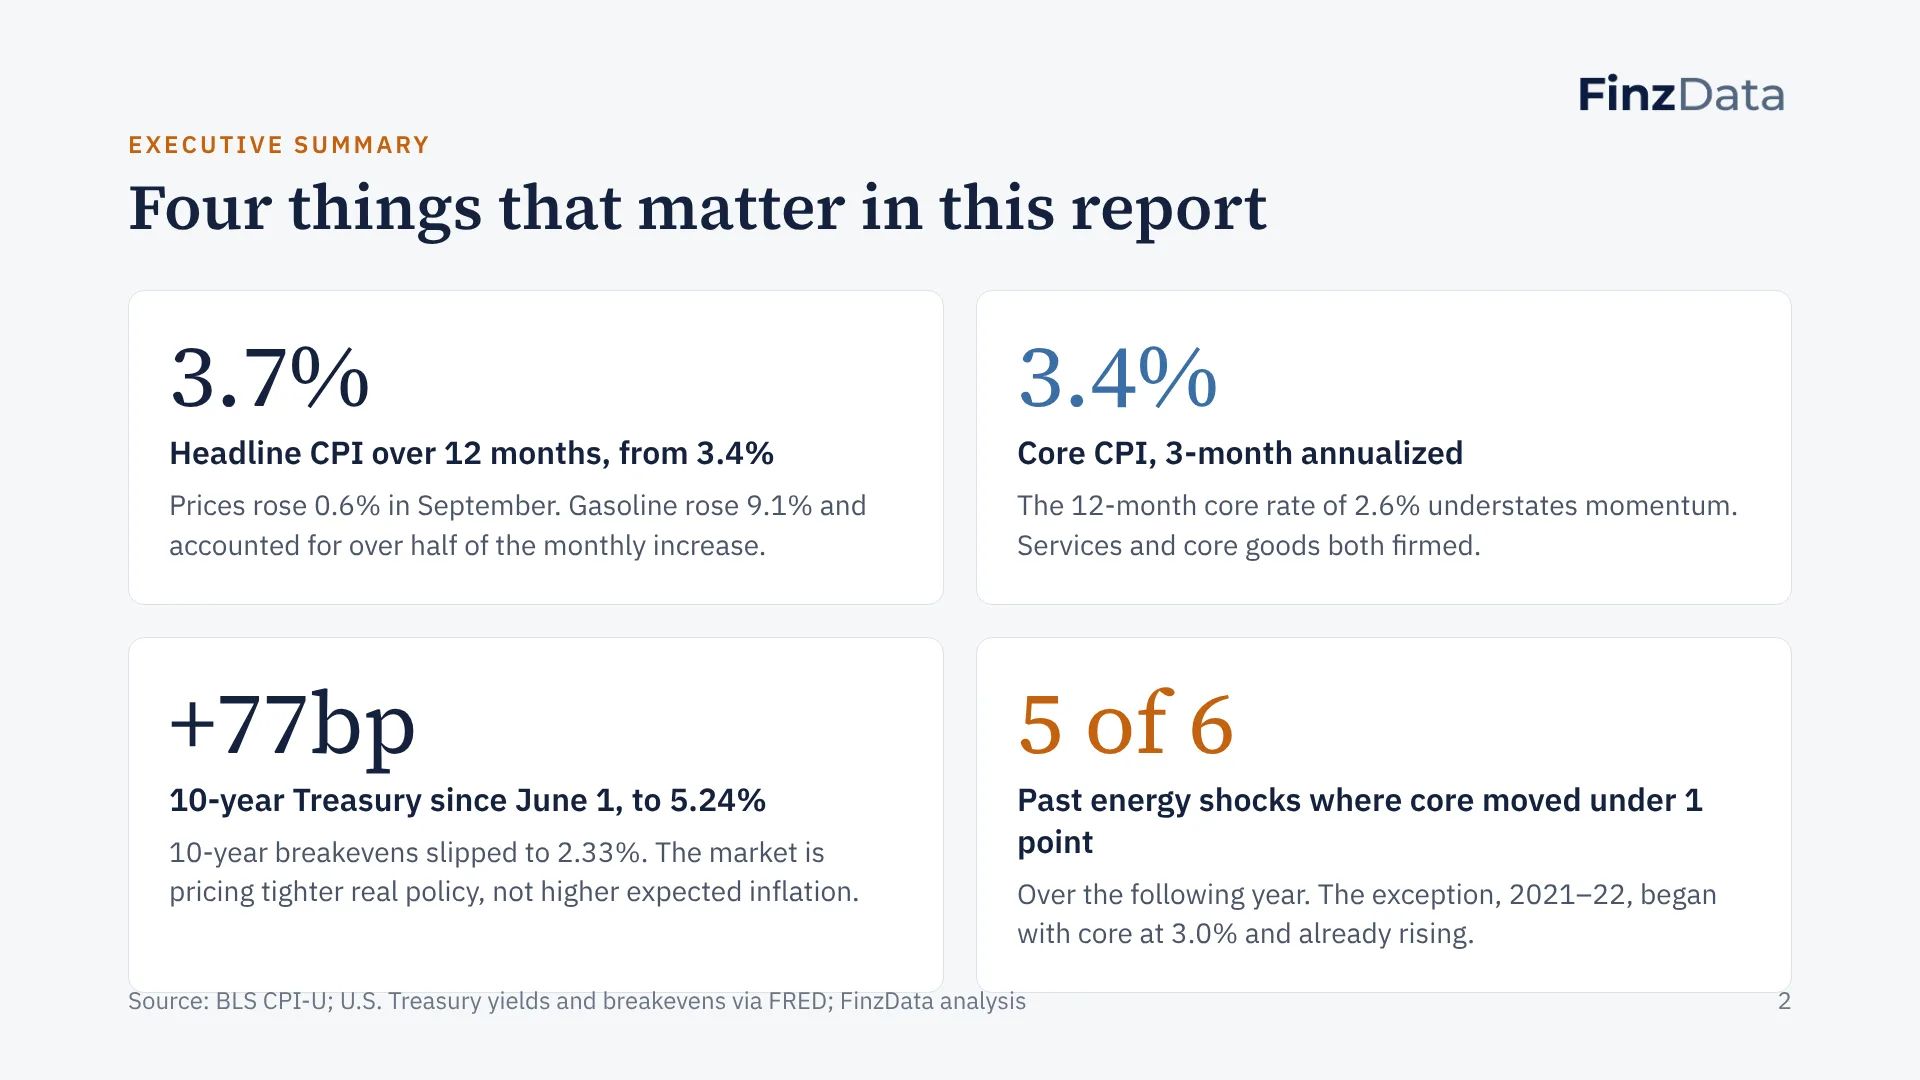
Lead with momentum, not the headline. The headline is energy; the risk is that core's 3-month pace is now 3.4% while the bond market, through rising real yields, is already leaning toward a tighter Fed.
3. Energy led, and everything underneath edged up
The print
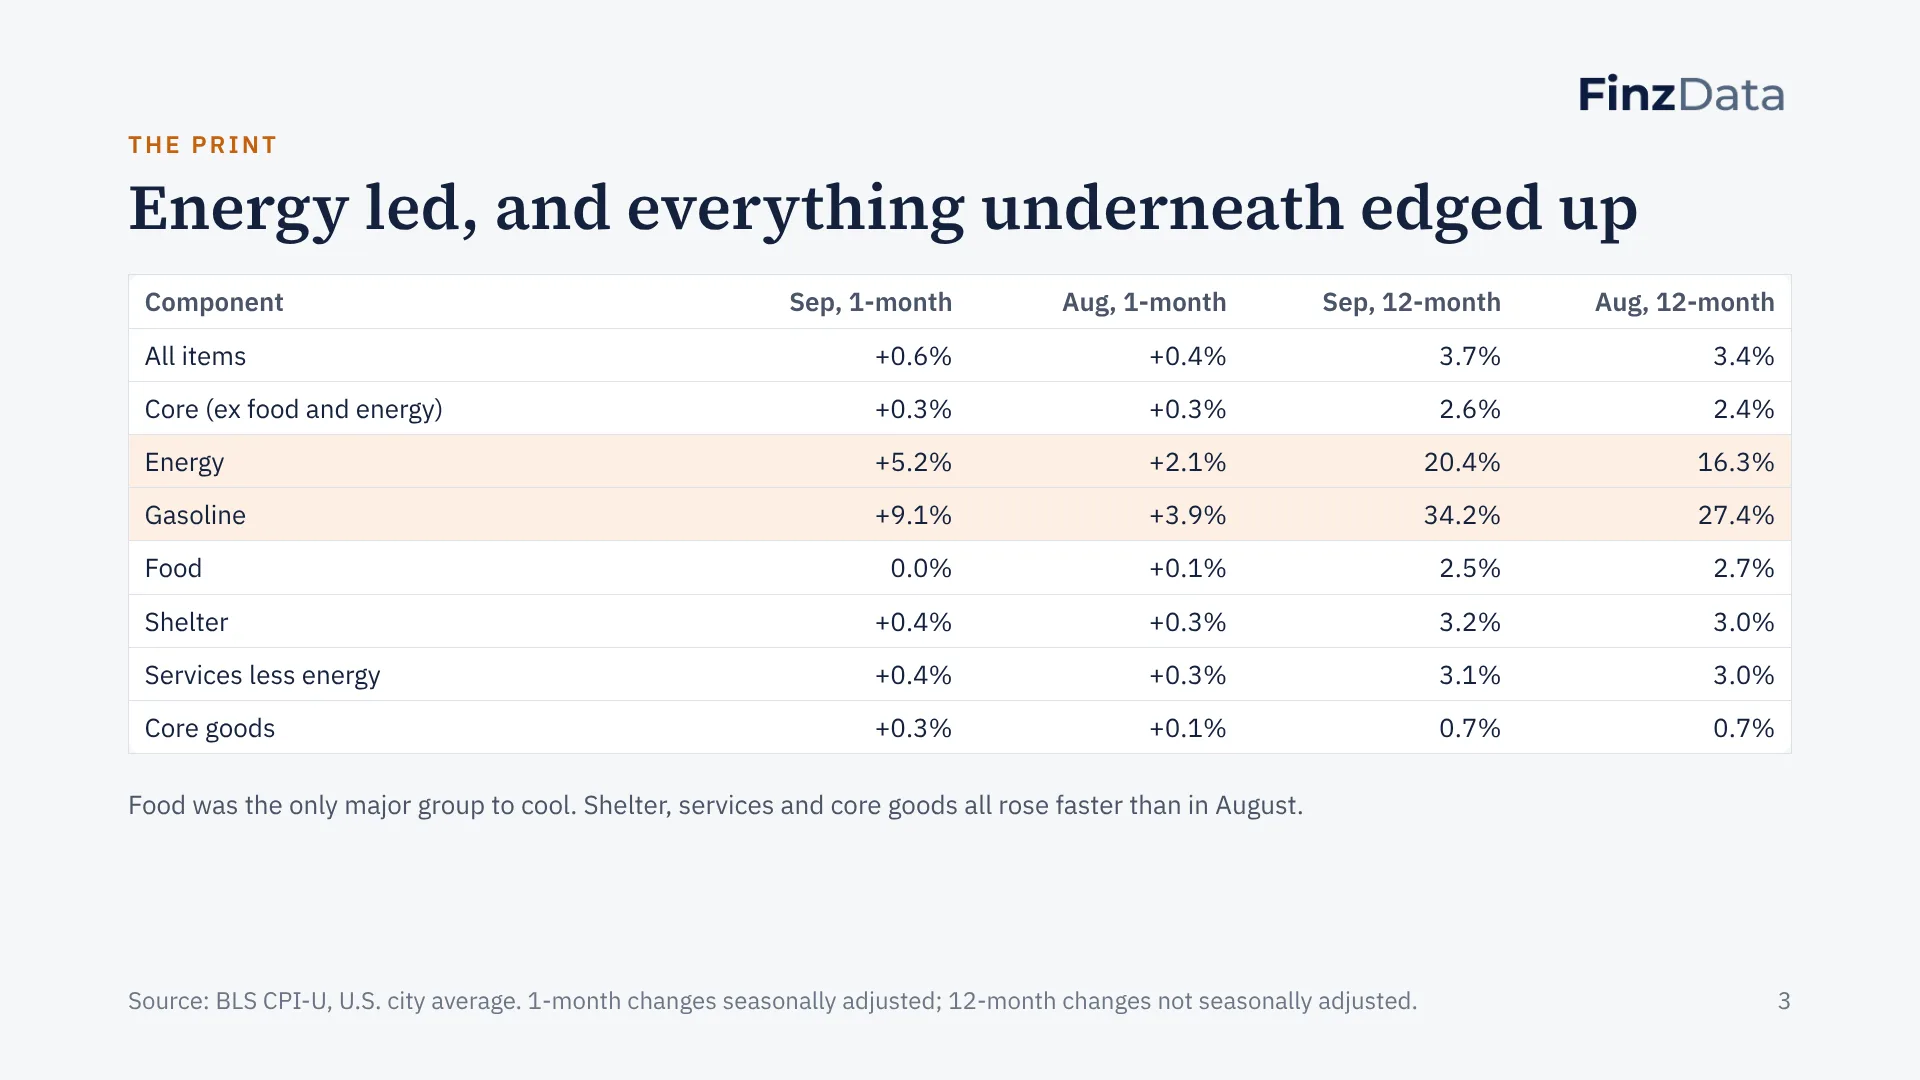
BLS: gasoline accounted for over half of the monthly all-items increase. Note that every core block accelerated or held; food was the only offset.
4. The 3-month pace is running ahead of the 12-month rate
Momentum
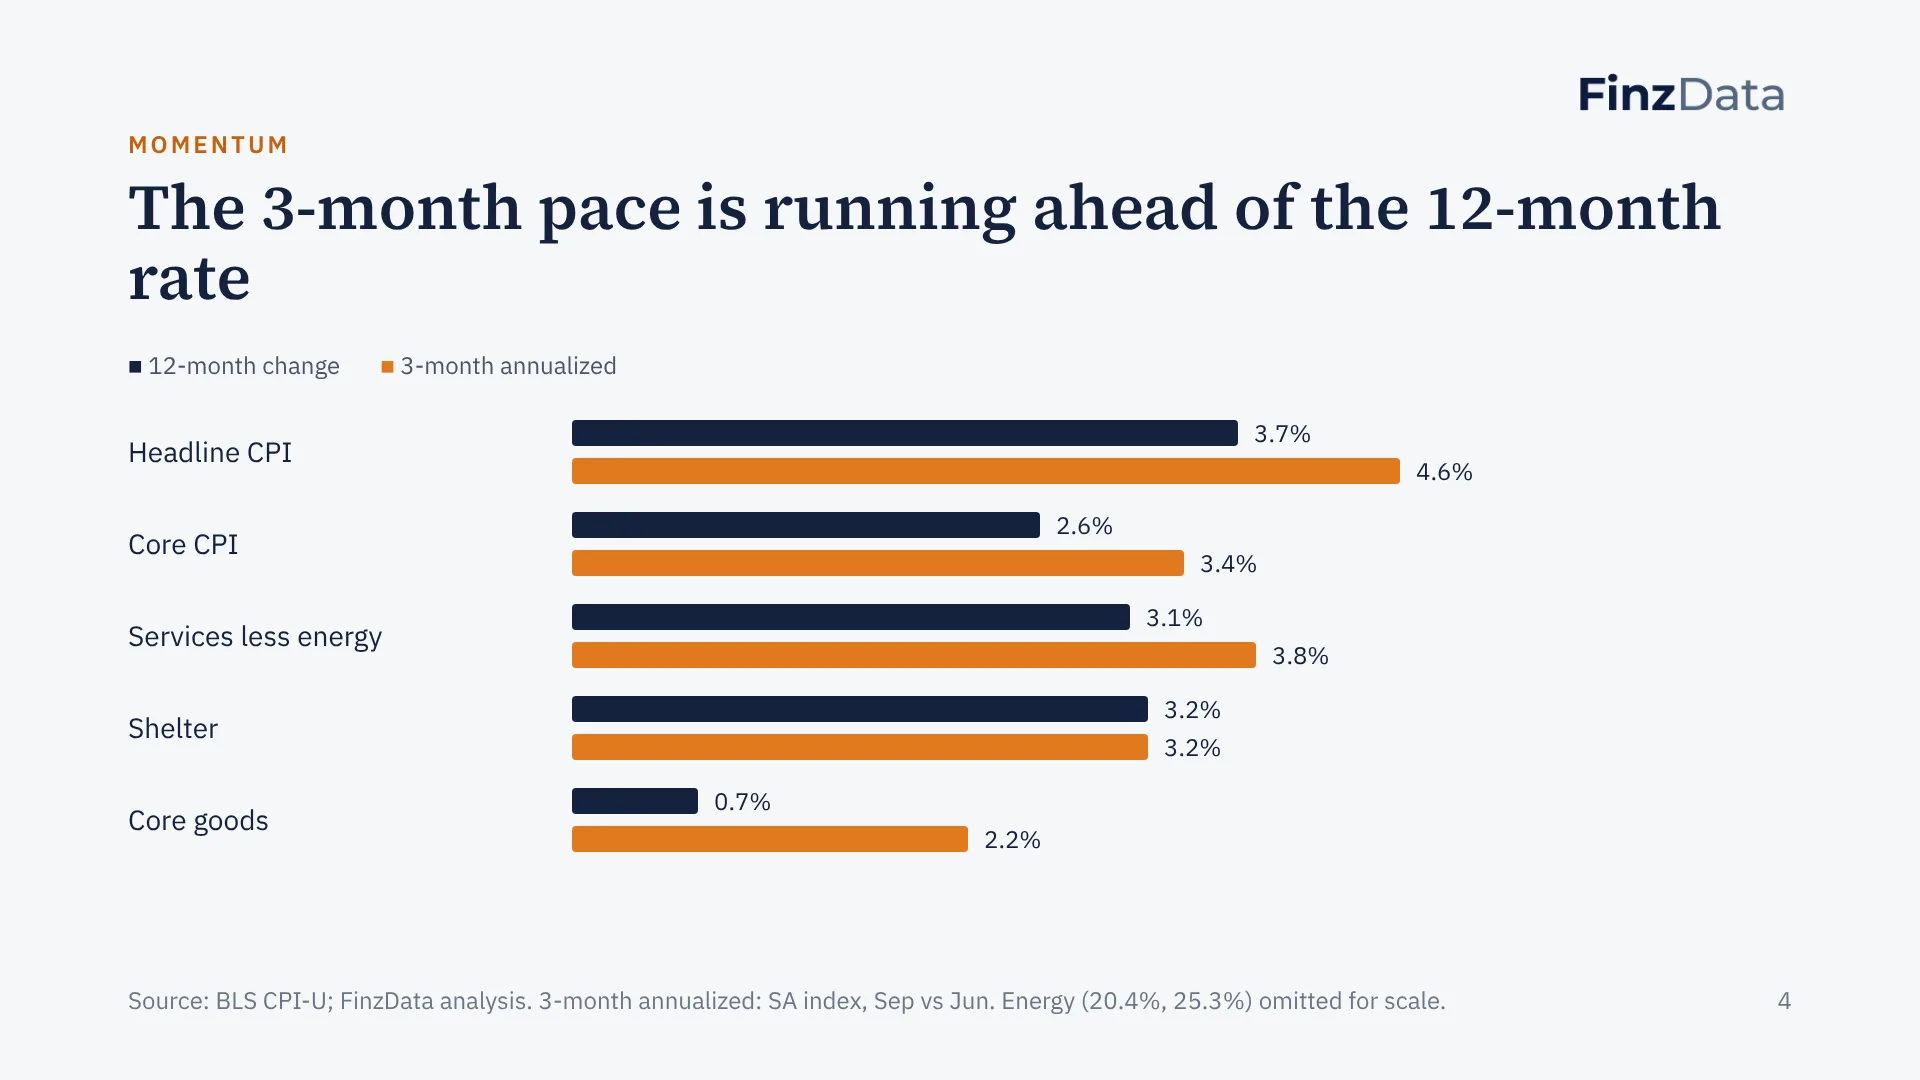
The key chart. Core at 3.4% annualized over three months versus 2.6% over twelve. Core goods tripled their pace. Shelter is the only block running flat. Arithmetic, not a forecast: if this pace held, the 12-month core rate would drift toward 3.4% as older, softer months roll off.
5. Fuel costs are reaching travel services
Second-round effects
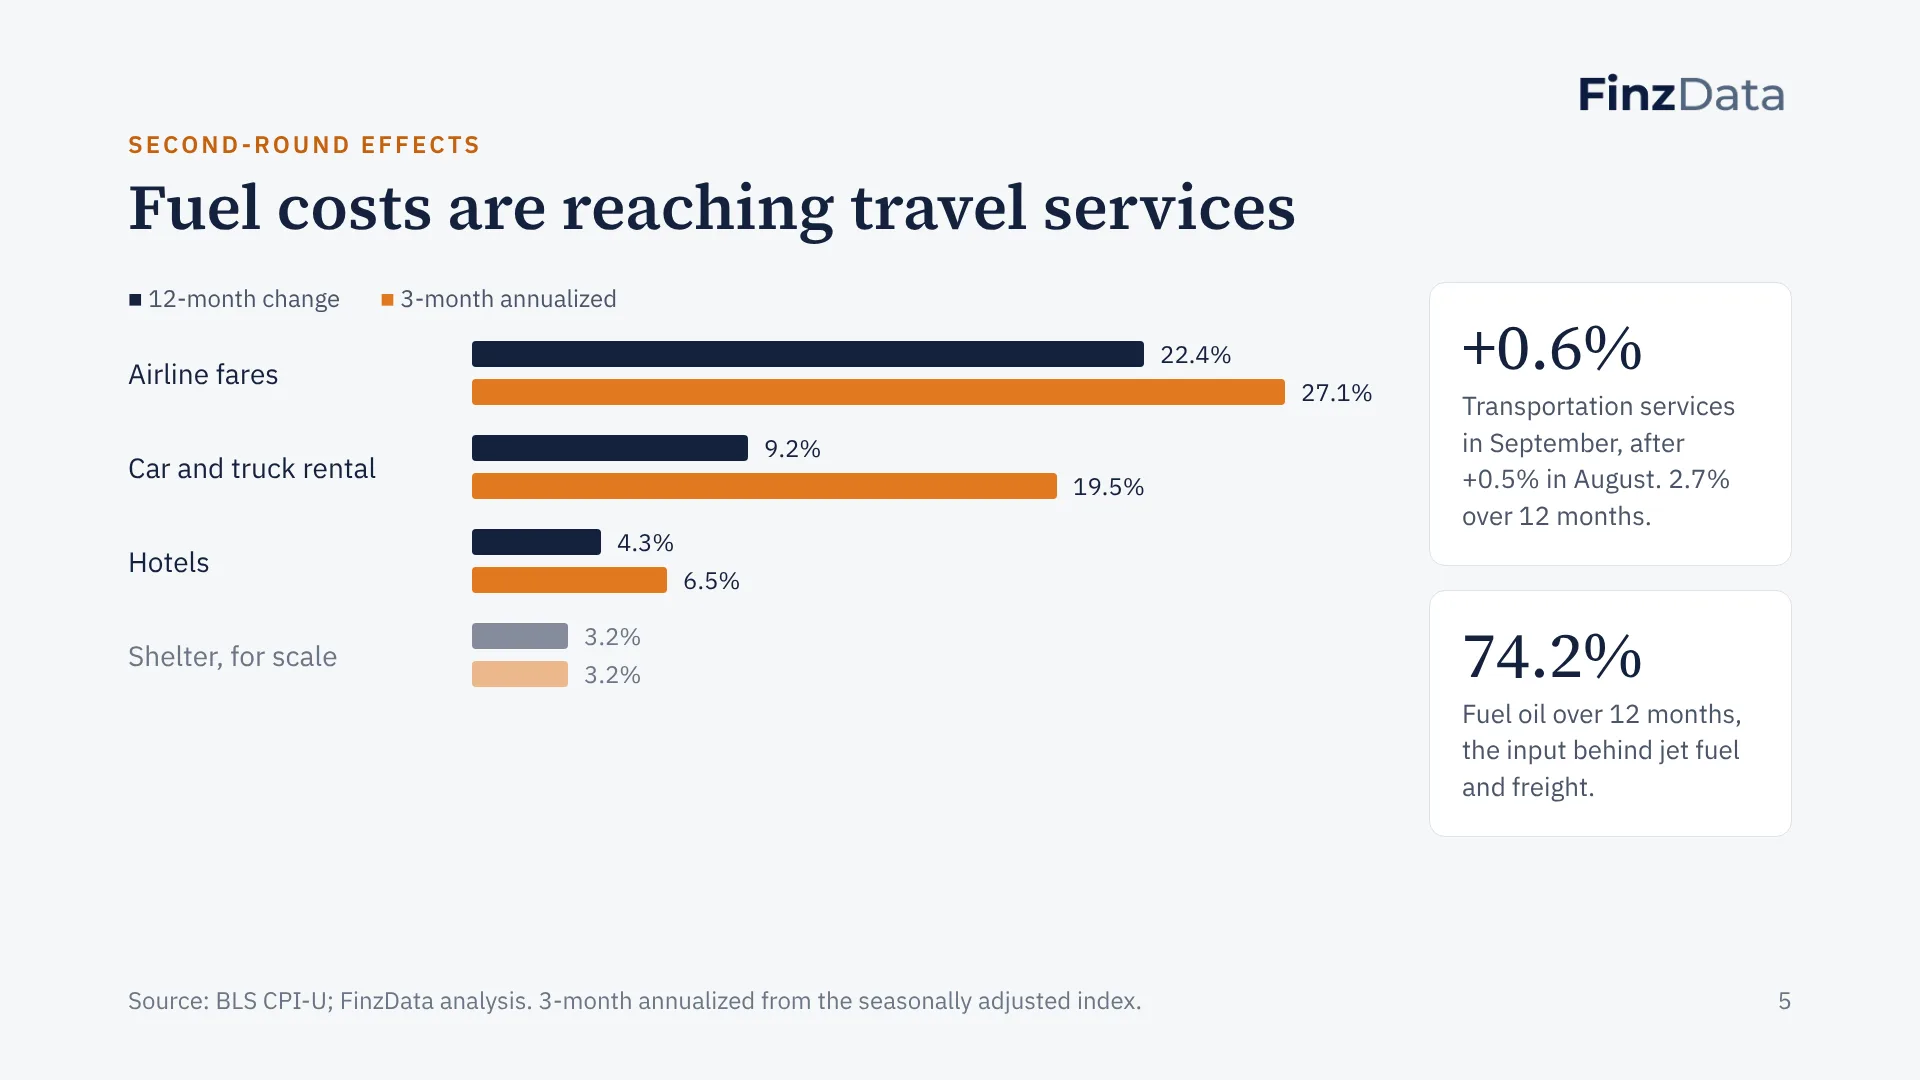
This is where an energy shock turns into services inflation, the stickier part the Fed weighs most. Car rental's 3-month pace is double its 12-month rate. Watch whether this spreads beyond travel.
6. Tech goods are heating up; insurance and drugs are falling
Dispersion
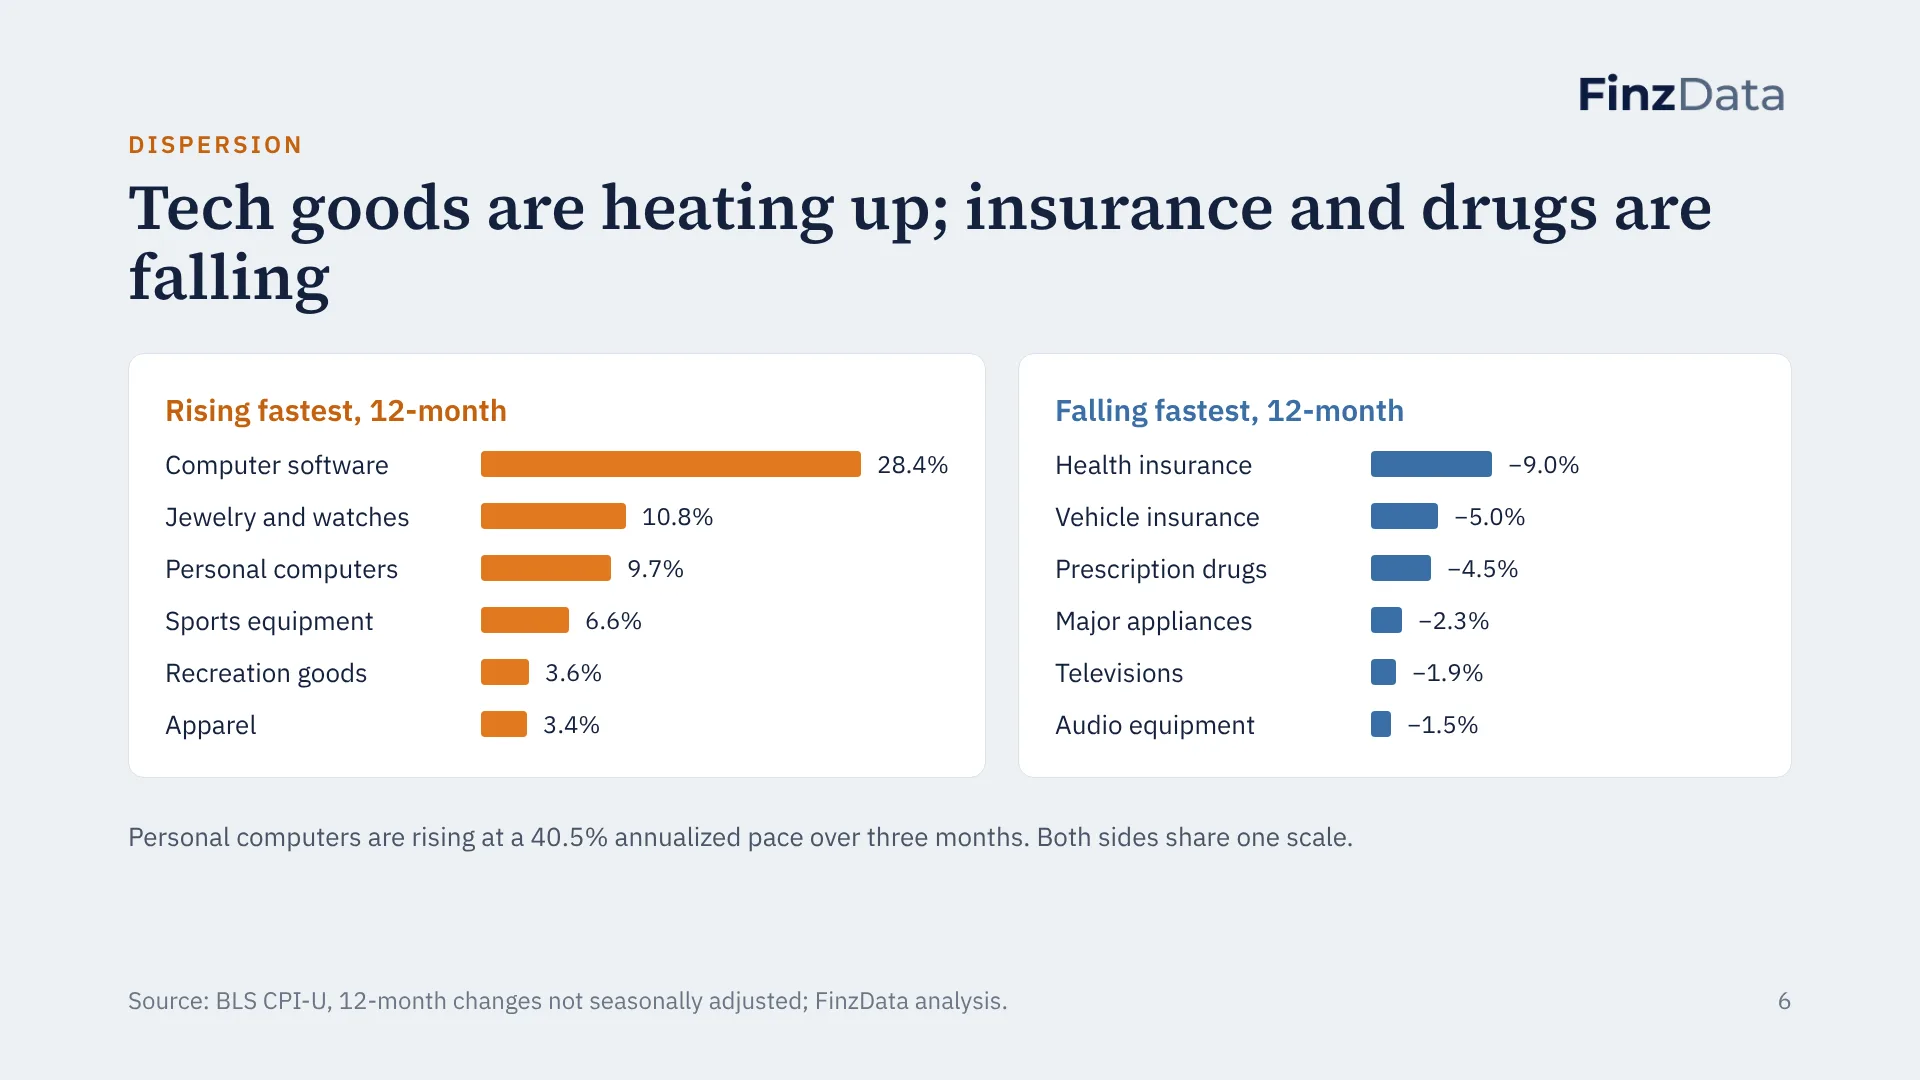
The offsets are concentrated in insurance and drugs, which are measured with administrative methods and can swing. The upside is in tech hardware and software, which is where import-cost pass-through would show first. We do not attribute causes here; the data shows where, not why.
7. Core rarely follows energy shocks
History
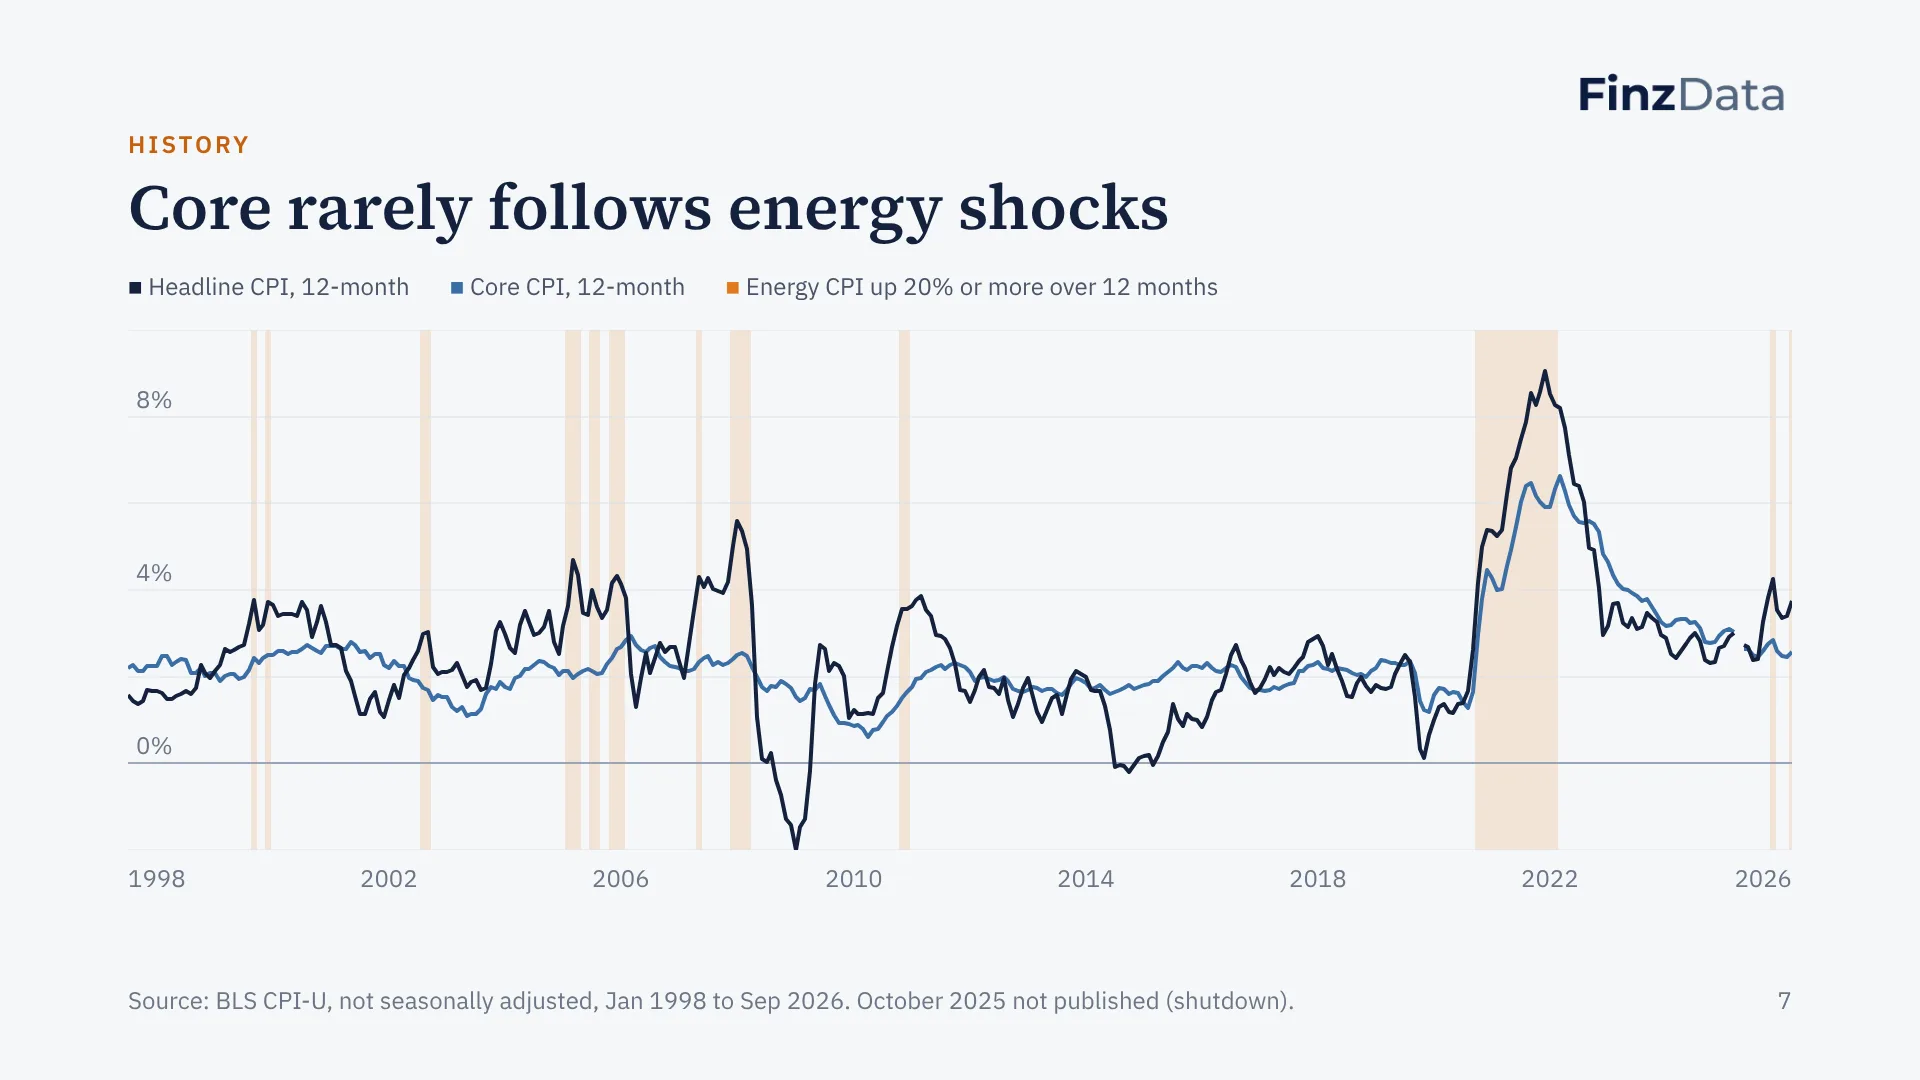
Shaded: every month since 1998 with energy CPI up at least 20% over 12 months. They group into six episodes before 2026: 2000, 2003, 2005 to 2006, 2007 to 2008, 2011 and 2021 to 2022. Core stayed in a narrow band through all of them except 2021 to 2022, when demand and supply shocks hit at once.
8. One exception, and it started with core rising
Energy shock episodes since 1998
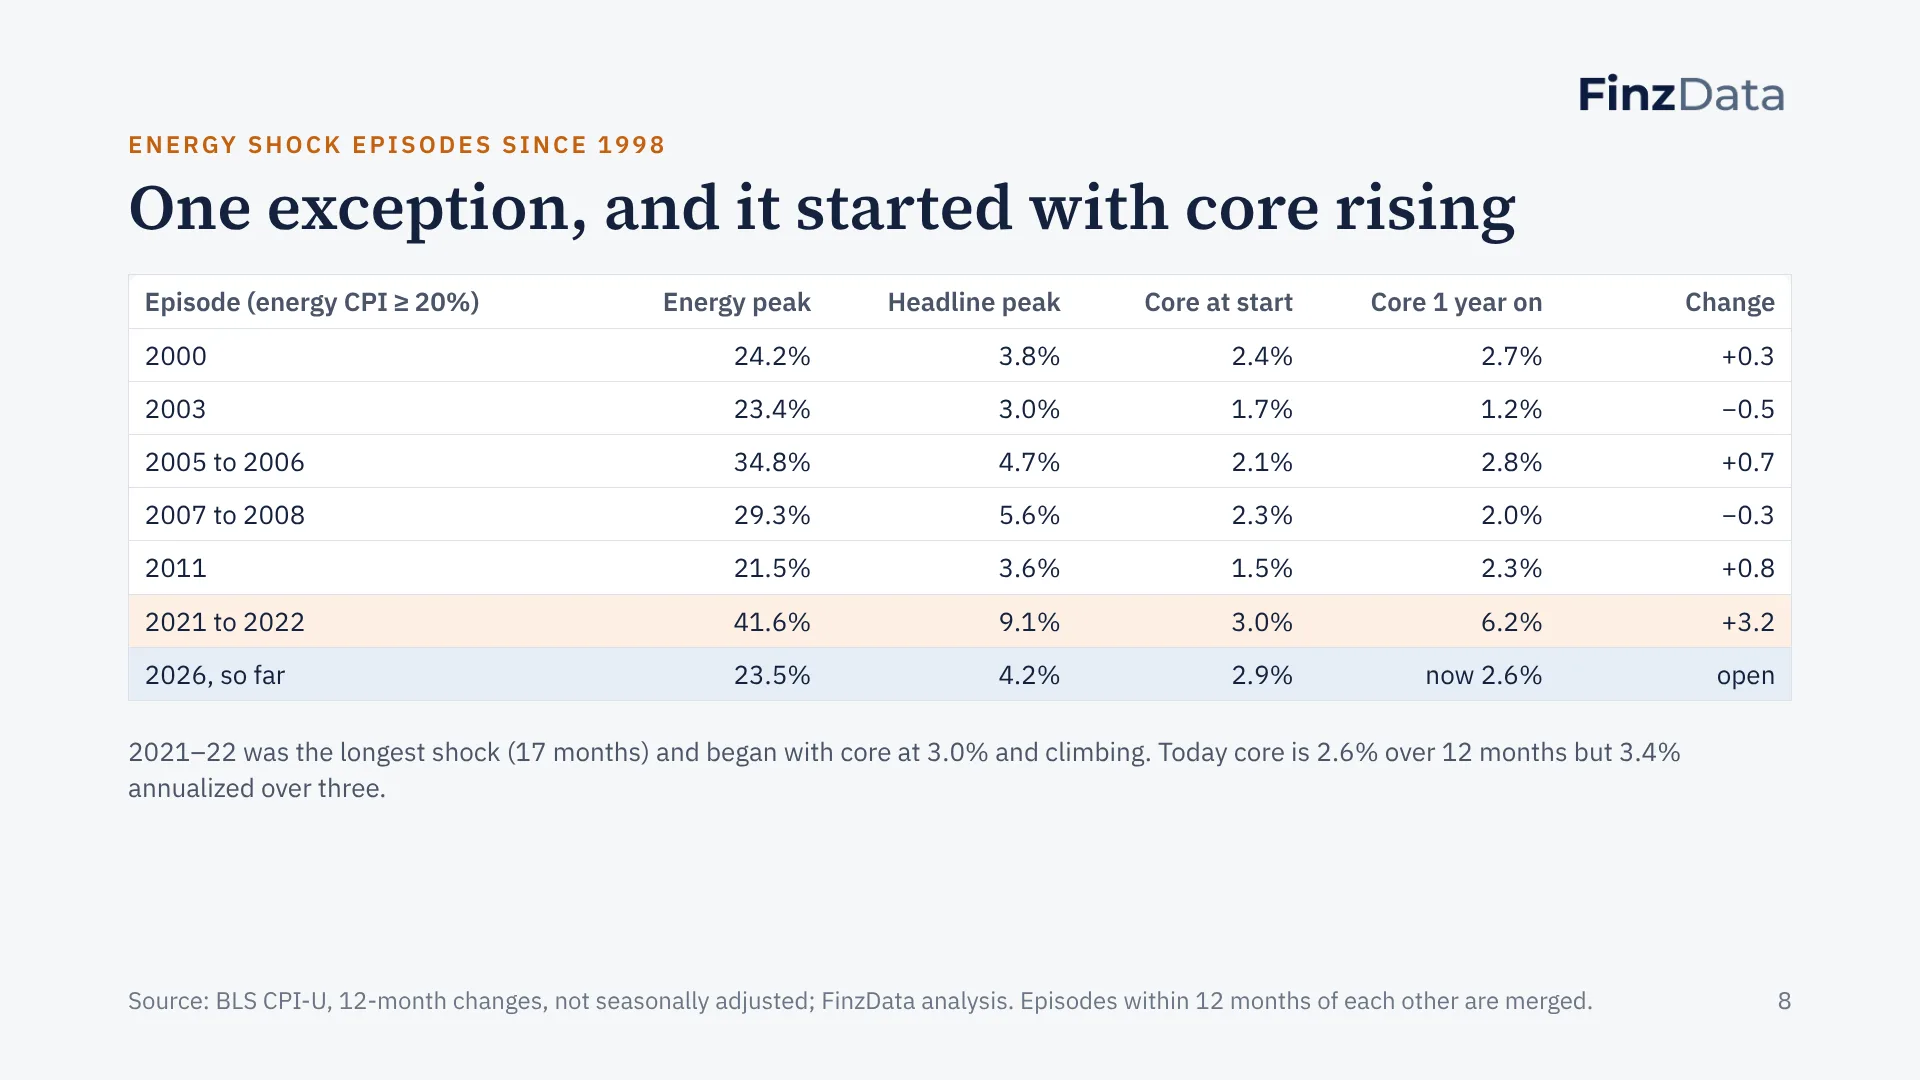
Six episodes is a small sample, so treat this as a base rate, not a law. The useful split is the starting state of core: when core was stable, energy shocks passed. When core was already accelerating, the shock fed it. The 3-month core pace is the tell to watch.
9. Yields are rising on real rates, not inflation expectations
Rates
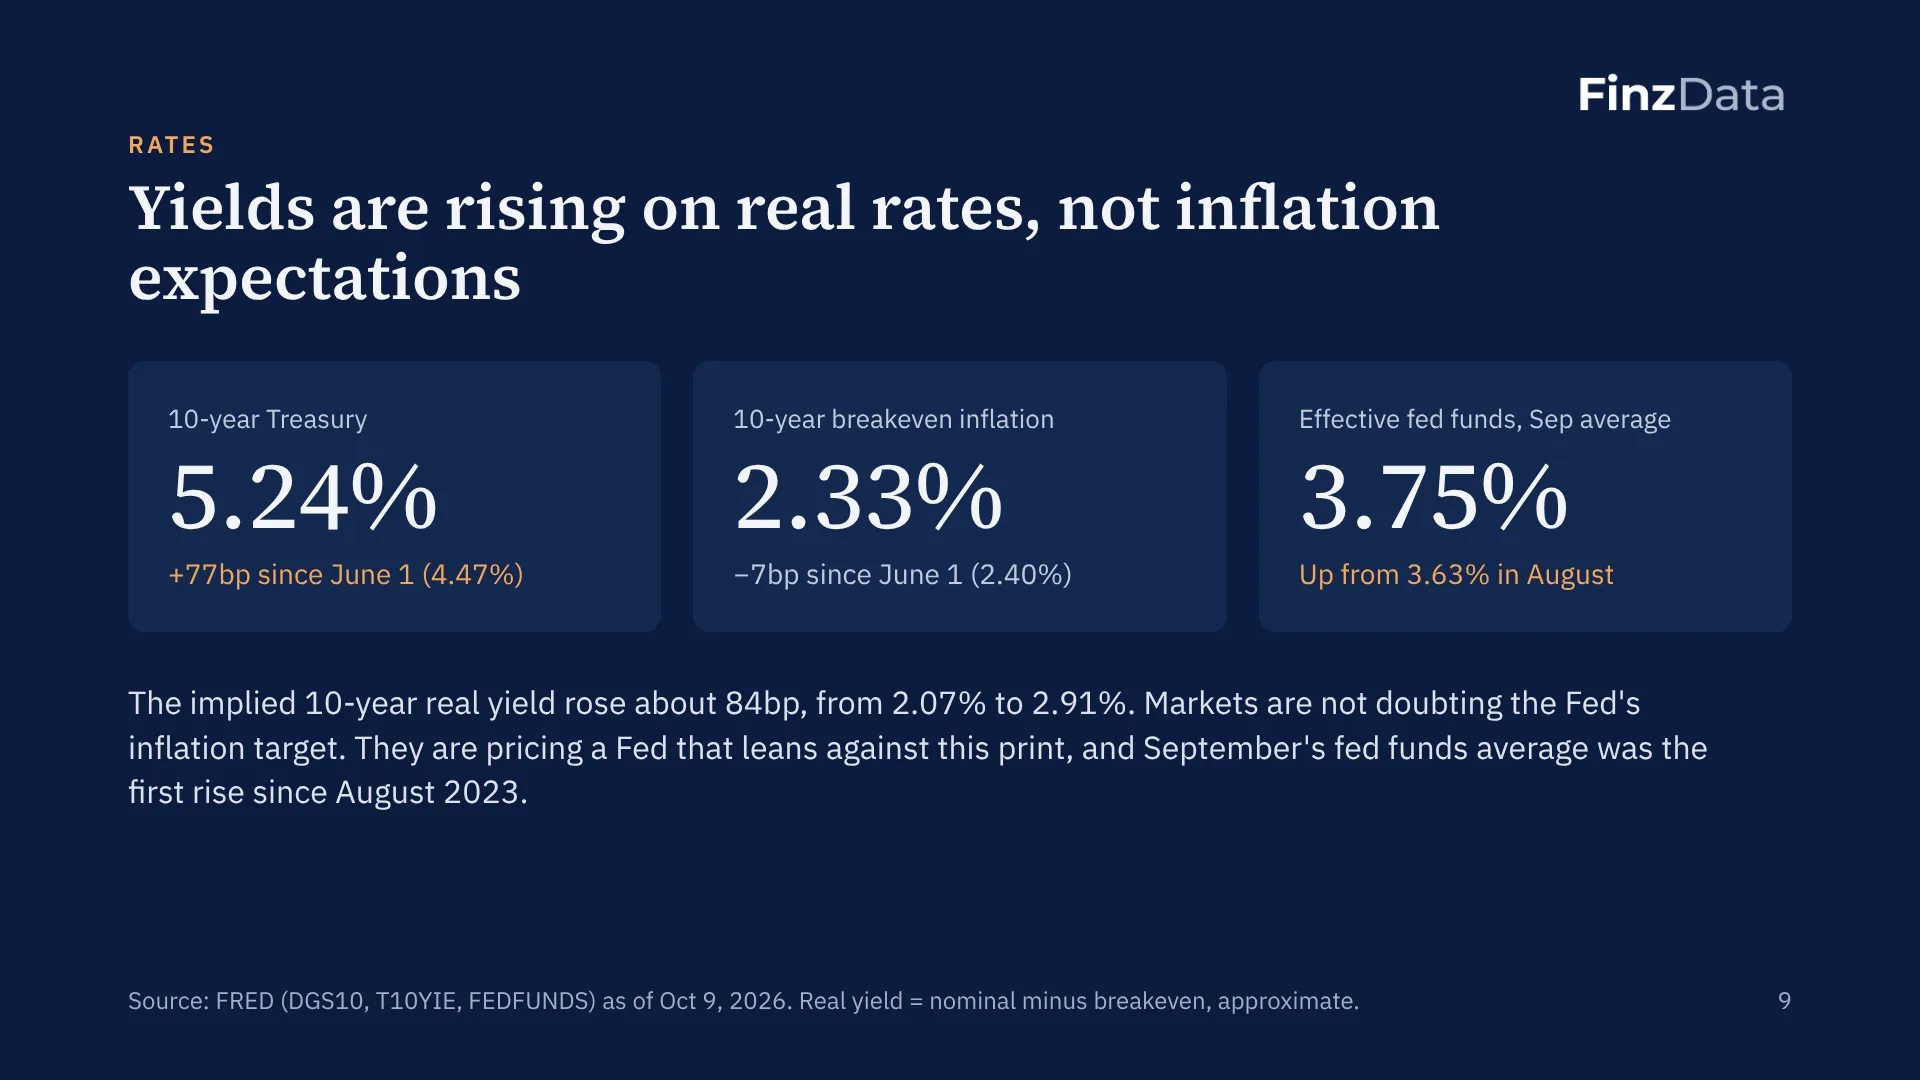
This is the key nuance for rates desks. If inflation expectations were drifting, breakevens would be rising. They are flat to lower. The repricing is in the real component, which is the policy channel. The bond market has already done part of the Fed's tightening.
10. CPI day became a market event again in 2022
Event study · 320 CPI releases since 2000
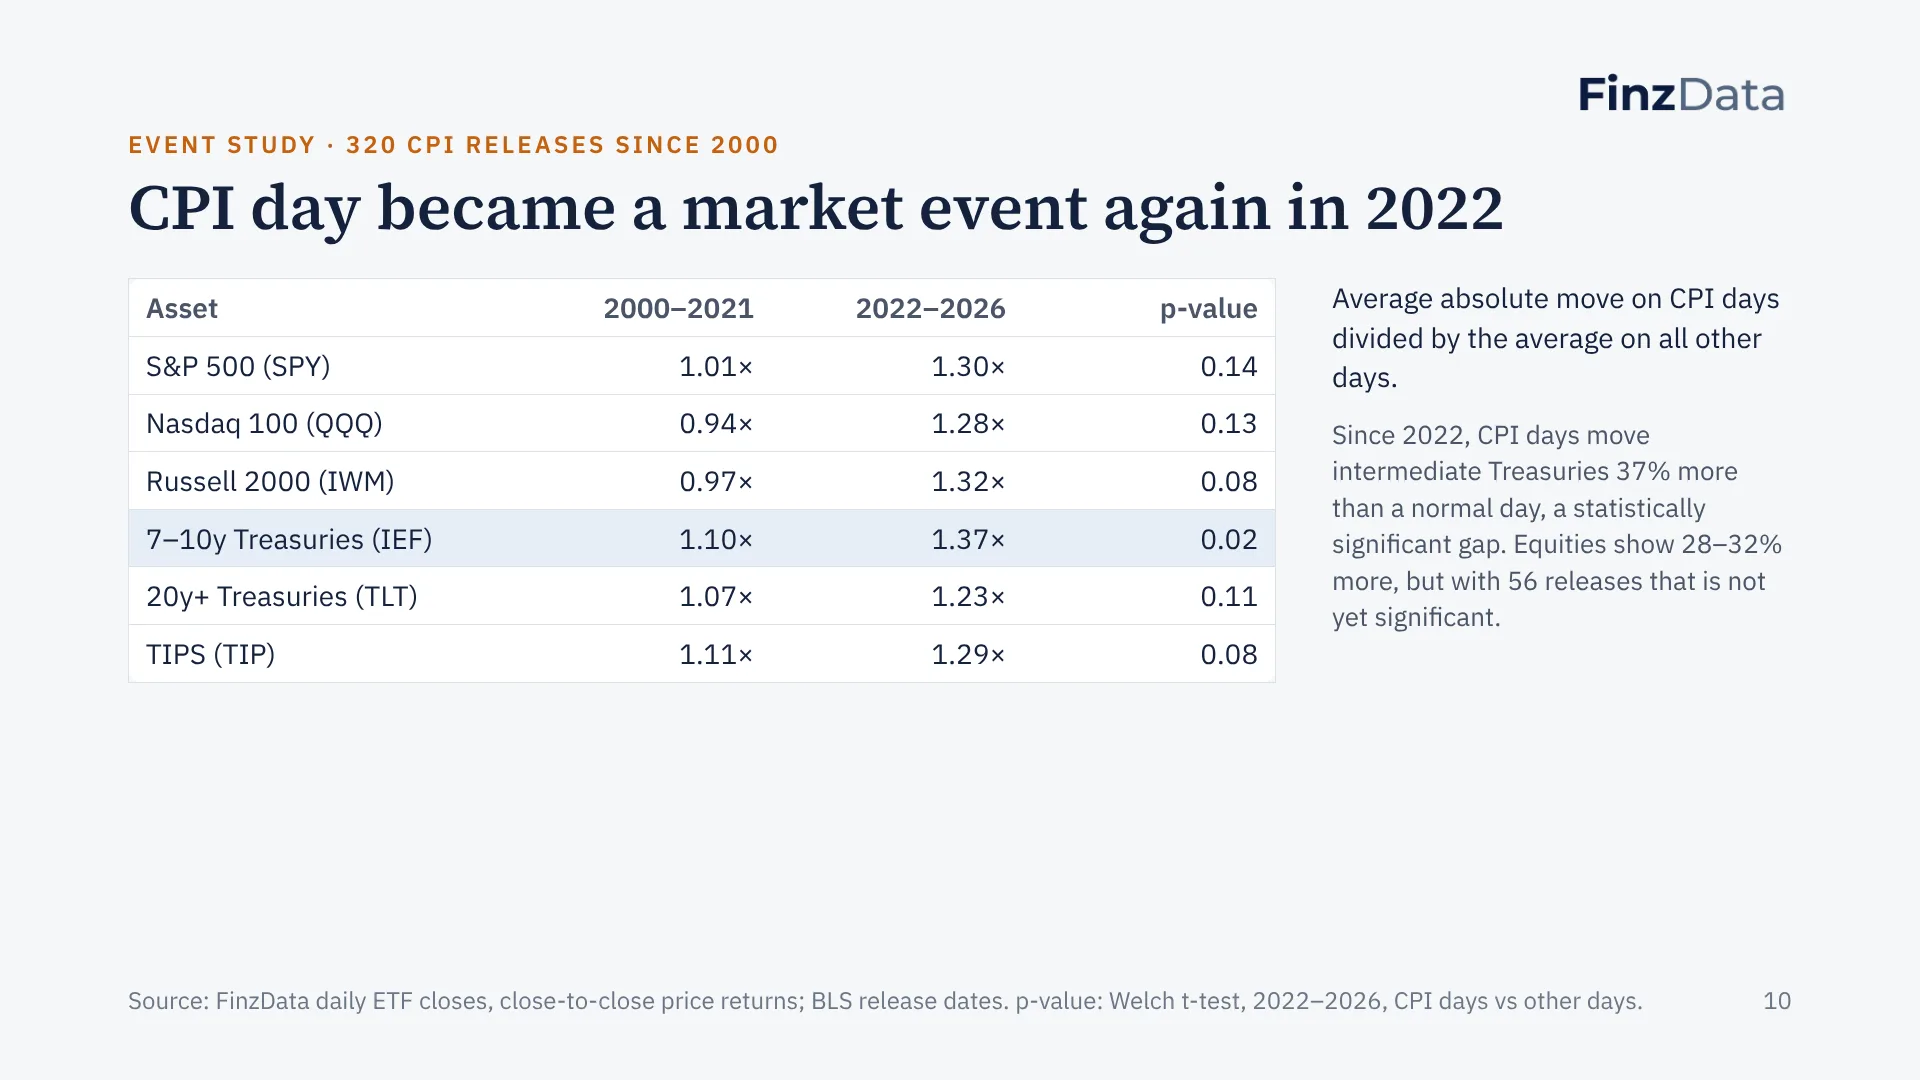
From 2000 to 2021, CPI days were ordinary days for equities. Since 2022, with inflation the Fed's binding constraint, they carry roughly a third more movement. For options desks: realized moves support pricing a CPI-day premium in rates, and plausibly in equities. Release dates and returns are from point-in-time data; no look-ahead.
11. In energy-hot regimes, growth lagged and energy led
Regime study · 1999 to 2026
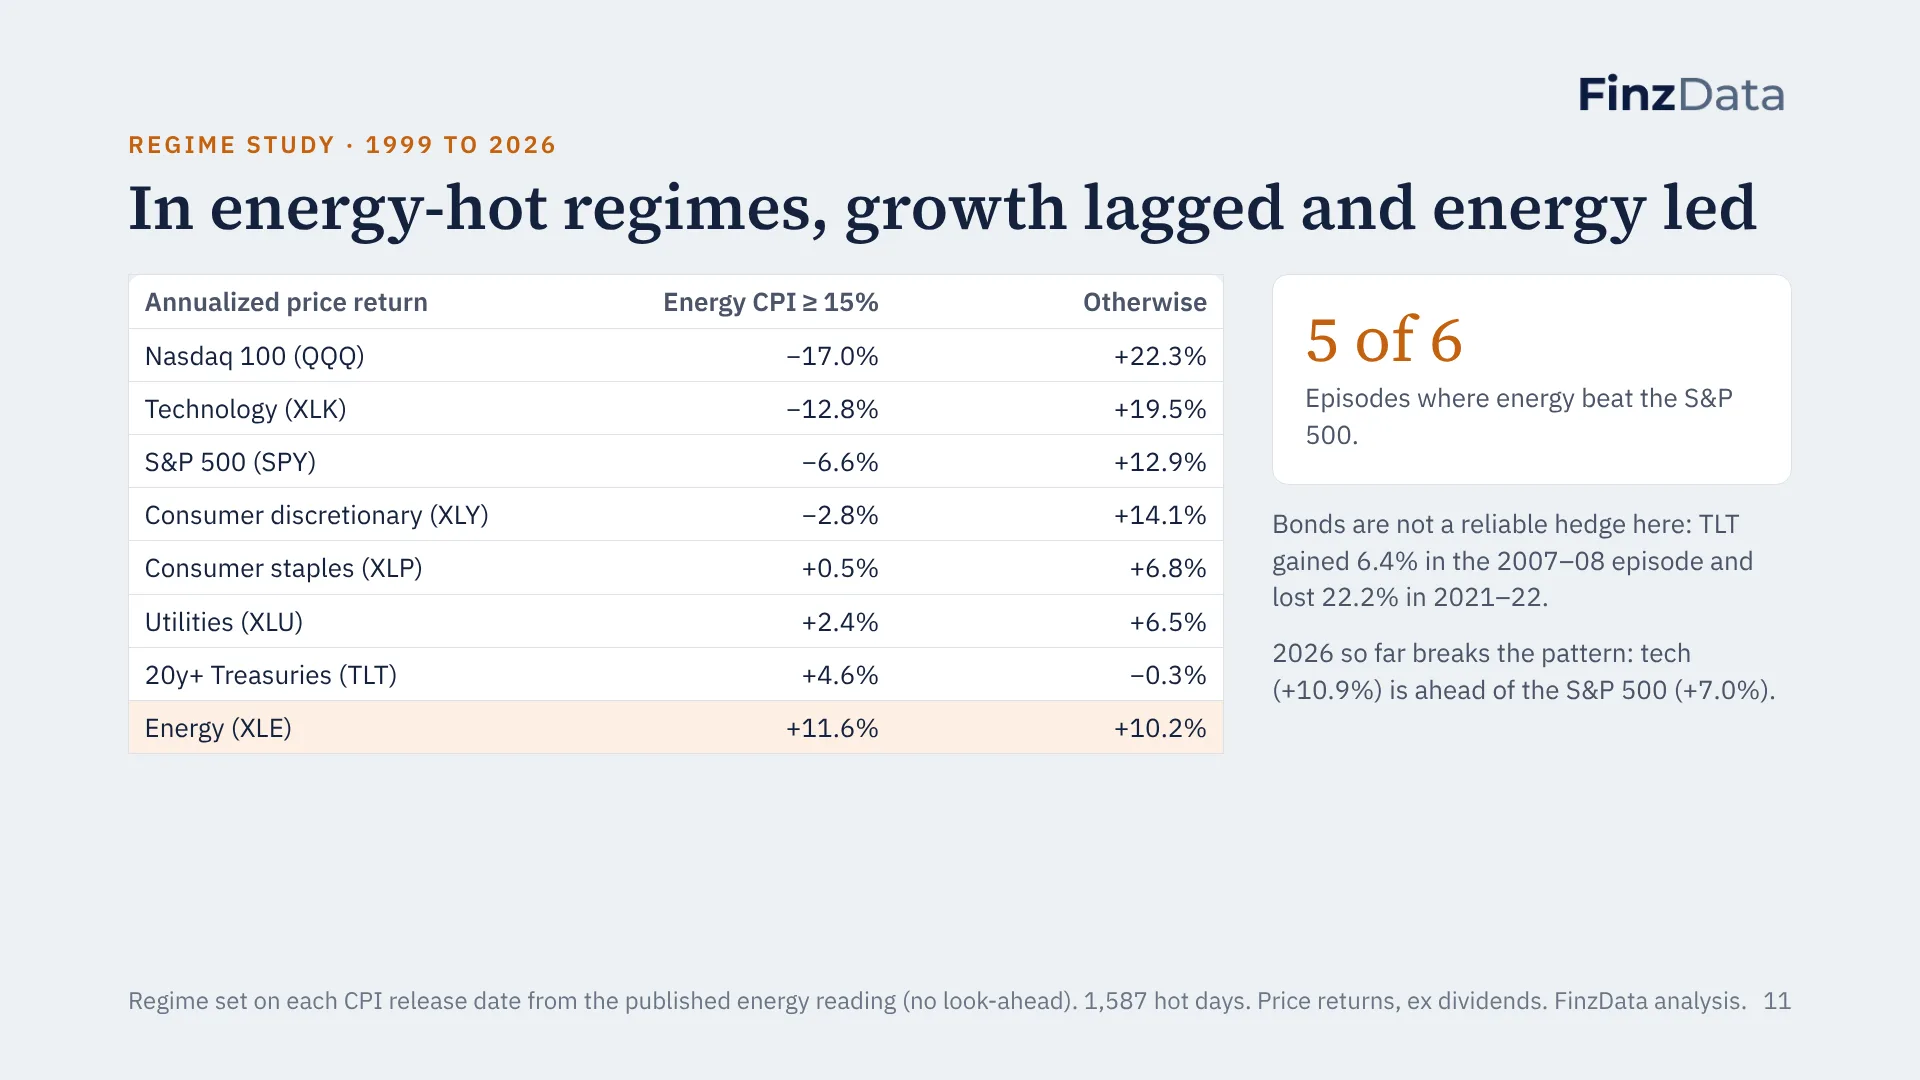
Caveat first: the hot regimes overlap the 2000 to 2001 and 2008 bear markets, so part of the equity weakness is recession, not energy. The robust results are relative: energy over the index, and growth under it. The bond result depends on whether growth or inflation dominates the episode.
12. What the evidence points to, by asset class
Implications
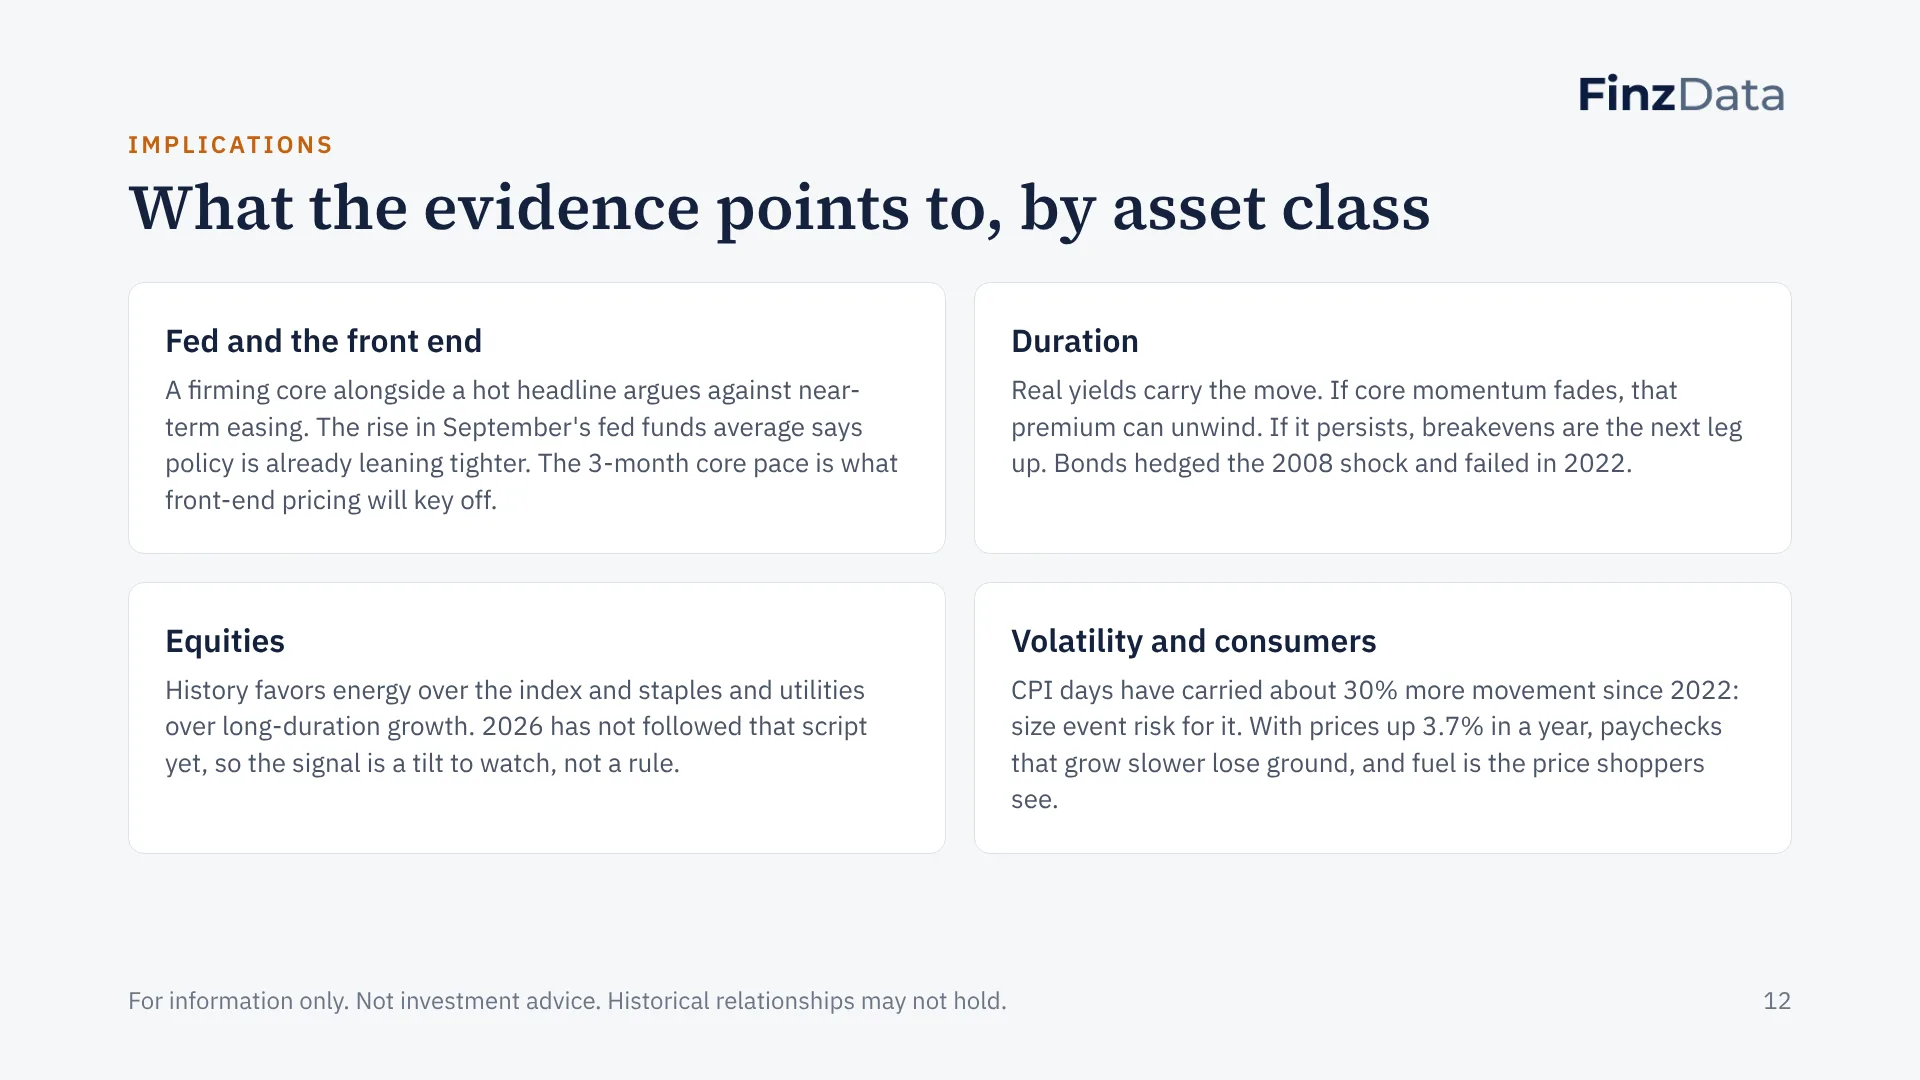
A firming core alongside a hot headline argues against near-term easing. The rise in September's fed funds average says policy is already leaning tighter. The 3-month core pace is what front-end pricing will key off. Real yields carry the move. If core momentum fades, that premium can unwind. If it persists, breakevens are the next leg up. Bonds hedged the 2008 shock and failed in 2022. History favors energy over the index and staples and utilities over long-duration growth. 2026 has not followed that script yet, so the signal is a tilt to watch, not a rule. CPI days have carried about 30% more movement since 2022: size event risk for it. With prices up 3.7% in a year, paychecks that grow slower lose ground, and fuel is the price shoppers see.
13. Five readings decide which history repeats
What to watch
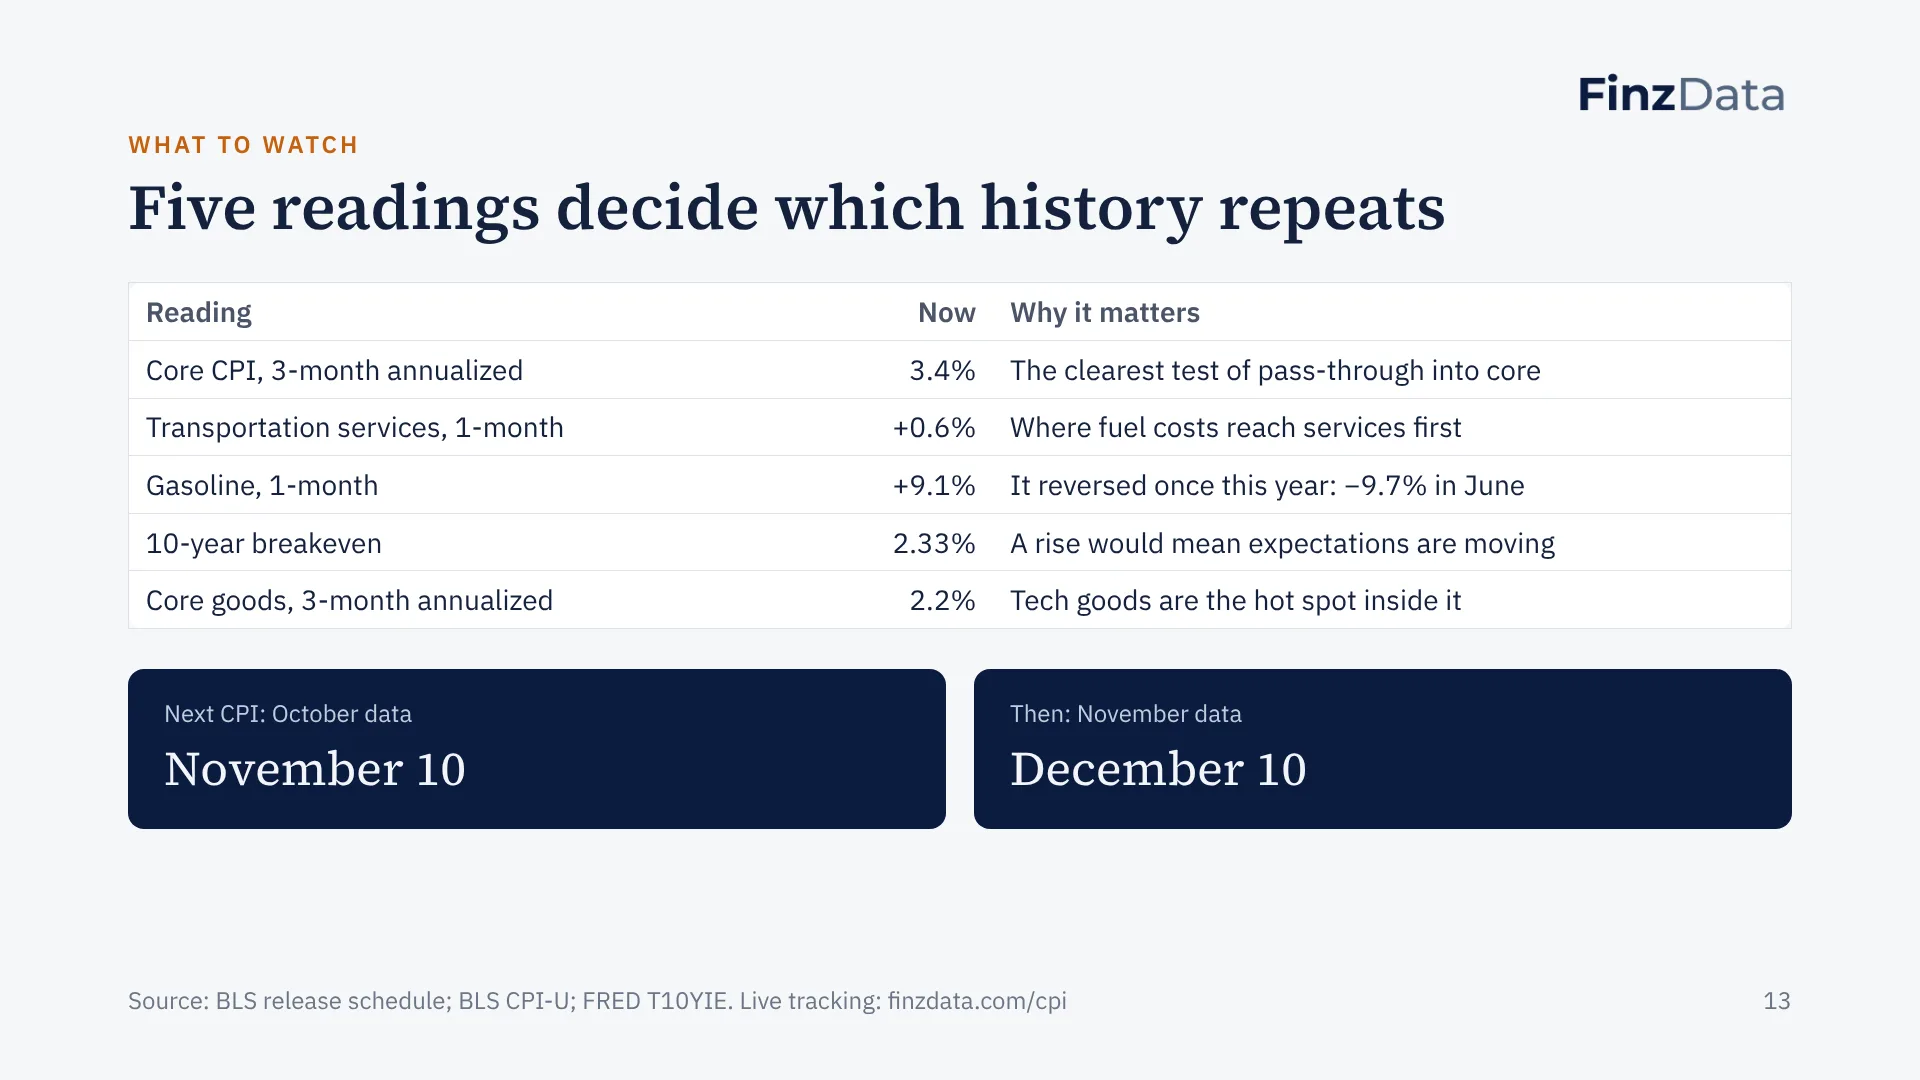
The CPI Component Monitor on finzdata.com updates the same afternoon as each release, with every component charted and downloadable.
14. How the numbers were built
Method and sources
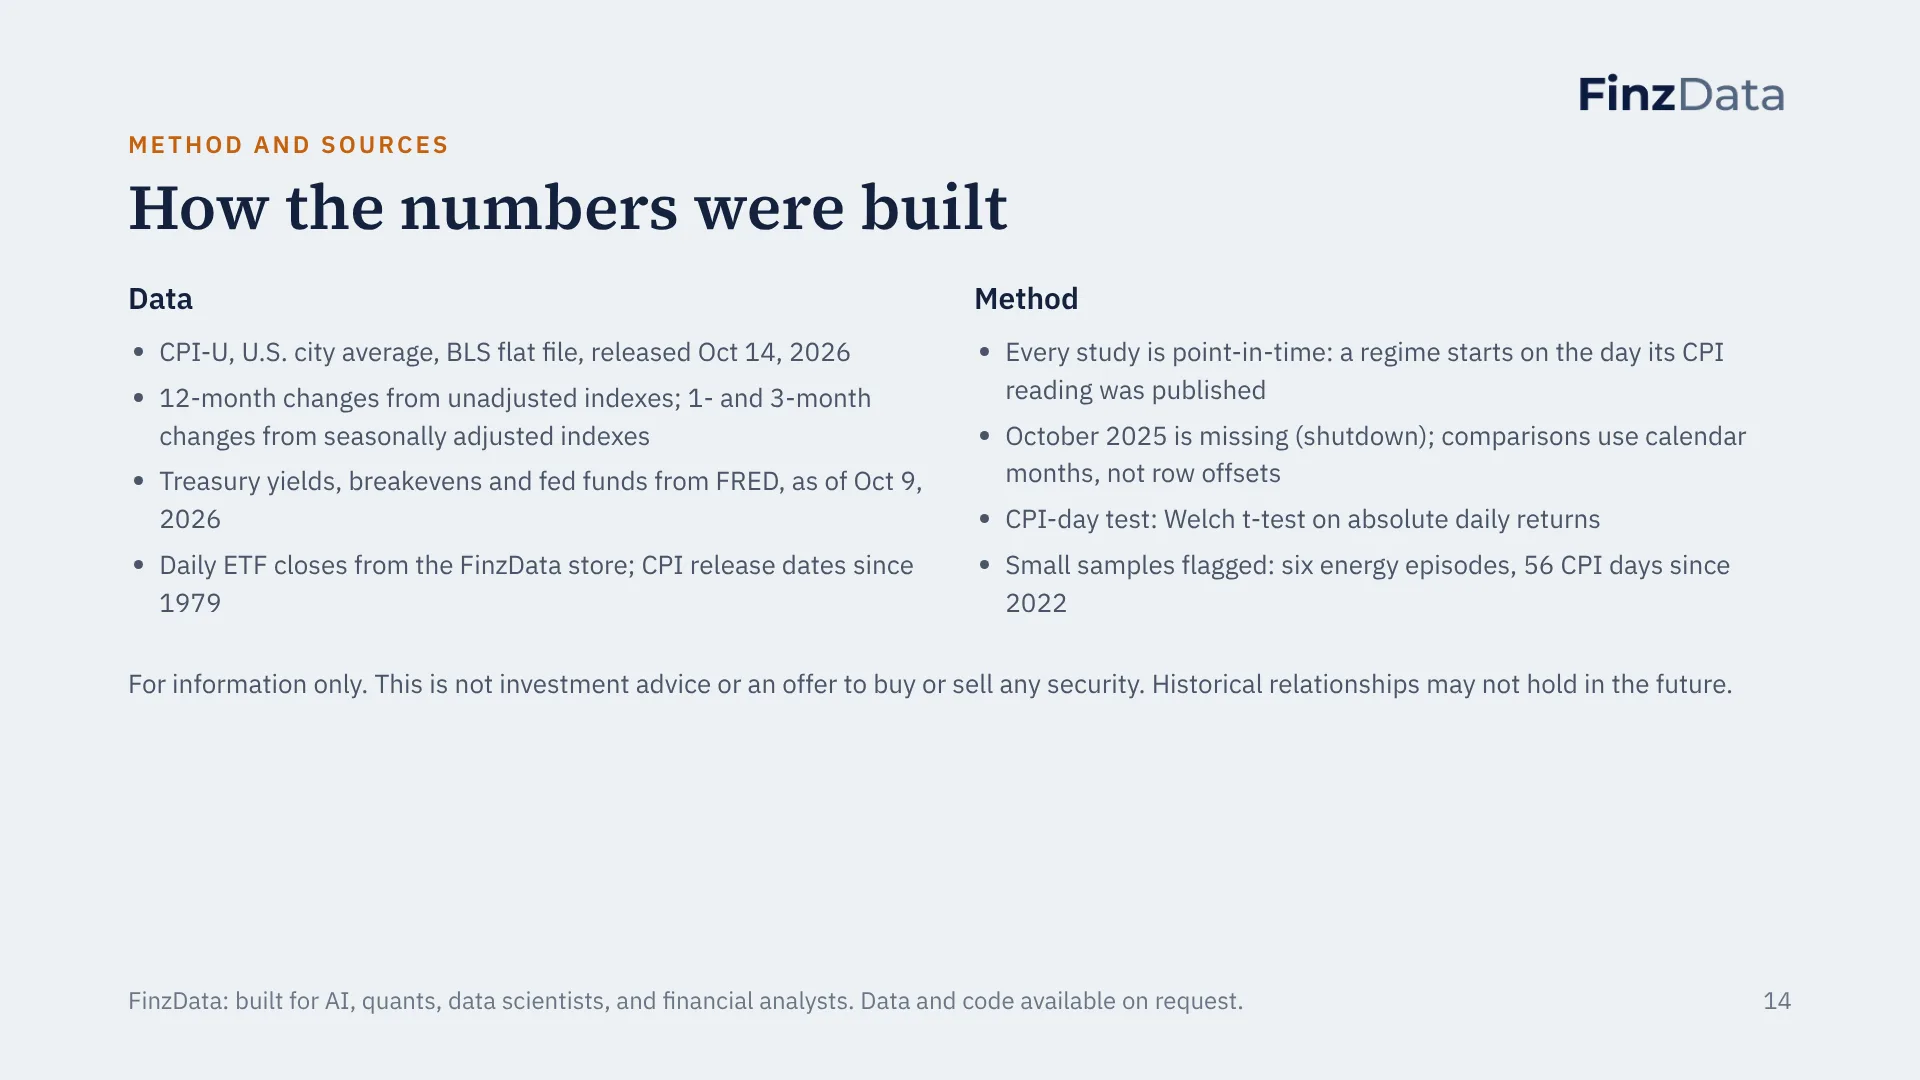
CPI-U, U.S. city average, BLS flat file, released Oct 14, 2026 12-month changes from unadjusted indexes; 1- and 3-month changes from seasonally adjusted indexes Treasury yields, breakevens and fed funds from FRED, as of Oct 9, 2026 Daily ETF closes from the FinzData store; CPI release dates since 1979 Every study is point-in-time: a regime starts on the day its CPI reading was published October 2025 is missing (shutdown); comparisons use calendar months, not row offsets CPI-day test: Welch t-test on absolute daily returns Small samples flagged: six energy episodes, 56 CPI days since 2022
15. Every chart in this deck is one API call
Built on FinzData
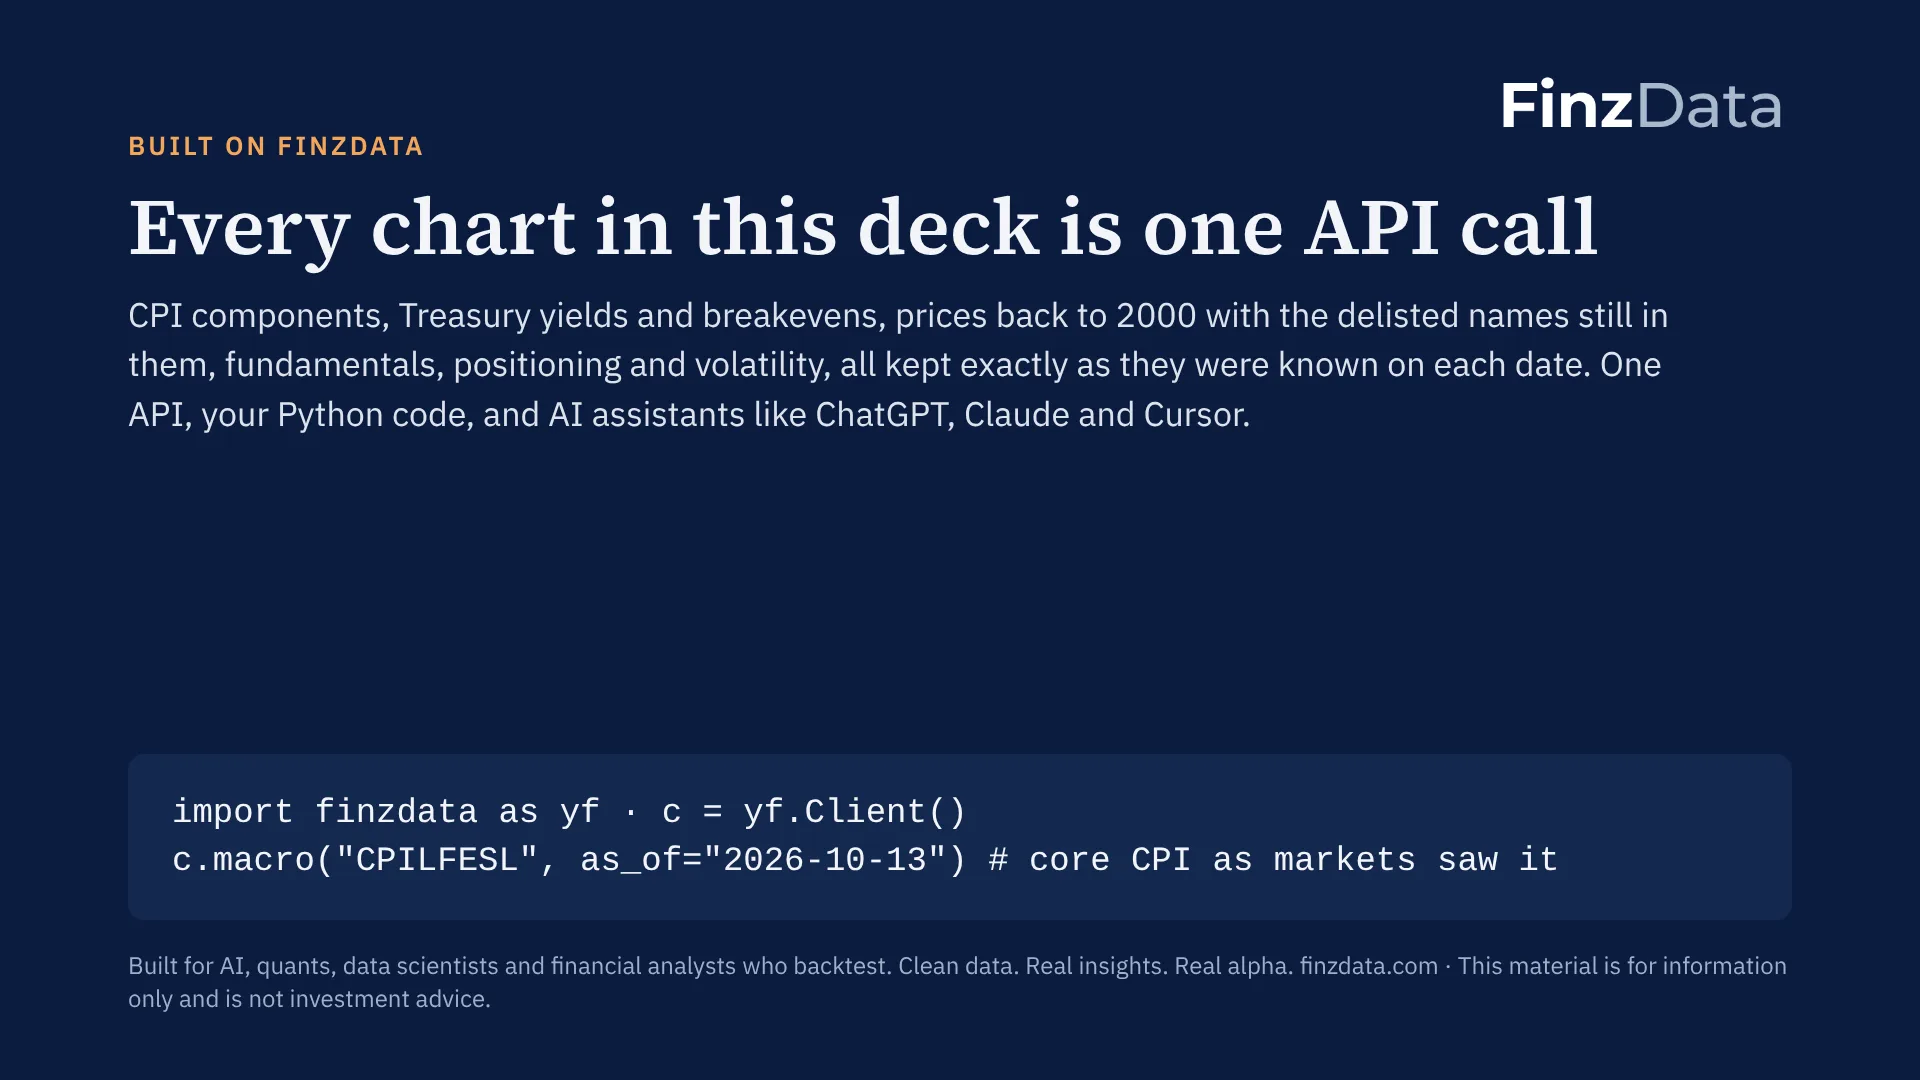
Close on the data: every number in the deck can be pulled point-in-time with one call, including the CPI vintages markets actually saw on each release day.
Download the deck (PDF, 15 slides) Track every CPI component · More research
import finzdata as yf                 # pip install finzdata
c = yf.Client()
core_then = c.macro("CPILFESL", as_of="2026-10-13")    # core CPI as markets saw it
cpi = c.macro("CPIAUCSL")                              # headline CPI, latest vintage
ten = c.macro("DGS10")                                 # 10-year Treasury yield
Get a free API key Browse all macro series · Explore the data
Built for AI, quants, data scientists and financial analysts who backtest. Clean data. Real insights. Real alpha. finzdata.com. This material is for information only and is not investment advice. Data sources: U.S. Bureau of Labor Statistics (CPI-U), Federal Reserve Bank of St. Louis (FRED: DGS10, T10YIE, FEDFUNDS), FinzData daily ETF prices.