
FinzData Research · Published 12 October 2026
The State of the US Consumer, October 2026
Spending is holding up. The foundation underneath it is narrowing, and the split between asset owners and wage earners is now the story. Every number below comes from the FinzData database, and every chart links to the series it was drawn from.
Download the deck (PDF, 15 slides)
Contents
- The consumer is spending, but the foundation is narrowing
- Spending is holding up across goods and services
- Income growth is losing the race against inflation
- Inflation: an energy shock on top of a cooling core
- The consequence: prices are 29% higher, and they are not coming back down
- The savings cushion is thin, and the first print was thinner
- The labor market is cooling, not collapsing
- Card balances are growing into a 21% interest rate
- Credit stress is normalizing, not breaking
- Balance sheets are strong in aggregate, and that is the point
- Consumers say they feel awful, and keep spending anyway
- The K-shape: asset owners fund the spending, wage earners fall behind
- Position for dispersion, and watch the labor market for the break
- The data behind this report
1. The consumer is spending, but the foundation is narrowing
Source: BEA, BLS, Federal Reserve. Latest: Aug 2026 spending, income and prices; Q2 2026 net worth.
- +2.6% real consumer spending, year over year. Demand is holding.
- −0.7% real hourly wages: pay up 3.0%, prices up 3.7%.
- 4.1% saving rate, against a 7.3% average in 2019.
- +72% household net worth since December 2019. Real wages: +3%.
The trade is dispersion, not a recession call: balance-sheet strength at the top is funding spending while wage earners save less and borrow at 21%.
Data behind this section: Real personal consumption expenditures PCEC96 · Average hourly earnings, total private CES0500000003 · Consumer price index, all items CPIAUCSL · Personal saving rate PSAVERT · Households; net worth BOGZ1FL192090005Q
2. Spending is holding up across goods and services
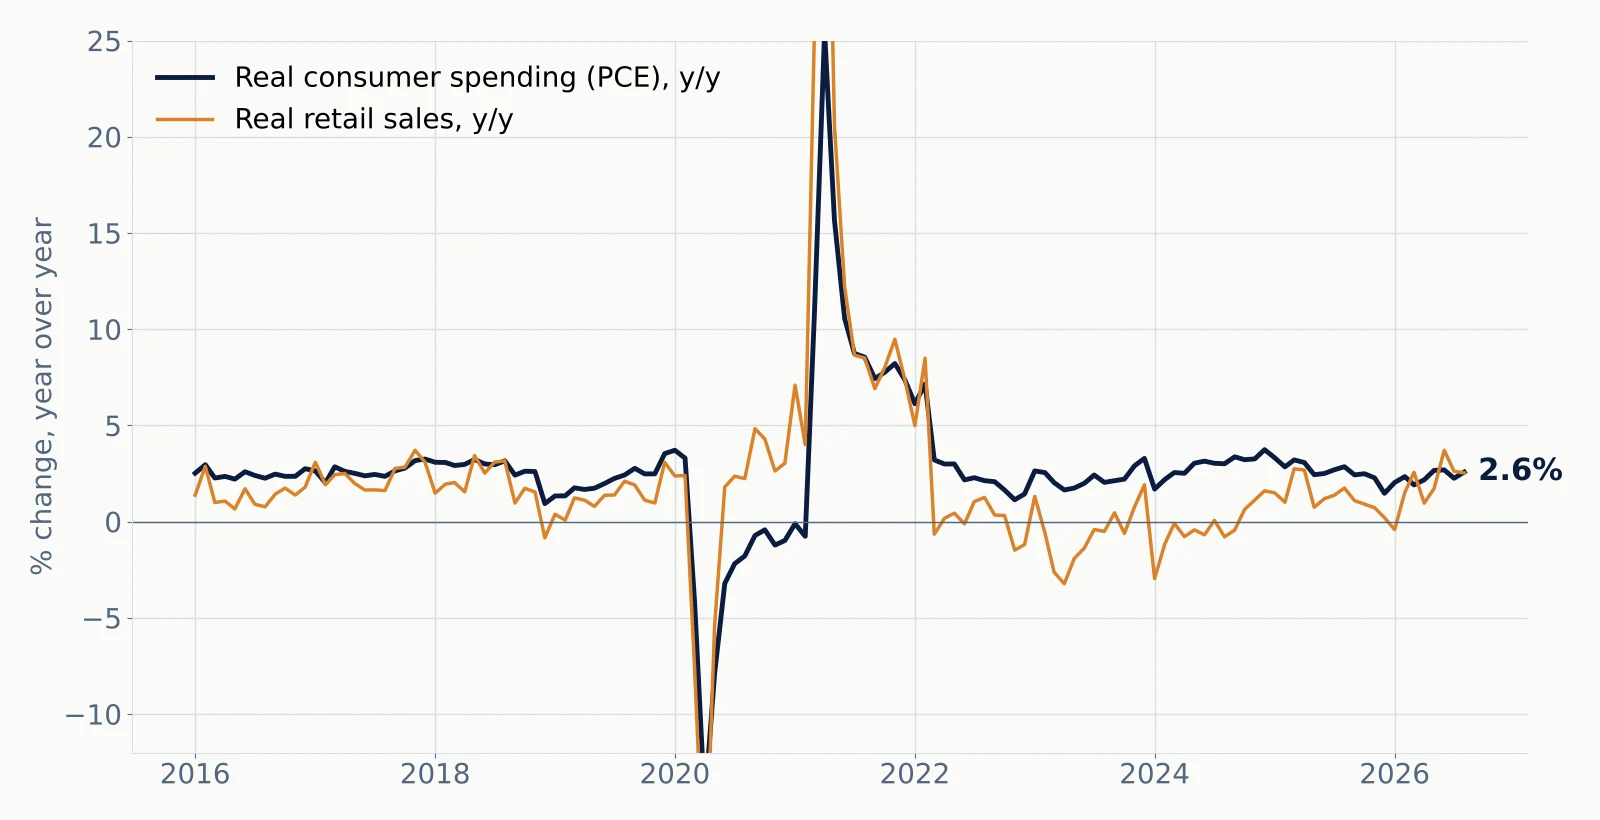
- +2.6% real spending (PCE) year over year; +2.5% real retail sales.
- +5.4% nominal retail sales, ahead of the NRF's 4.4% full-year forecast.
- Services are 68.9% of spending and rising 5.9% year over year; durables up 7.4%.
- No recession signal in the spending data yet.
Aggregate demand is not the problem. Real spending is growing at a trend-like pace and nominal retail sales are running above the industry's own forecast for the year.
Data behind this section: Real personal consumption expenditures PCEC96 · Real retail and food services sales RRSFS · Retail and food services sales RSAFS · Personal consumption expenditures: services PCES · Personal consumption expenditures PCE
3. Income growth is losing the race against inflation
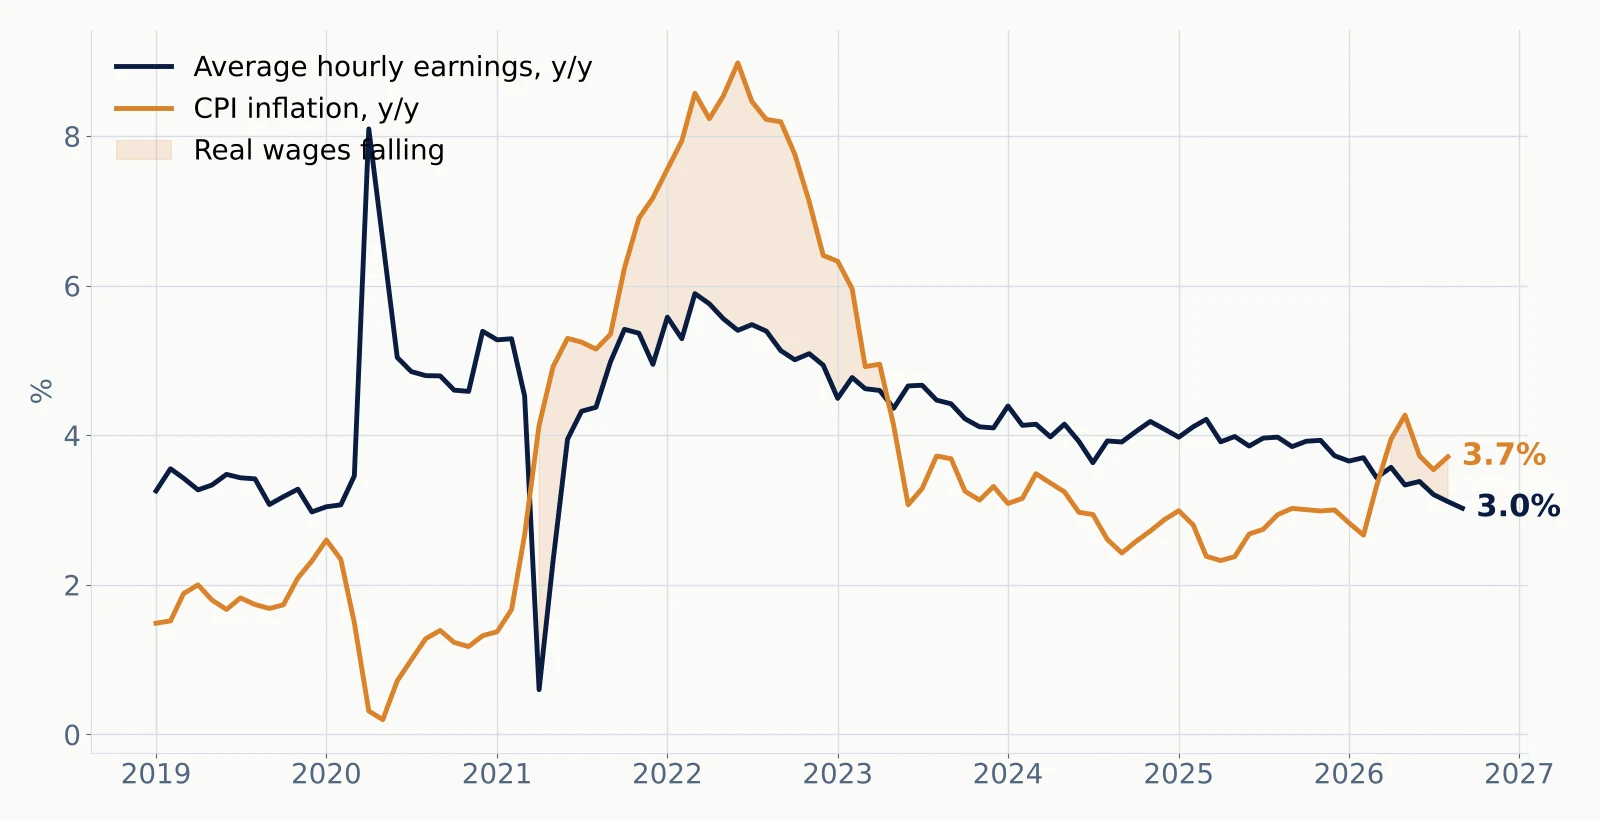
- CPI +3.7% vs hourly earnings +3.0%: real wages −0.7%.
- Real disposable income +1.3% year over year.
- Real income excluding transfers +0.8%: private earning power is stalling.
- Spending is being funded by saving less, not earning more.
Spending at 2.6% real against income at 1.3% real only works one way: the saving rate falls or credit rises. Both are happening.
Data behind this section: Average hourly earnings, total private CES0500000003 · Consumer price index, all items CPIAUCSL · Real disposable personal income DSPIC96 · Real personal income excluding current transfer receipts W875RX1
4. Inflation: an energy shock on top of a cooling core
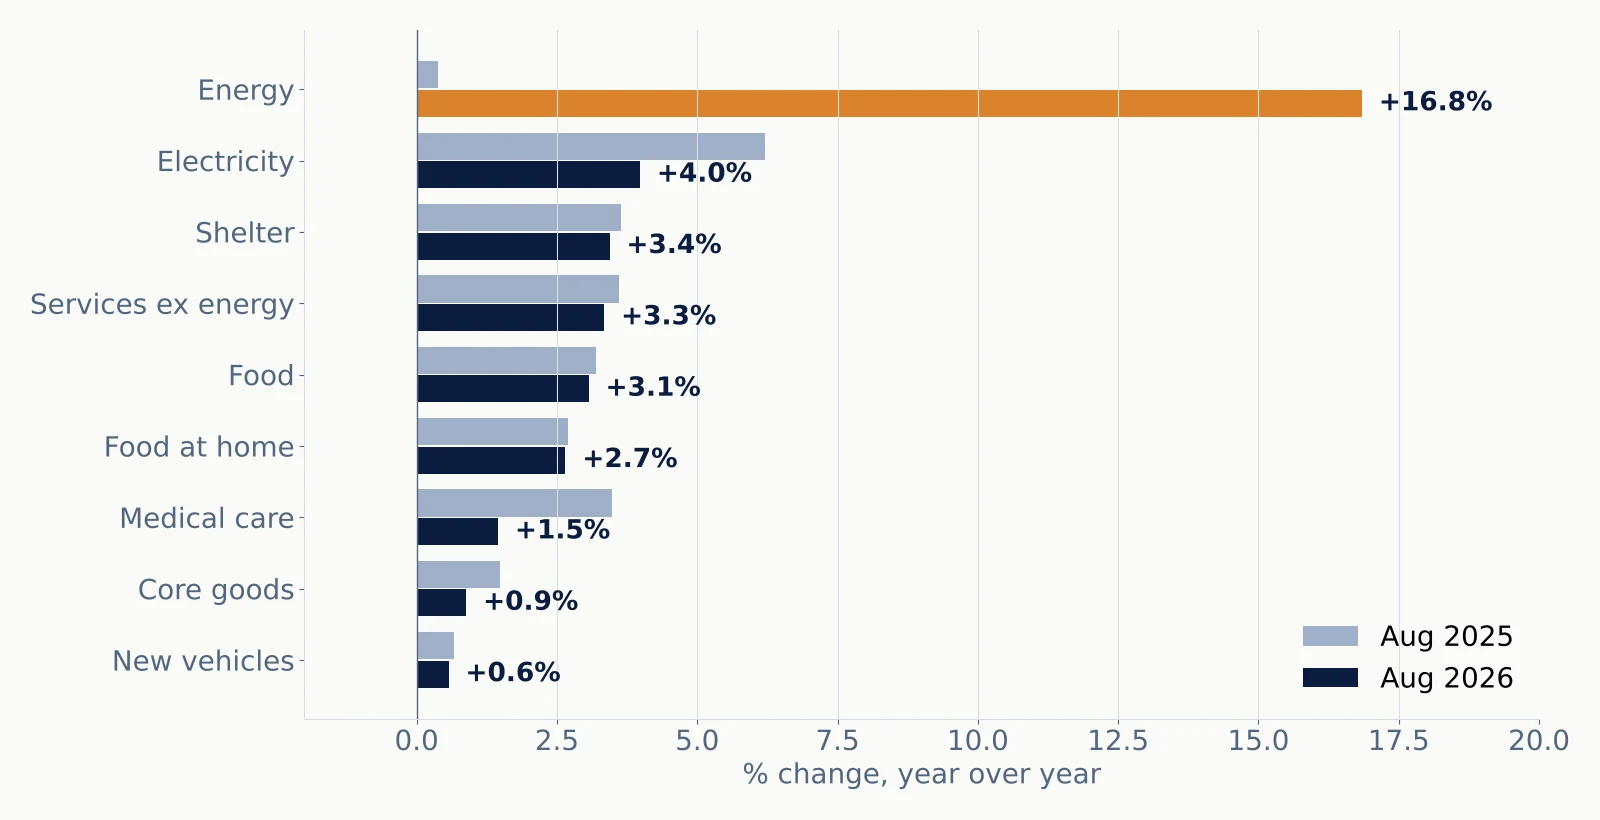
- Headline CPI 3.7%, up from 2.9% a year ago. Energy is +16.8%.
- Core CPI 2.8%, down from 3.1%; the last three months ran at a 2.0% annual pace.
- Shelter 3.4% and services 3.3% are easing; goods are near flat.
- The underlying trend is improving. The pain is at the pump and on the power bill.
Headline and core inflation are moving in opposite directions, and energy explains almost all of the gap. Energy prices have already fallen back over the last three months, so headline should drift down if that holds; core is the better guide to policy.
Data behind this section: Consumer price index, all items CPIAUCSL · CPI less food and energy (core) CPILFESL · CPI: energy CPIENGSL · CPI: shelter CUSR0000SAH1 · CPI: food at home CUSR0000SAF11
5. The consequence: prices are 29% higher, and they are not coming back down
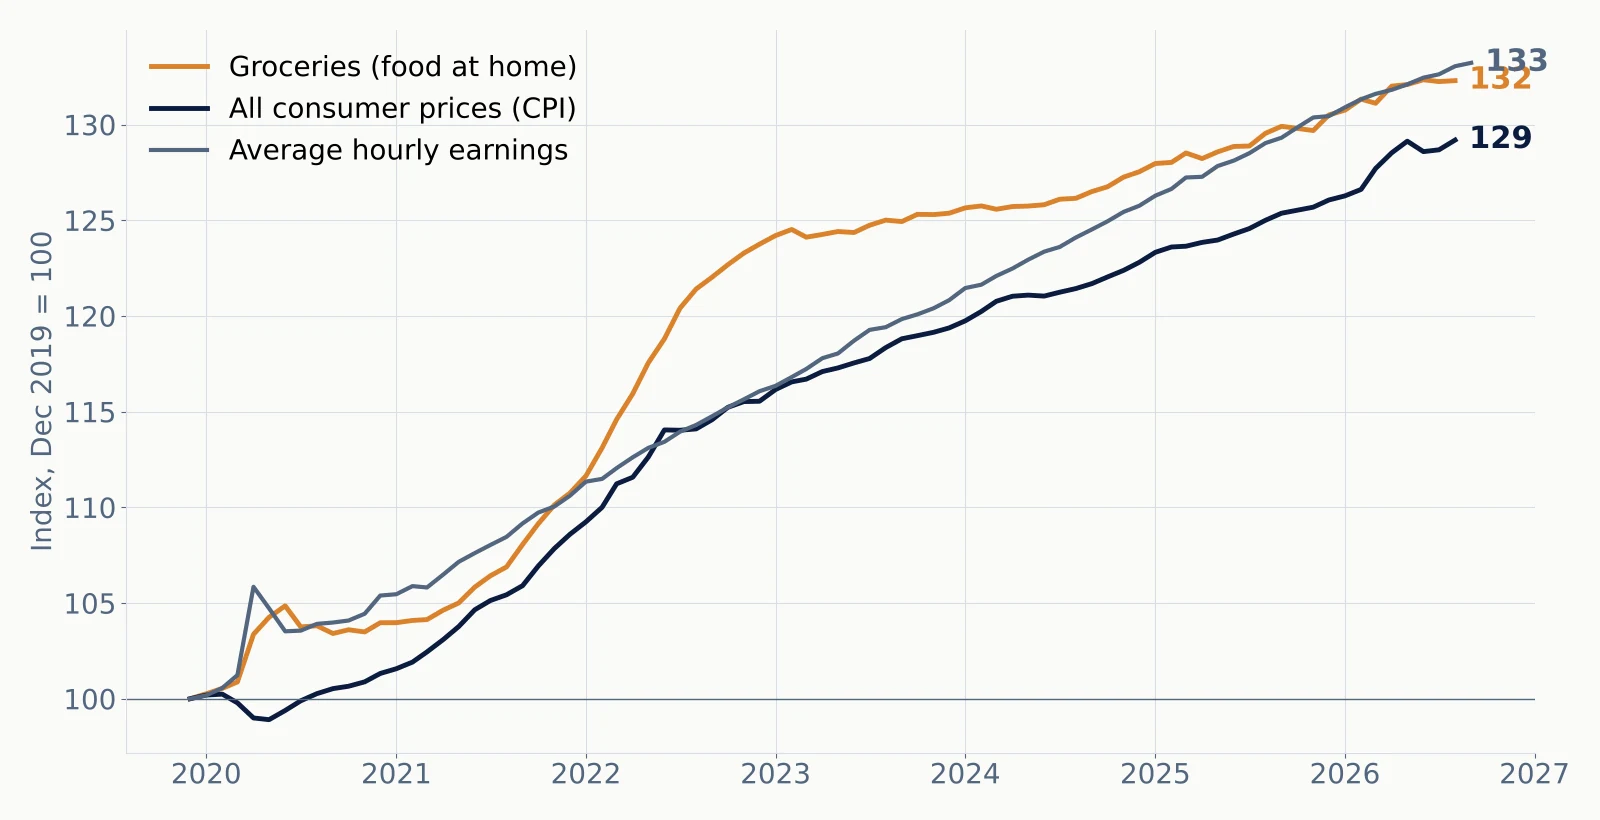
- +32% groceries since December 2019; wages +33%.
- $4.35 average gallon of gas, 5 October.
- 4.0% inflation households expect; markets price 2.3% (5-year breakeven).
- About 0% real fed funds: a 3.75% policy rate against 3.7% CPI.
Inflation's damage is the level, not the rate. Even as inflation cools, prices stay 29% above 2019. Households expect 4% inflation while bond markets price about 2.3%, and with the policy rate roughly equal to inflation, monetary policy is close to neutral rather than restrictive. Those facts link the inflation story to weak sentiment, thin savings and expensive credit.
Data behind this section: CPI: food at home CUSR0000SAF11 · Consumer price index, all items CPIAUCSL · Average hourly earnings, total private CES0500000003 · US regular gasoline price GASREGW · 5-year breakeven inflation rate T5YIE · University of Michigan inflation expectation, 1 year MICH · Effective federal funds rate FEDFUNDS
6. The savings cushion is thin, and the first print was thinner
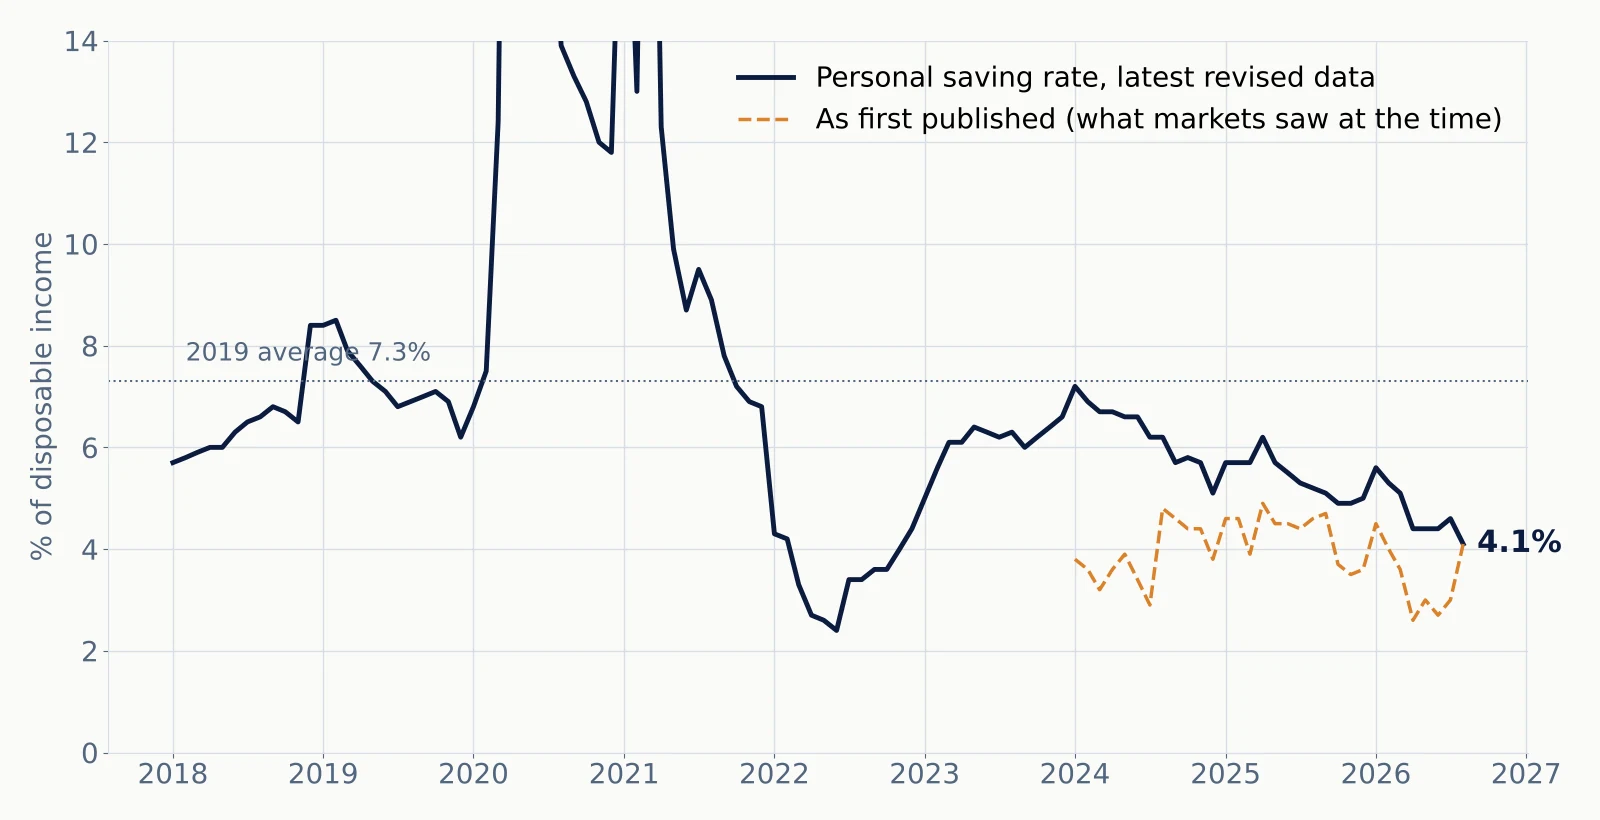
- Saving rate 4.1% vs a 7.3% average in 2019.
- July was first printed at 3.0%, then revised to 4.6% on 30 September.
- First prints have run well below the revised data for two years.
- Backtests on revised data see a consumer markets never saw.
This is where point-in-time data earns its keep. The dashed line is what investors actually saw each month; the solid line is today's revised history. A signal built on the solid line would not have been tradable.
Data behind this section: Personal saving rate PSAVERT
7. The labor market is cooling, not collapsing
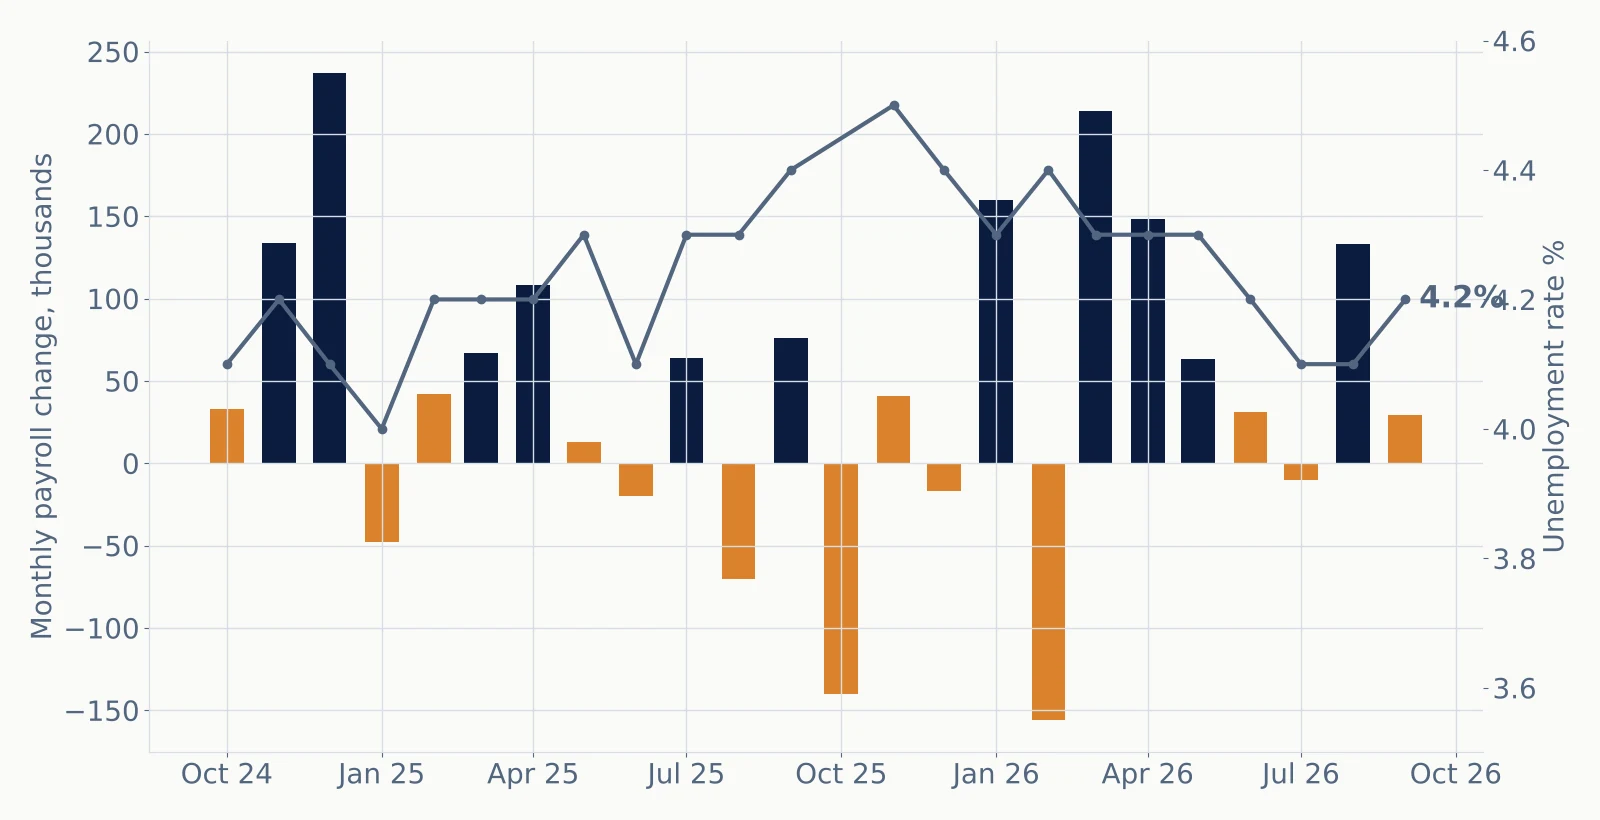
- Payrolls averaging 51k a month over the last three months.
- Unemployment 4.2%, just 0.1 point above its 12-month low.
- Claims low at 198k; quits rate 1.9% vs 2.3% in 2019.
- Low hiring, low firing: income risk skews to the downside.
Orange bars are months under 60k. Workers are staying put rather than job-hopping, which slows wage gains. A rise in layoffs, not just slow hiring, is the trigger to watch.
Data behind this section: All employees, total nonfarm PAYEMS · Unemployment rate UNRATE · Initial jobless claims ICSA · Quits rate, total nonfarm JTSQUR
8. Card balances are growing into a 21% interest rate
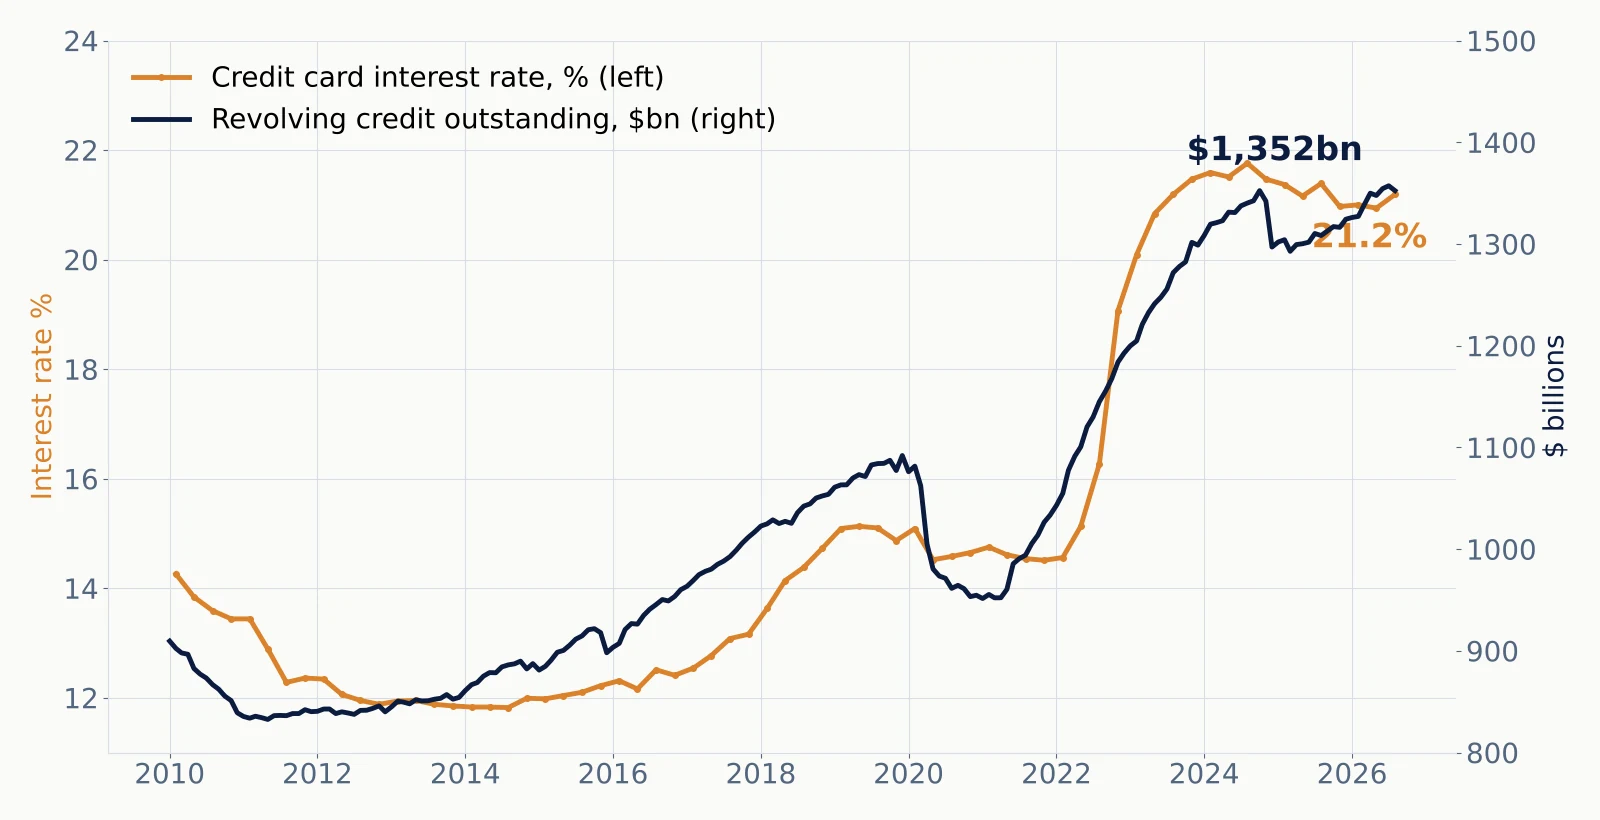
- Revolving credit $1,352bn, up 3.4% year over year and 24% above December 2019.
- Average card rate 21.2% vs 15.1% in 2019.
- Carrying a balance costs about 40% more per dollar than before the pandemic.
- Interest is crowding out discretionary spend for revolvers.
The balance is larger and the rate is higher at the same time. For households that revolve, the interest bill is now a meaningful line in the budget.
Data behind this section: Revolving consumer credit outstanding REVOLSL · Credit card interest rate, all accounts TERMCBCCALLNS
9. Credit stress is normalizing, not breaking
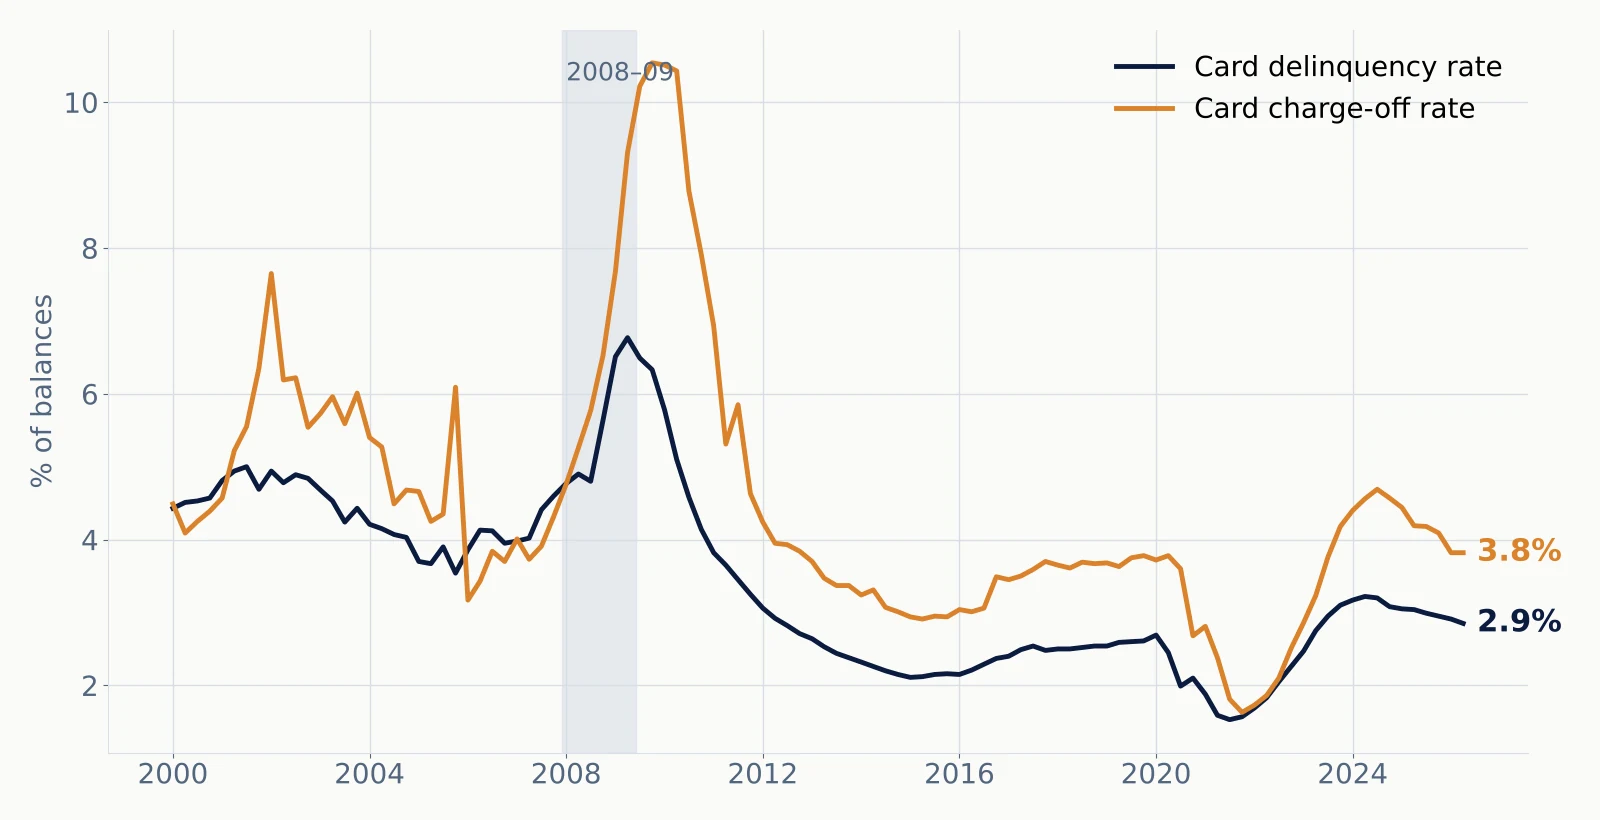
- Card delinquencies 2.85% in Q2 vs 2.58% in 2019.
- Charge-offs 3.82% vs 3.71% in 2019: back to normal.
- Both far below the 2009 peaks; stress sits at the margin.
- A late-cycle normalization, not a 2008-style impairment.
Delinquencies and charge-offs rose from very low post-stimulus levels and have settled just above 2019. The direction to watch is whether they keep drifting up as savings thin.
Data behind this section: Credit card delinquency rate, all commercial banks DRCCLACBS · Credit card charge-off rate, all commercial banks CORCCACBS
10. Balance sheets are strong in aggregate, and that is the point
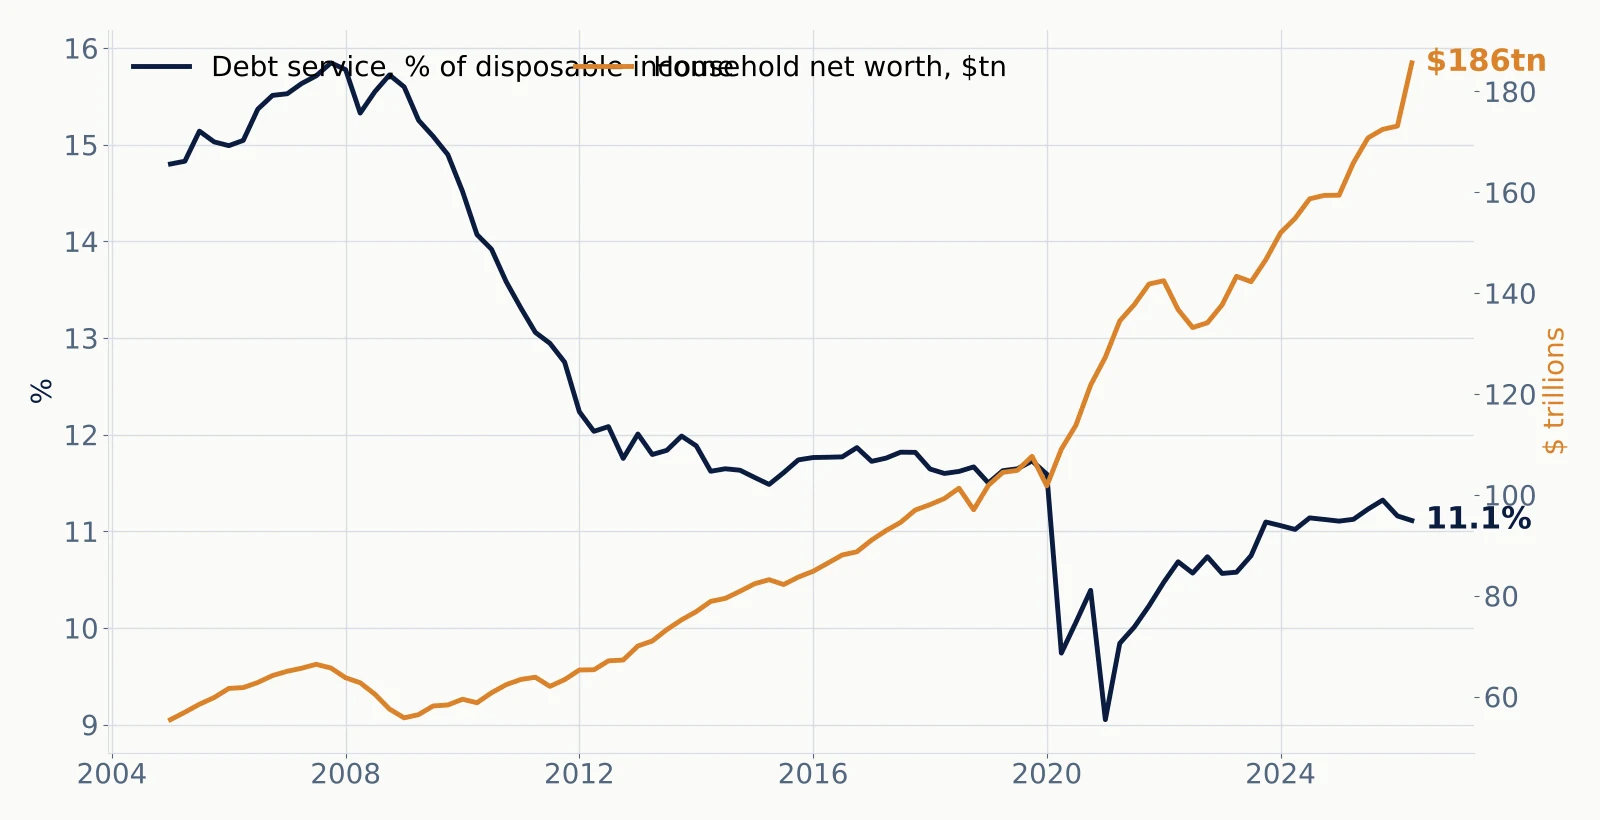
- Net worth $185.7tn, up 11.9% year over year.
- Debt service 11.1% of income, below 2019 (11.6%) and far under 2007 (15.7%).
- Home prices up just 1.9% year over year: the housing wealth tailwind is fading.
- Solvency is not the risk. Distribution is.
In aggregate, households have never been richer and their debt burden is manageable. The averages hide who holds the assets and who holds the card debt.
Data behind this section: Households; net worth BOGZ1FL192090005Q · Household debt service payments as % of disposable income TDSP · S&P CoreLogic Case-Shiller US national home price index CSUSHPISA
11. Consumers say they feel awful, and keep spending anyway
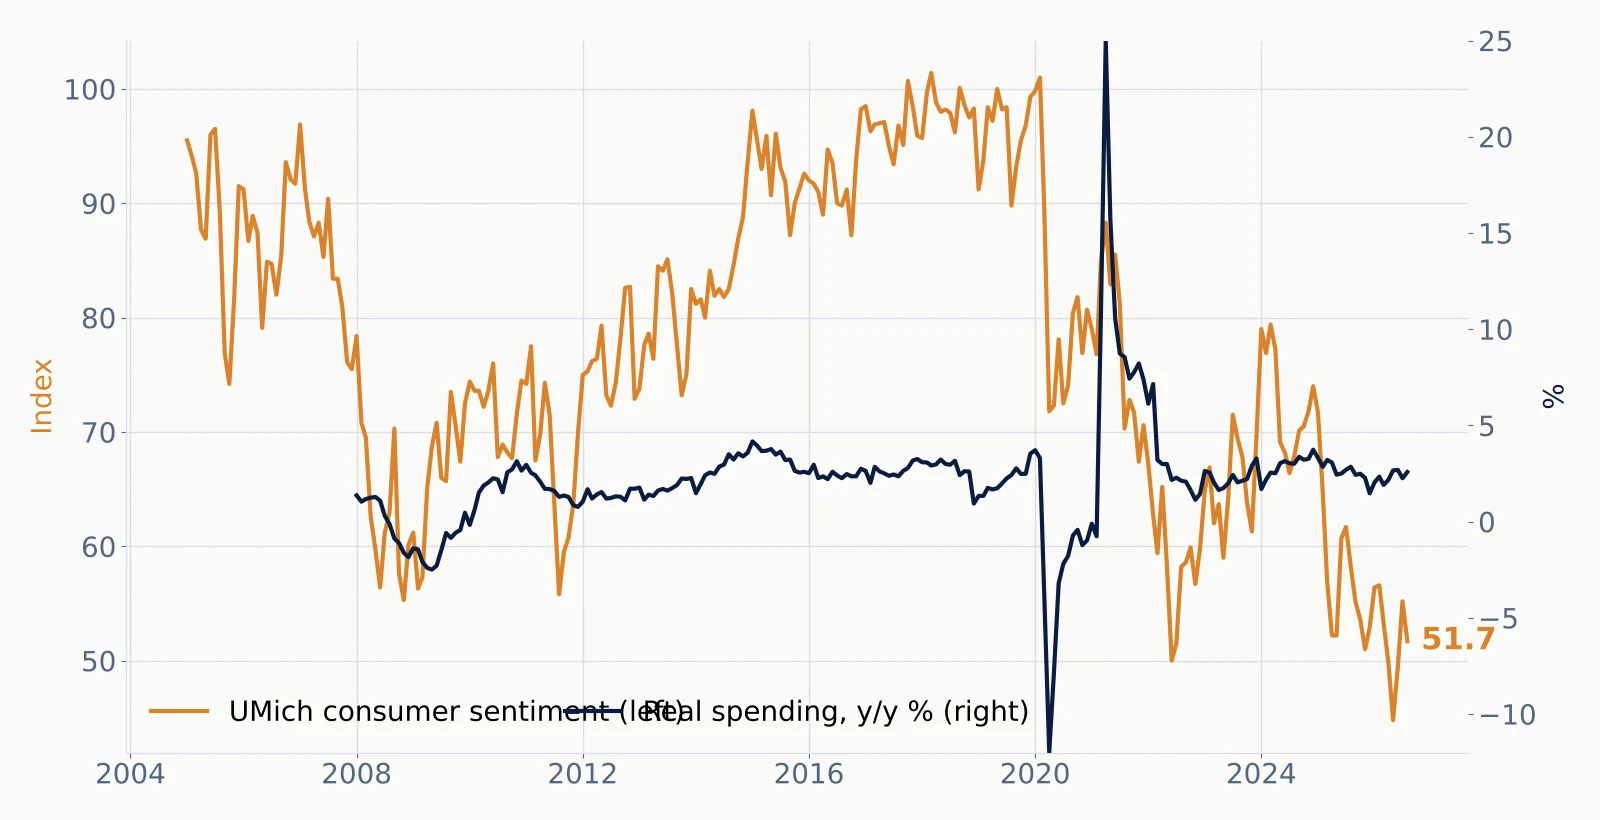
- Michigan sentiment 51.7 in August vs a 96.0 average in 2019.
- Near the June 2022 low of 50.0; one-year inflation expectations 4.0%.
- Real spending still up 2.6%: mood and behavior have decoupled.
- Surveys are a poor timing tool. Trust the hard data.
Sentiment has been near record lows for most of the post-pandemic period while real spending kept growing. It reads more like a measure of price-level frustration than a forecast of spending.
Data behind this section: University of Michigan consumer sentiment UMCSENT · University of Michigan inflation expectation, 1 year MICH · Real personal consumption expenditures PCEC96
12. The K-shape: asset owners fund the spending, wage earners fall behind
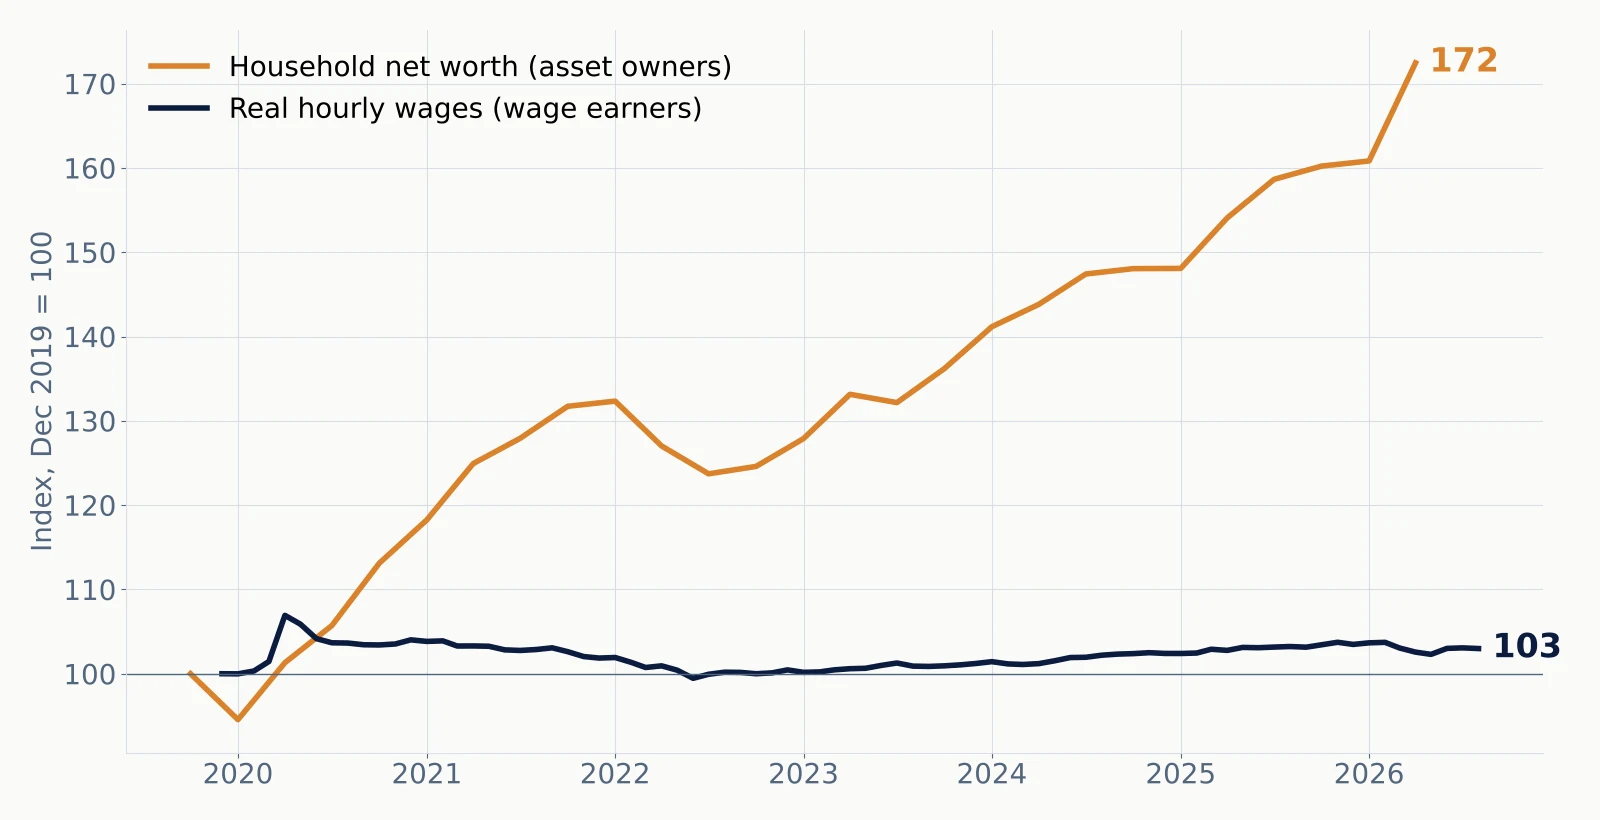
- Since December 2019, household net worth is up 72%.
- Real hourly wages are up 3%.
- The top of the K buys services and durables; the bottom saves 4% and borrows at 21%.
- The high-income consumer is the safer exposure.
This one chart explains why aggregate spending and aggregate sentiment disagree. Wealth gains are concentrated among households that own equities and homes; wage earners have barely kept pace with prices.
Data behind this section: Households; net worth BOGZ1FL192090005Q · Average hourly earnings, total private CES0500000003 · Consumer price index, all items CPIAUCSL
13. Position for dispersion, and watch the labor market for the break
Source: FinzData Research.
- What would change the view: payrolls negative for two months or claims above 250k; a saving rate below 3.5% on the first print; card delinquencies above 3.2% in Q3; an equity drawdown that hits the wealth effect at the top of the K.
- Market read-through: premium and services demand looks steadier than low-end discretionary; card lenders see rising interest income and slowly drifting losses; fed funds at 3.75% and high-yield spreads near 3.15% price a soft landing; rates stay hostage to the monthly jobs print.
The base case is continued growth with widening dispersion. Thresholds are FinzData Research judgment, not forecasts, and this is not investment advice.
Data behind this section: All employees, total nonfarm PAYEMS · Initial jobless claims ICSA · Personal saving rate PSAVERT · Credit card delinquency rate, all commercial banks DRCCLACBS · Effective federal funds rate FEDFUNDS
The data behind this report
Every series used in this report, straight from the FinzData database. Values are the latest vintage; each series page shows the full history and every revision. Download the public series as CSV or JSON. Licensed series (University of Michigan, S&P Case-Shiller) are available through the API under a FinzData licence.
Rebuild any chart in Python
import finzdata as yf                 # pip install finzdata
c = yf.Client()
spend = c.macro("PCEC96")                                # real consumer spending
saving_then = c.macro("PSAVERT", as_of="2026-08-29")     # the saving rate as markets saw it
cards = c.macro("TERMCBCCALLNS")                         # credit card interest rate
mood = c.licensed("UMCSENT")                             # UMich sentiment (licensed plans)
Get a free API key Browse all macro series · Explore the data · More research
Built for AI, quants, data scientists and financial analysts who backtest. Clean data. Real insights. Real alpha. finzdata.com. This material is for information only and is not investment advice. Data sources: BEA, BLS, Census, Federal Reserve (G.19, Z.1, charge-off and delinquency, debt service), DOL, EIA, US Treasury, University of Michigan and S&P Case-Shiller (licensed).