
FinzData Research · Published 21 October 2026
Searching for Signal: what Google searches say about risk appetite, volatility and markets, October 2026
We combined Google Trends from markets across the Americas, Europe, Asia, the Middle East and Africa with five years of weekly US data and 22 years of monthly data, tested against FinzData prices. Searches lag returns, forecast volatility, nowcast jobless claims, and caught France's unrest in real time.
Get FinzData research free, every morning
The daily brief: what moved, the macro releases that matter, positioning and liquidity, with charts. One email a day, free, unsubscribe anytime.
Contents
- Executive summary
- The numbers that matter
- How we measured it
- Attention to stock markets is below normal everywhere
- The AI-investing search boom has faded everywhere
- Germany, Japan and France are googling rates more
- Inflation has dropped down the list of worries
- Bitcoin searches peaked in the same week in all six countries
- KR link
- country table
- fr daily
- fr 12m
- India: gold outsearched the stock indexes
- Taiwan: TSMC and the market are one search
- Indonesia: the Jakarta index is back in focus
- UAE: gold is the market people search
- Saudi Arabia: gold eclipses everything else
- Israel: bitcoin, rates and stocks share attention
- Turkey: the dollar never leaves the search bar
- South Africa: the rand is the market
- Nigeria: the naira is the only number that matters
- Egypt: the dollar rate and gold, not stocks
- Kenya: the shilling leads, the exchange is rising
- Beyond the big six: currency and gold, not stocks
- Americans are searching less for stocks and bitcoin
- Unemployment is the economic worry Americans google most
- Gold is the trade Americans google, not options
- The AI-trading search boom has faded
- US link
- US rising
- KOSPI searches jumped as Korean stocks fell
- The won and housing are what Koreans google
- Korea's ETF search boom has burst
- AI investing searches are down 80% from their average
- KR rising
- Japanese stock searches have cooled, but less than in the US
- Interest rates are Japan's economic search, and rising
- FX trading searches are climbing in Japan
- Japan's AI-investing interest is down, but holding up
- JP link
- JP rising
- British investors search the FTSE less, and bitcoin far less
- The Budget is Britain's biggest economic search
- Gold dominates UK trading searches too
- UK AI-trading interest has held up better than in the US
- GB link
- GB rising
- German stock searches are down a fifth
- Germans are googling interest rates and jobs more
- Trade Republic searches are steady while gold fades
- 'Quant' spiked in Germany and France in the same week
- DE link
- DE rising
- French market searches have held up best in Europe
- France worries about jobs more than inflation now
- French trading searches peaked in late September
- 'Quant' spiked in France and Germany in the same week
- FR link
- FR rising
- What the research already says
- Searches react to falling markets; they don't forecast them
- Searches forecast volatility, not direction
- Markets drive searches far more than searches drive markets
- Fear searches spike with the VIX
- After fear spikes: more volatility, no reliable direction
- Bitcoin attention follows big moves, in either direction
- Job searches are a real-time read on jobless claims
- Twenty-two years: fear searches peak inside sell-offs
- In every market, attention follows volatility
- We asked an AI referee to attack our method
- The verdict: leading or lagging?
- Search adds to the VIX, but only a little
- Out of sample, the volatility signal survives
- Falls raise attention; rallies quiet it
- Google's numbers are consistent for busy terms
- As an early warning, search mostly fails
- Acting on fear spikes would have cost money
- devil
- limits
- First, second and third-order effects
- First, second and third-order effects (continued)
- How a quant can use search data
- Signposts that would change our view
- Our read
- What to watch
- The data behind this research
- Sources
- Frequently asked questions
1. Searching for Signal
FinzData Research, October 2026.
We combined Google Trends from markets across the Americas, Europe, Asia, the Middle East and Africa with five years of weekly US data and 22 years of monthly data, tested against FinzData prices. Searches lag returns, forecast volatility, nowcast jobless claims, and caught France's unrest in real time.
2. Executive summary
FinzData Research, October 2026.
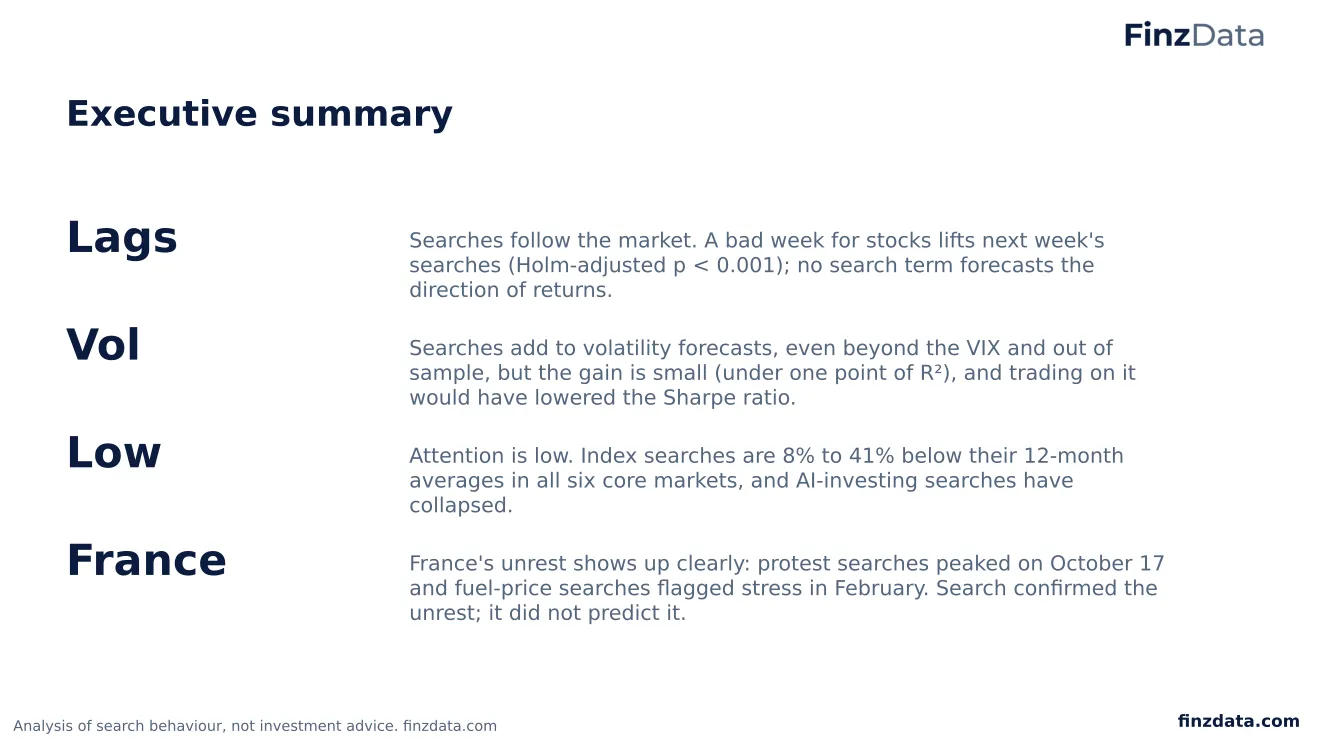
- Lags: Searches follow the market. A bad week for stocks lifts next week's searches (Holm-adjusted p < 0.001); no search term forecasts the direction of returns.
- Vol: Searches add to volatility forecasts, even beyond the VIX and out of sample, but the gain is small (under one point of R²), and trading on it would have lowered the Sharpe ratio.
- Low: Attention is low. Index searches are 8% to 41% below their 12-month averages in all six core markets, and AI-investing searches have collapsed.
- France: France's unrest shows up clearly: protest searches peaked on October 17 and fuel-price searches flagged stress in February. Search confirmed the unrest; it did not predict it.
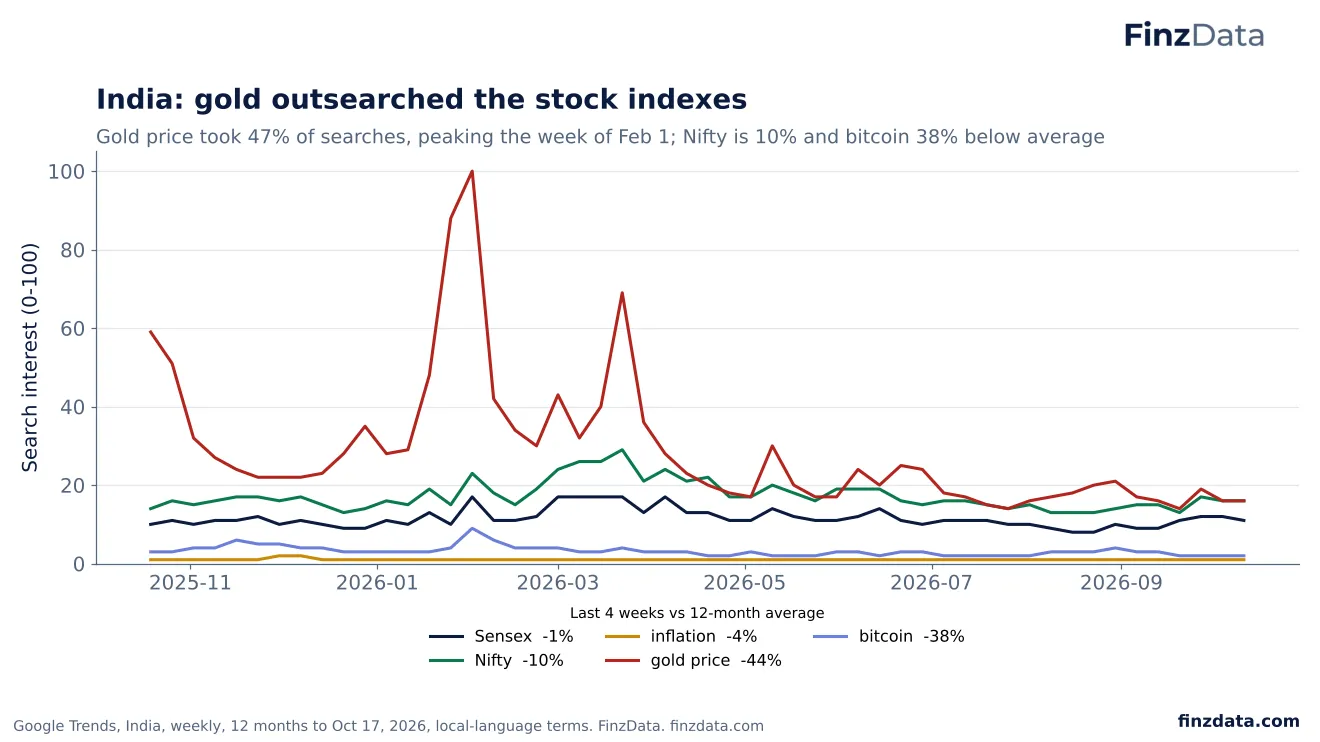
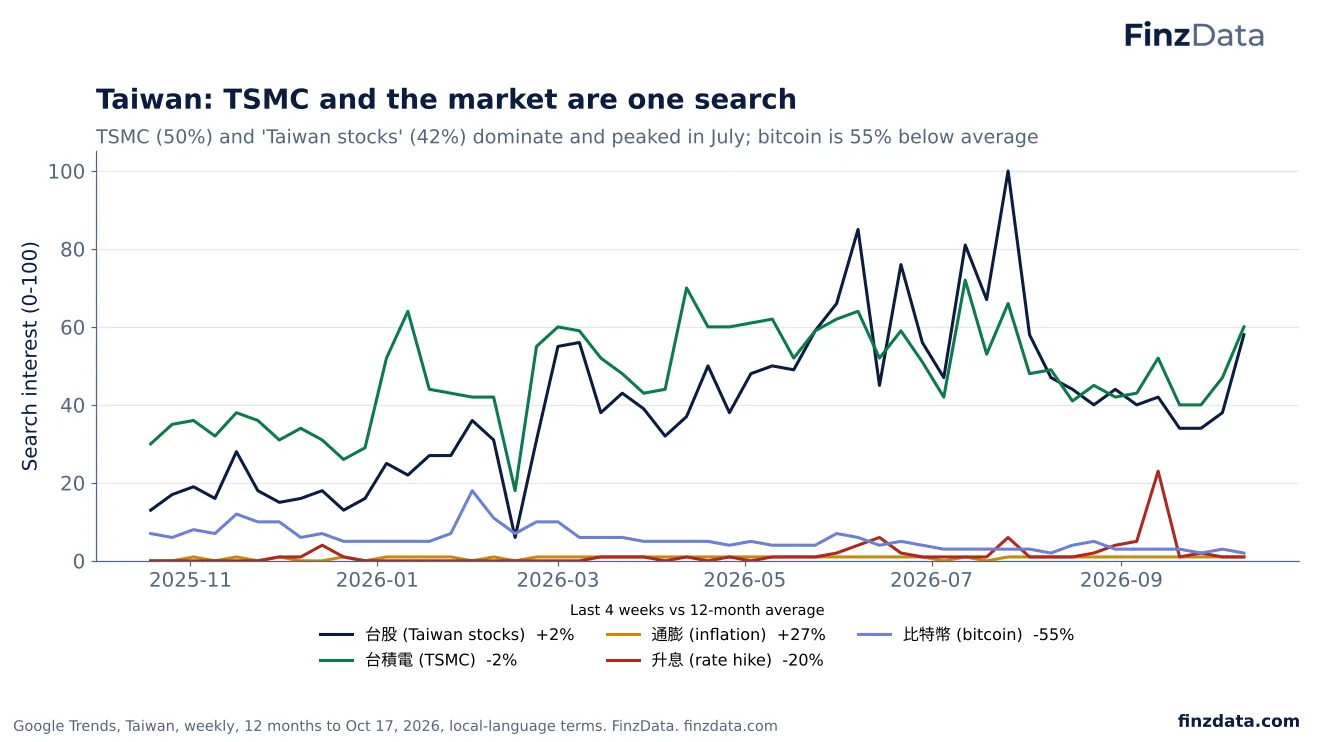
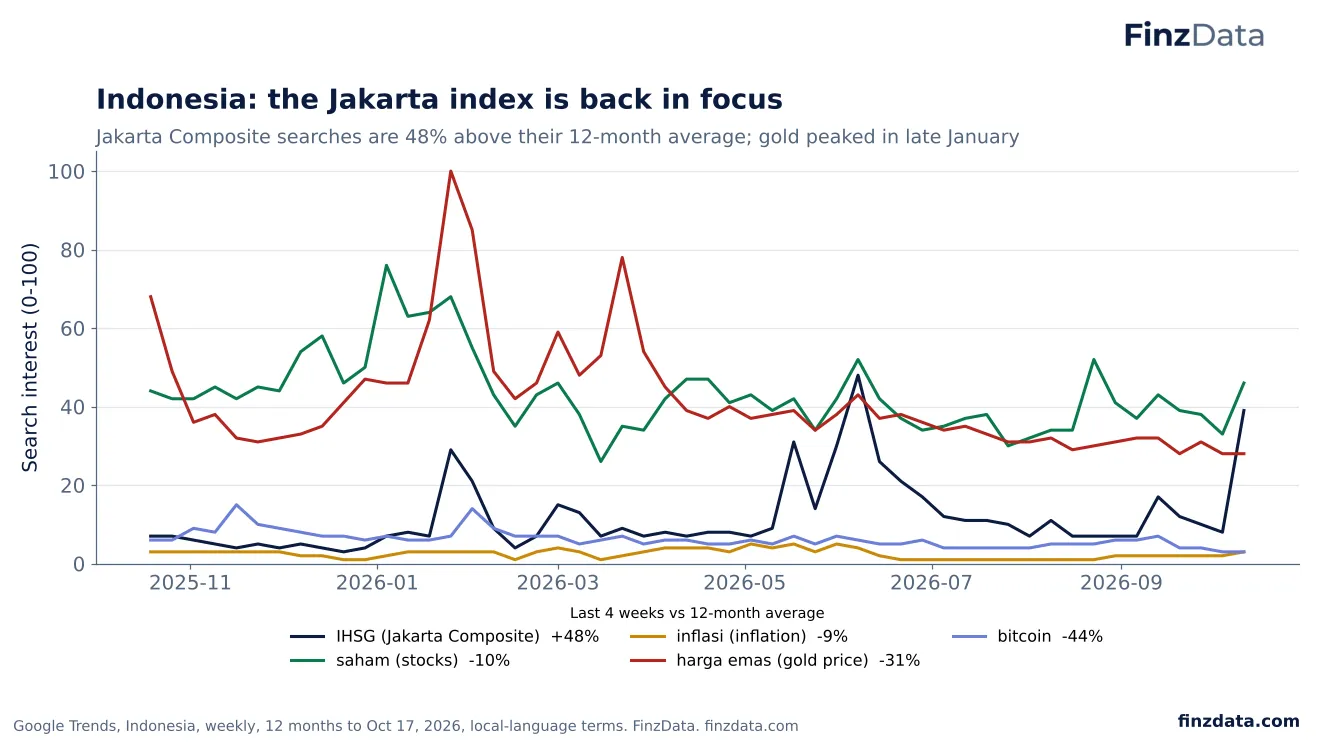
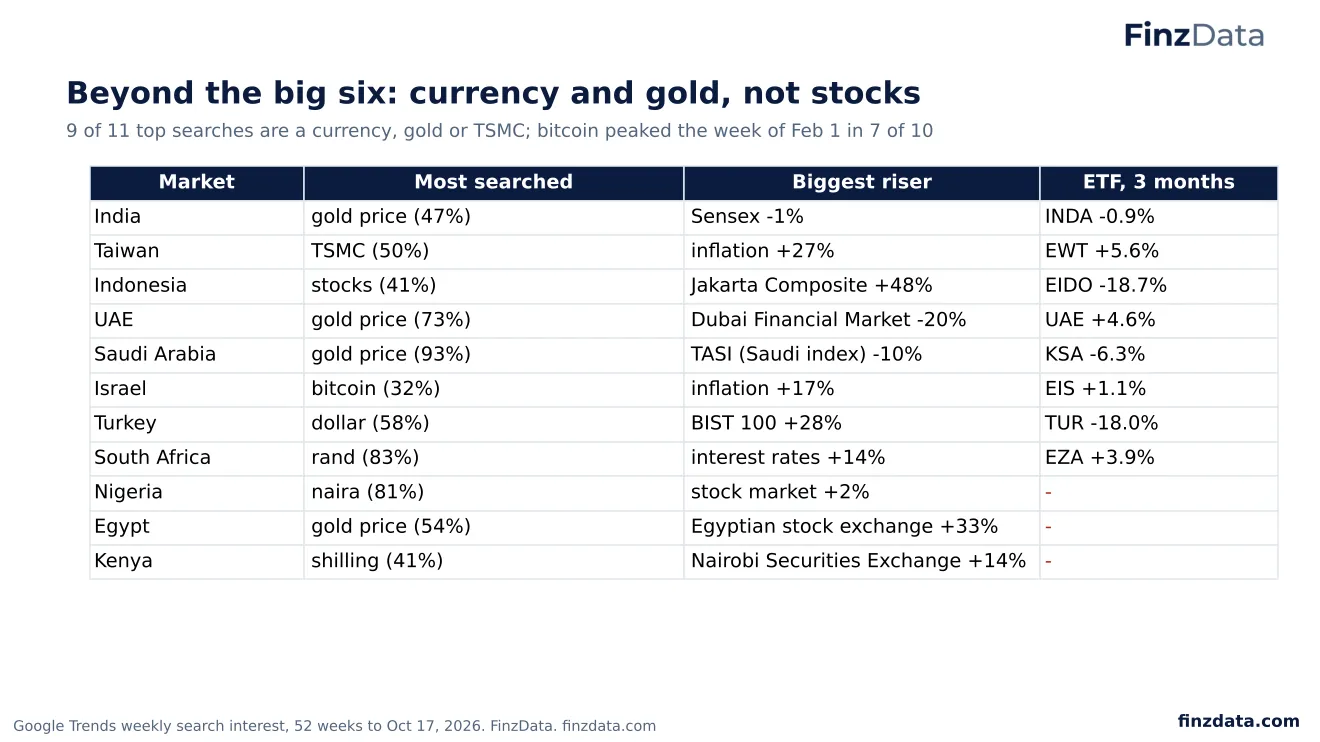
- Beyond the big six: Across 11 more markets in Asia, the Middle East and Africa, people search currencies and gold far more than stock indexes. Gold peaked between late January and late March; bitcoin peaked the week of February 1 in most of them, as in the big six.
3. The numbers that matter
FinzData Research, October 2026.
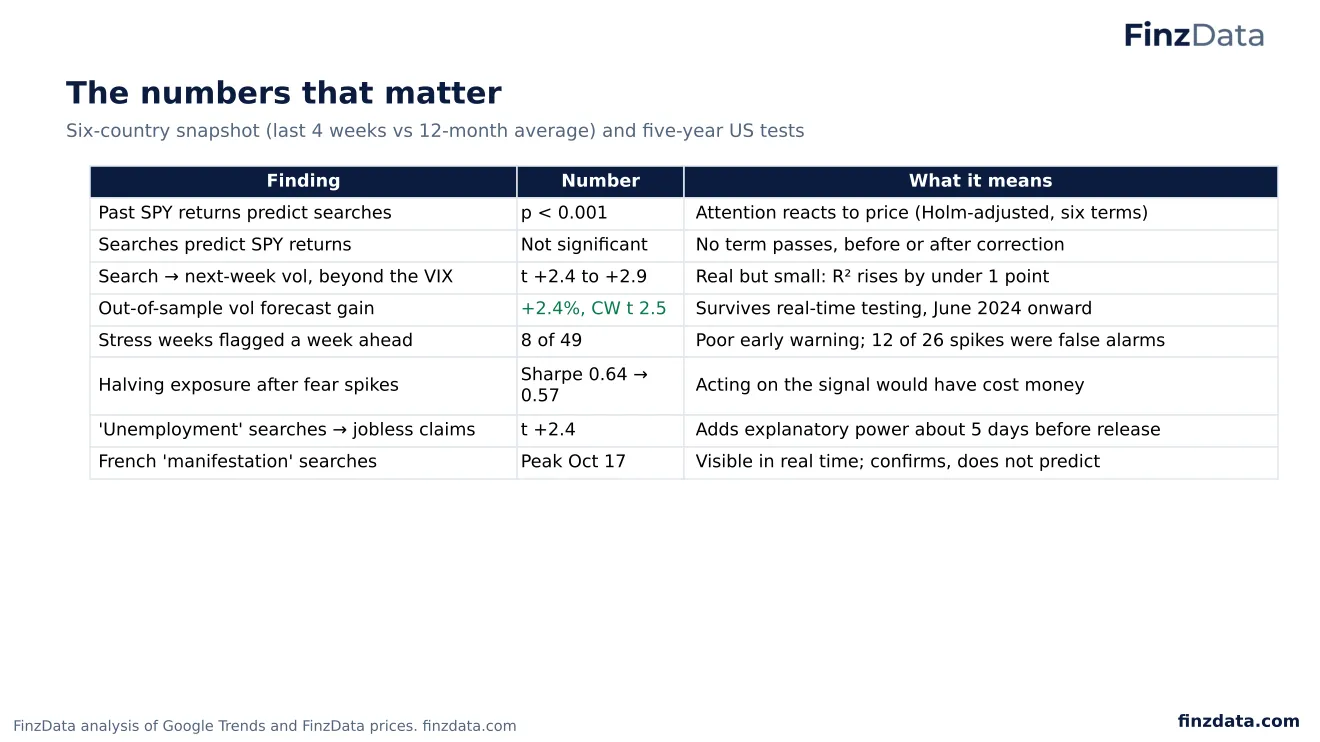
| Finding | Number | What it means |
|---|---|---|
| Past SPY returns predict searches | p < 0.001 | Attention reacts to price (Holm-adjusted, six terms) |
| Searches predict SPY returns | Not significant | No term passes, before or after correction |
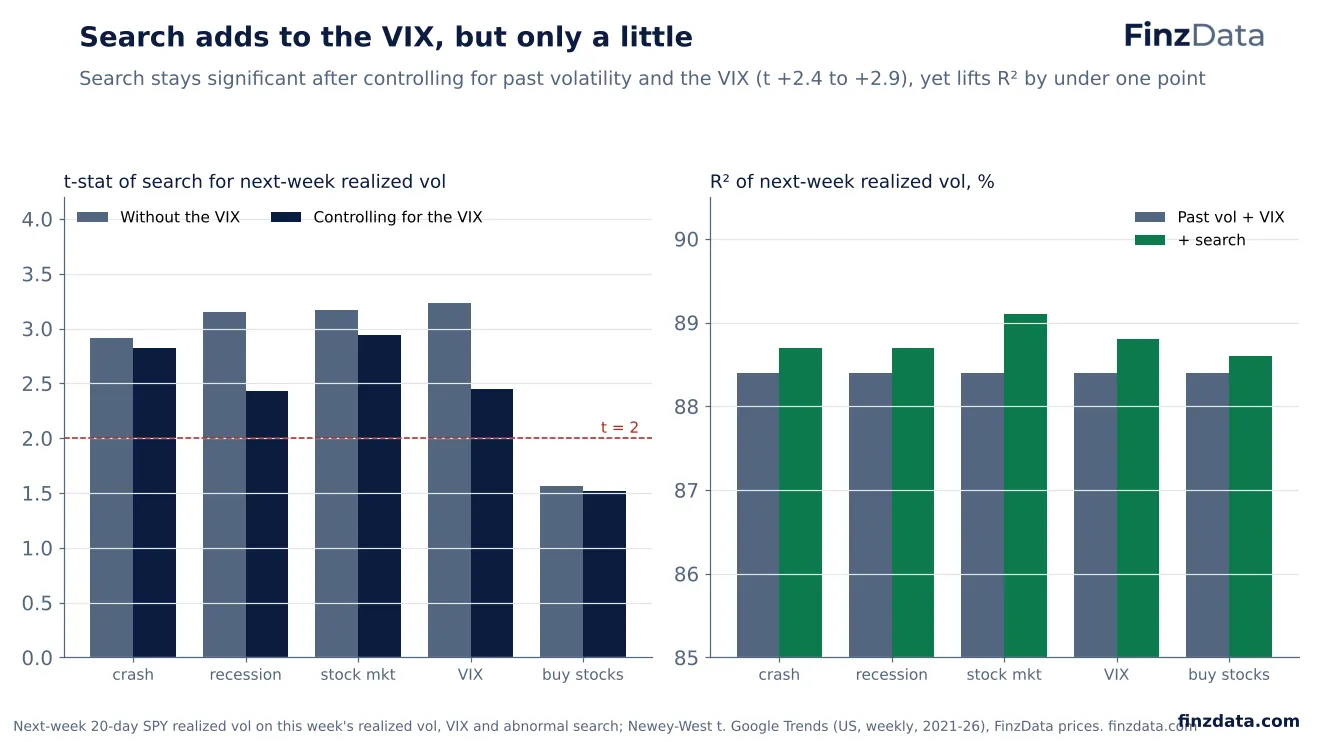
| Search → next-week vol, beyond the VIX | t +2.4 to +2.9 | Real but small: R² rises by under 1 point |
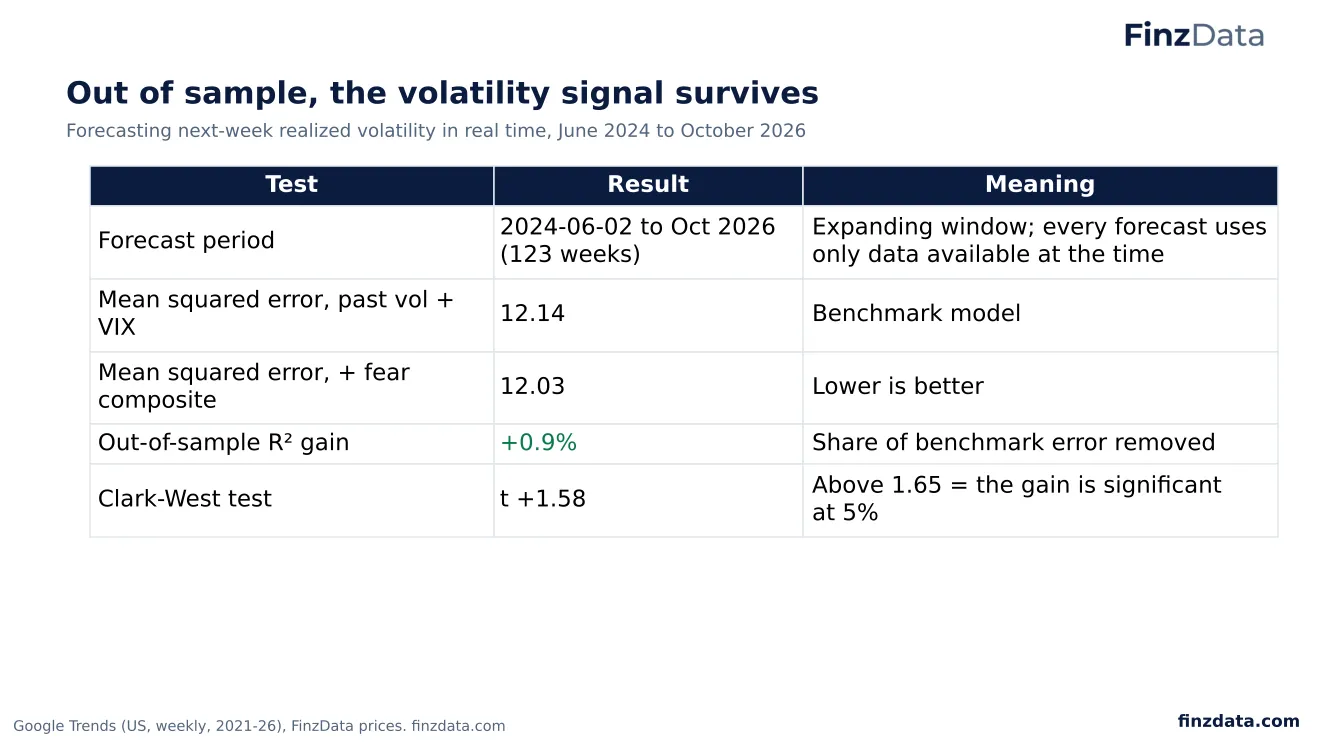
| Out-of-sample vol forecast gain | +2.4%, CW t 2.5 | Survives real-time testing, June 2024 onward |
| Stress weeks flagged a week ahead | 8 of 49 | Poor early warning; 12 of 26 spikes were false alarms |
| Halving exposure after fear spikes | Sharpe 0.64 → 0.57 | Acting on the signal would have cost money |
| 'Unemployment' searches → jobless claims | t +2.4 | Adds explanatory power about 5 days before release |
| French 'manifestation' searches | Peak Oct 17 | Visible in real time; confirms, does not predict |
4. How we measured it
FinzData Research, October 2026.
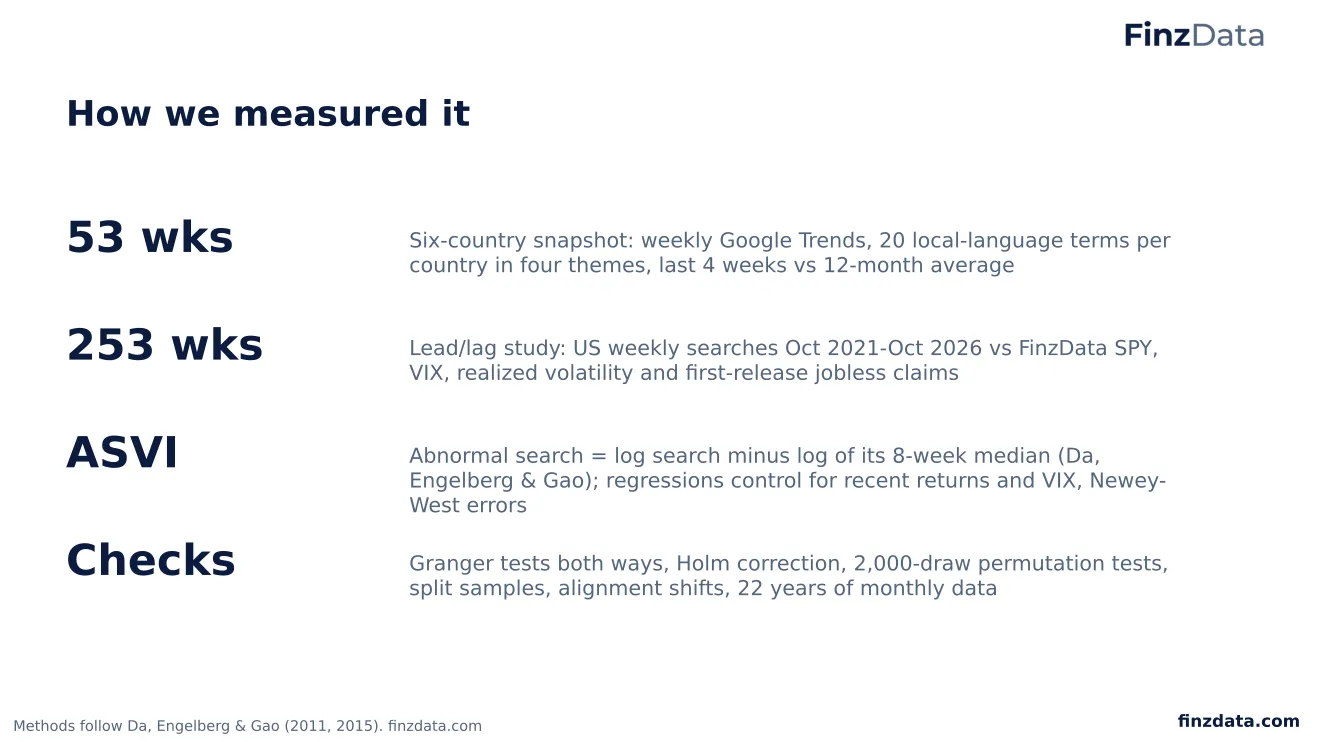
- 53 wks: Six-country snapshot: weekly Google Trends, 20 local-language terms per country in four themes, last 4 weeks vs 12-month average
- 253 wks: Lead/lag study: US weekly searches Oct 2021-Oct 2026 vs FinzData SPY, VIX, realized volatility and first-release jobless claims
- ASVI: Abnormal search = log search minus log of its 8-week median (Da, Engelberg & Gao); regressions control for recent returns and VIX, Newey-West errors
- Checks: Granger tests both ways, Holm correction, 2,000-draw permutation tests, split samples, alignment shifts, 22 years of monthly data
5. Attention to stock markets is below normal everywhere
FinzData Research, October 2026.
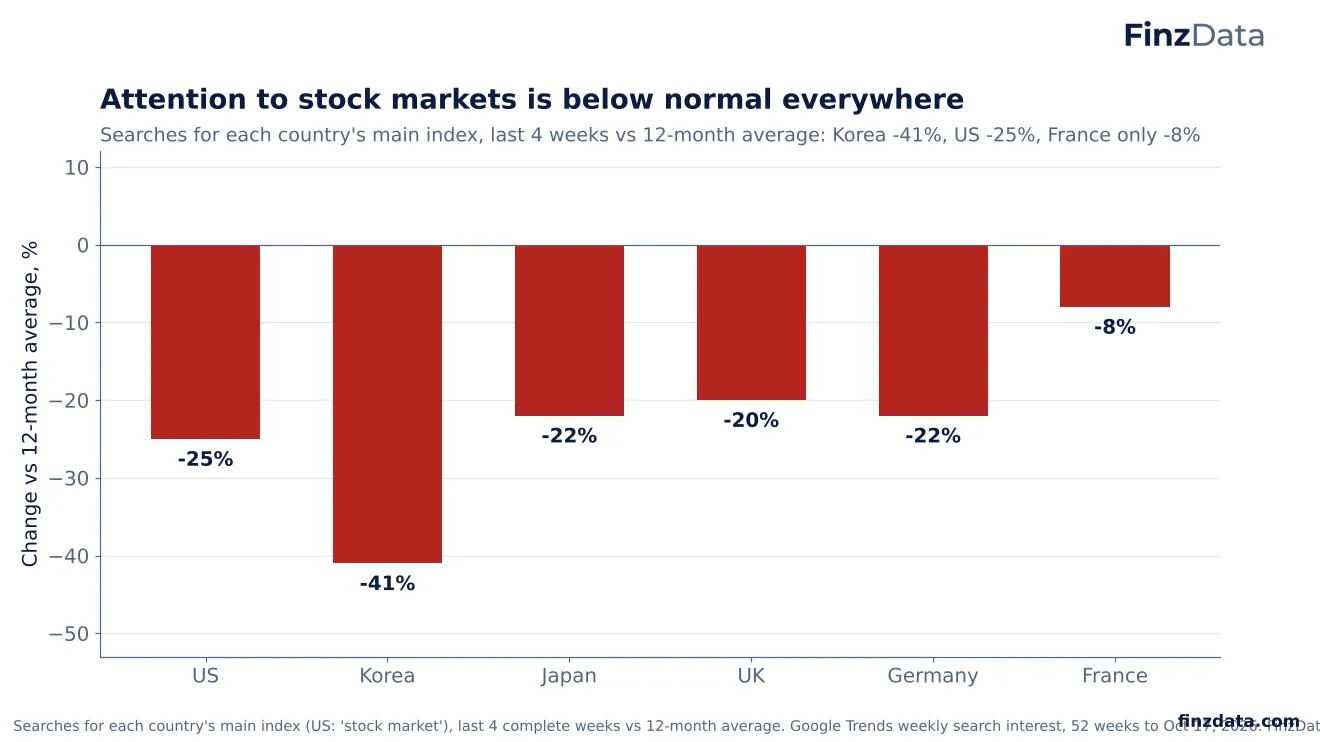
Searches for each country's main stock index were below their 12-month averages in all six core markets in the four weeks to October 17, 2026: Korea -41%, the US -25% (searches for 'stock market'), Japan and Germany -22%, the UK -20% and France -8%. Retail attention to equities is low.
6. The AI-investing search boom has faded everywhere
FinzData Research, October 2026.
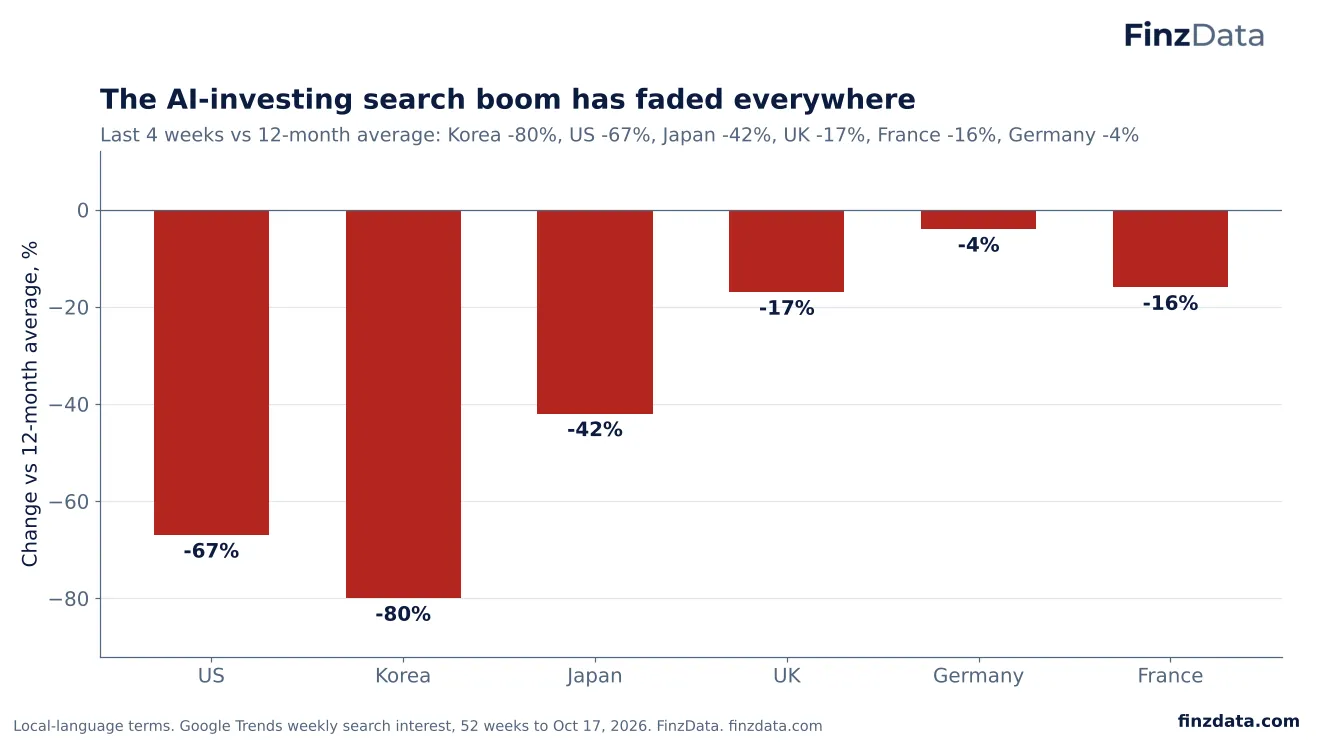
AI-investing searches boomed in the first half of 2026 and have faded everywhere: Korea -80%, the US -67%, Japan -42%, the UK -17%, France -16% and Germany -4% against their 12-month averages.
7. Germany, Japan and France are googling rates more
FinzData Research, October 2026.
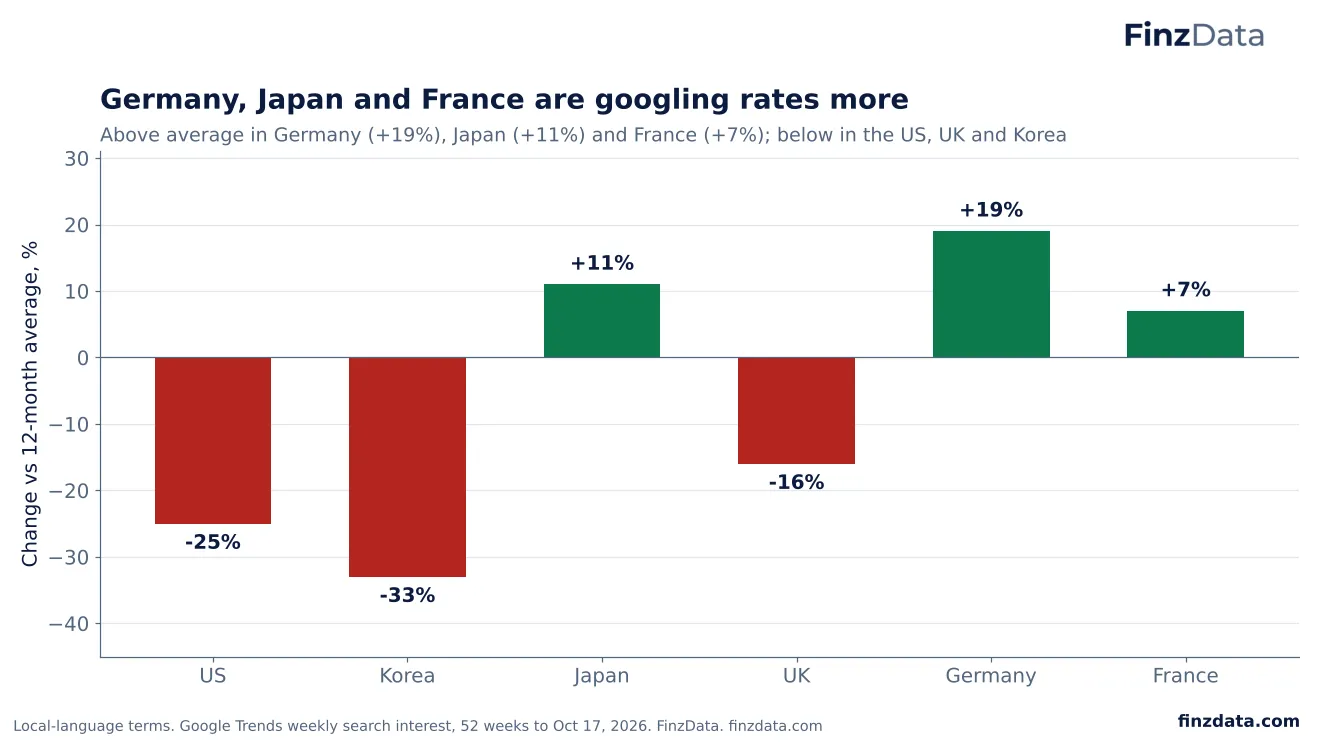
Interest rates are the one economic worry rising: searches are above average in Germany (+19%), Japan (+11%) and France (+7%), and below average in the UK, the US and Korea.
8. Inflation has dropped down the list of worries
FinzData Research, October 2026.
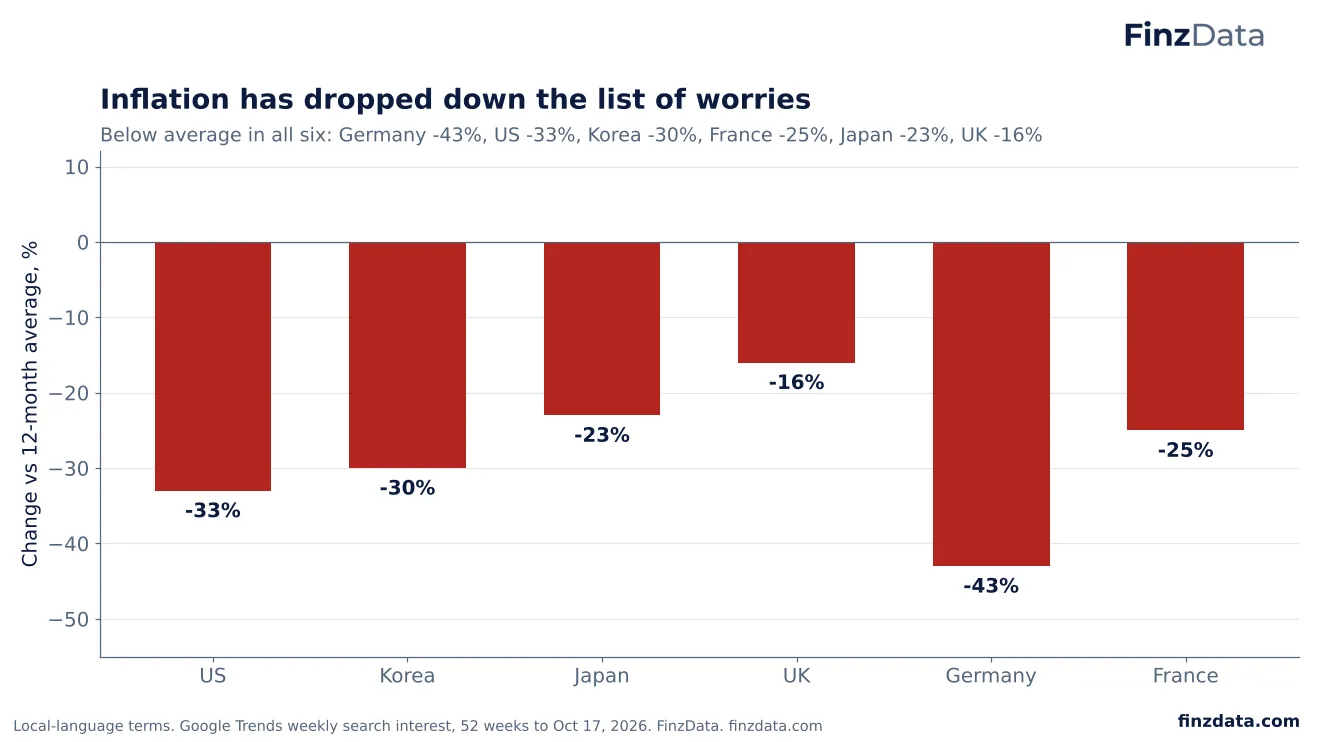
Inflation searches are below their averages in all six countries, most of all in Germany (-43%) and the US (-33%).
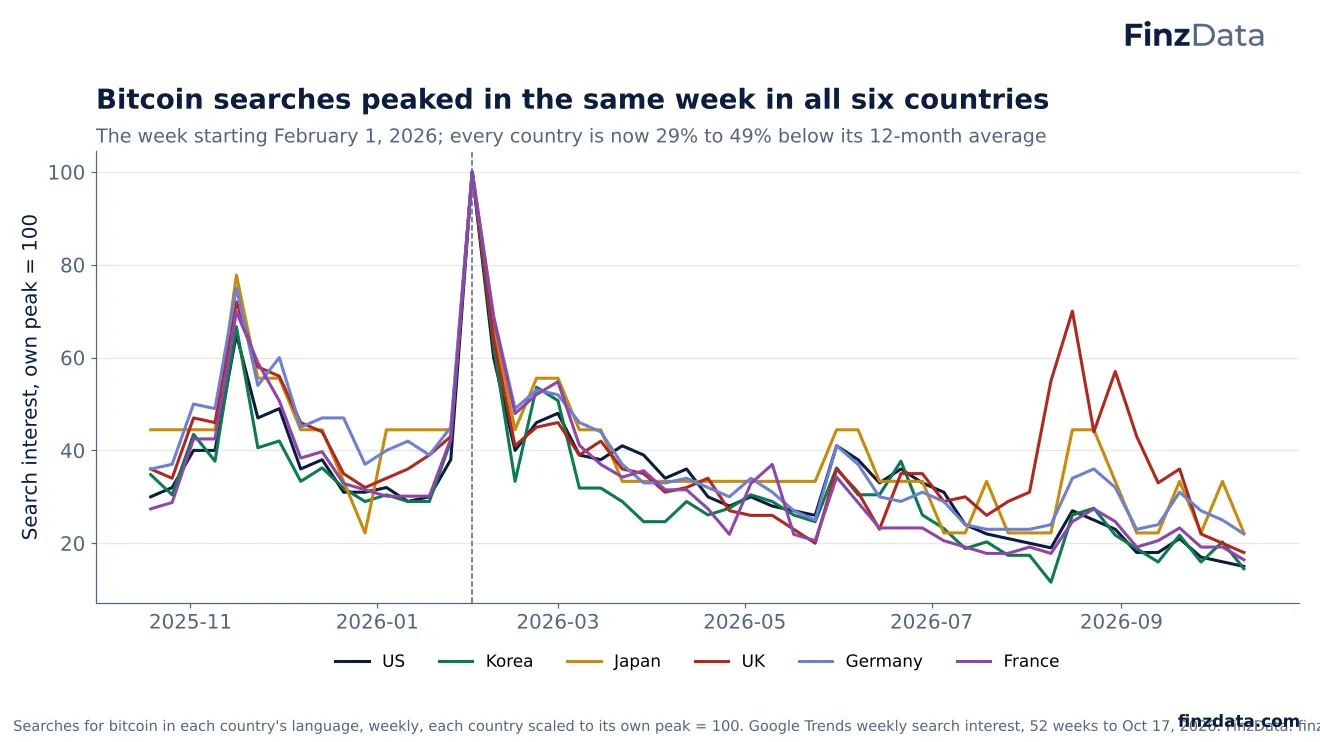
9. Bitcoin searches peaked in the same week in all six countries
FinzData Research, October 2026.
Bitcoin searches peaked in the same week, starting February 1, 2026, in all six countries, and are now 29% to 49% below their 12-month averages: one global retail cycle.
10. KR link
FinzData Research, October 2026.
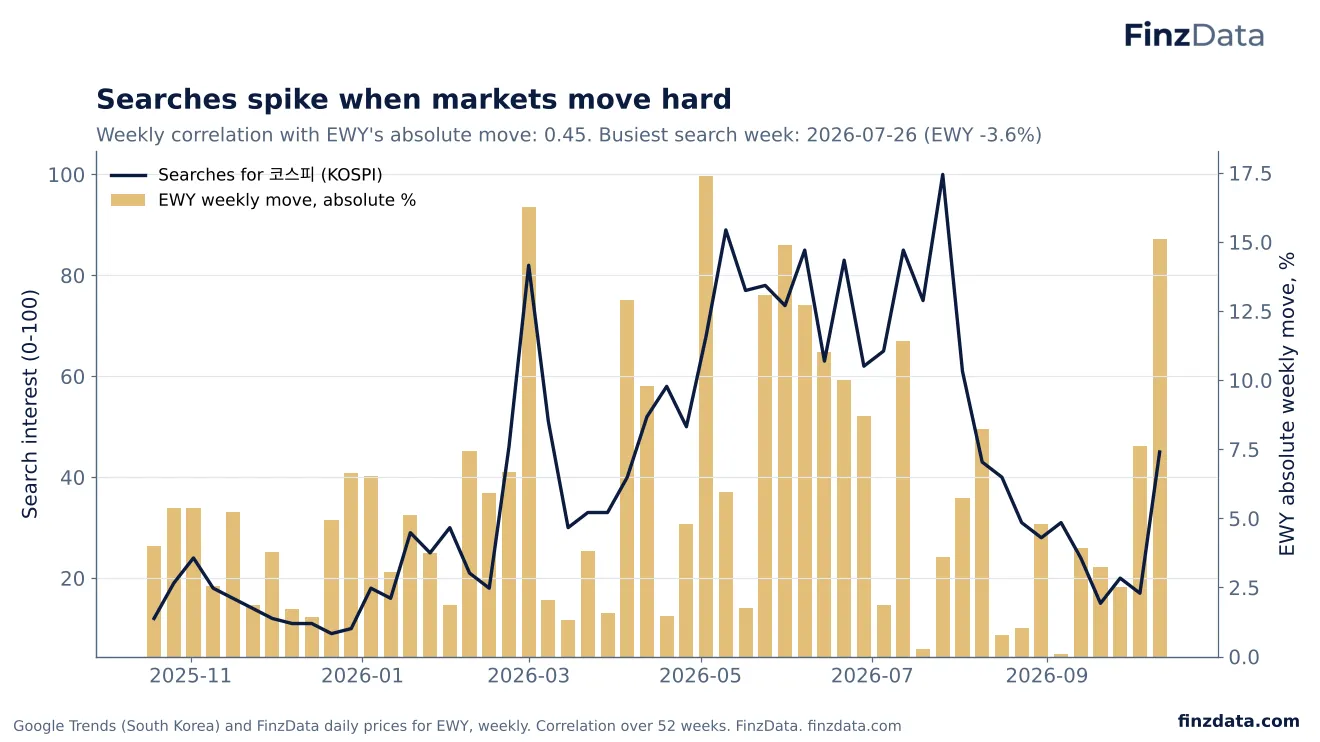
Korean market searches move with both the size and the direction of the market. The weekly correlation between KOSPI searches and EWY's absolute weekly move was 0.45, and with EWY's price level 0.61: Koreans search more when stocks are high. The busiest week, starting July 26, came with a 3.6% EWY fall; the October sell-off produced the latest spike.
11. country table
FinzData Research, October 2026.
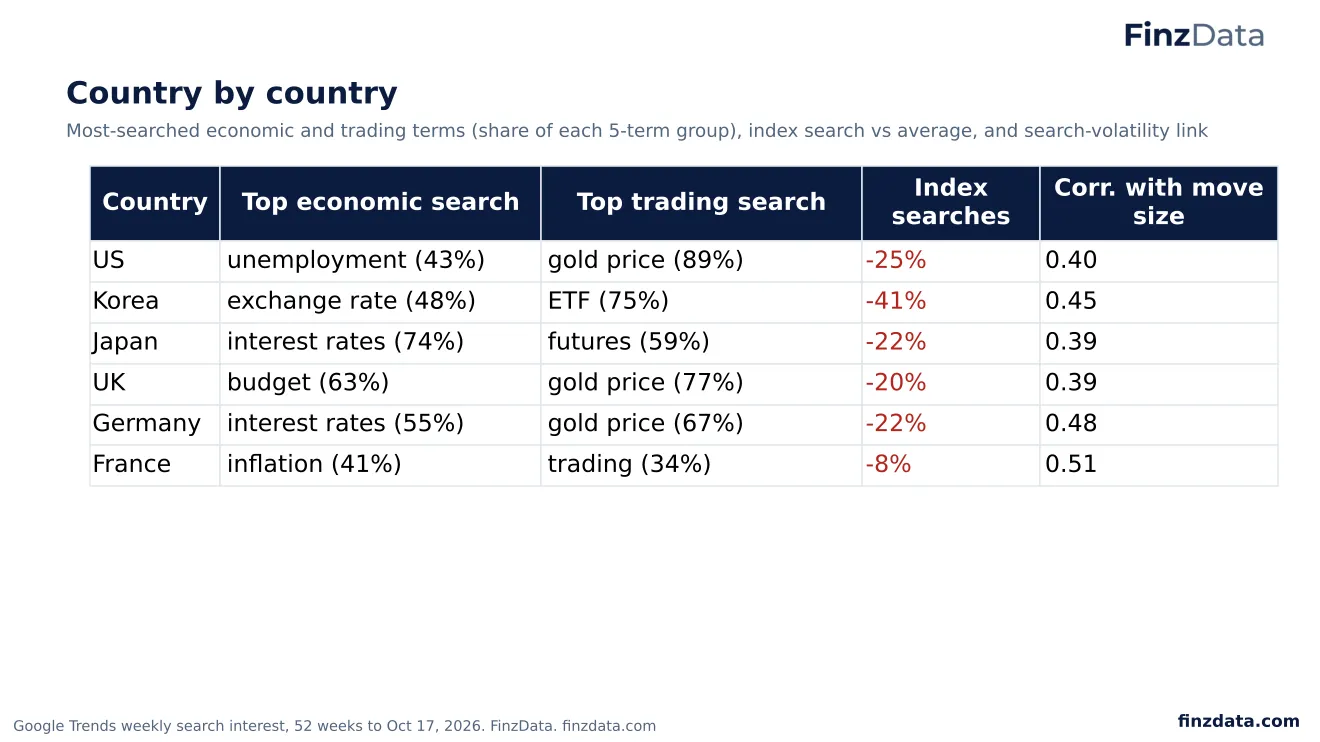
The most-searched economic and trading terms differ by country: unemployment in the US, the exchange rate in Korea, interest rates in Japan and Germany, the Budget in the UK. Gold leads trading searches in the US, UK and Germany. In every market, index searches rise with the size of weekly market moves.
12. fr daily
FinzData Research, October 2026.
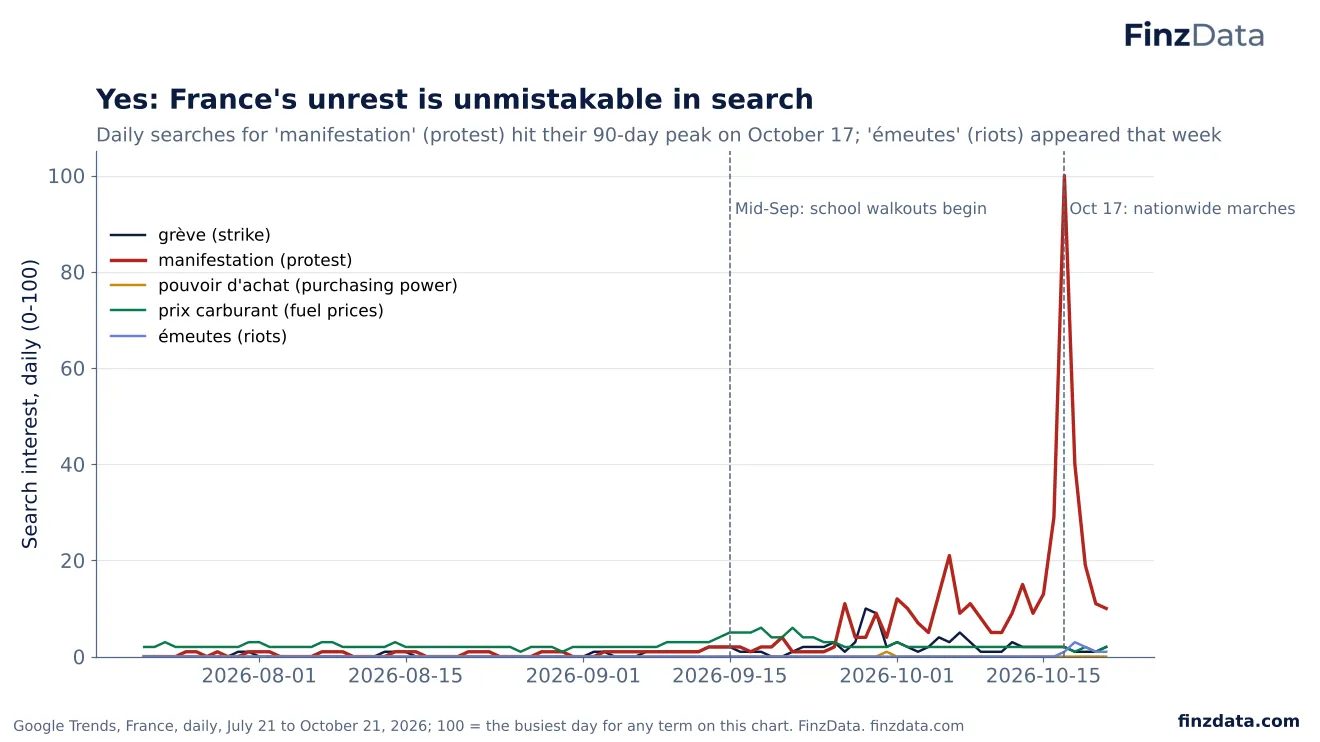
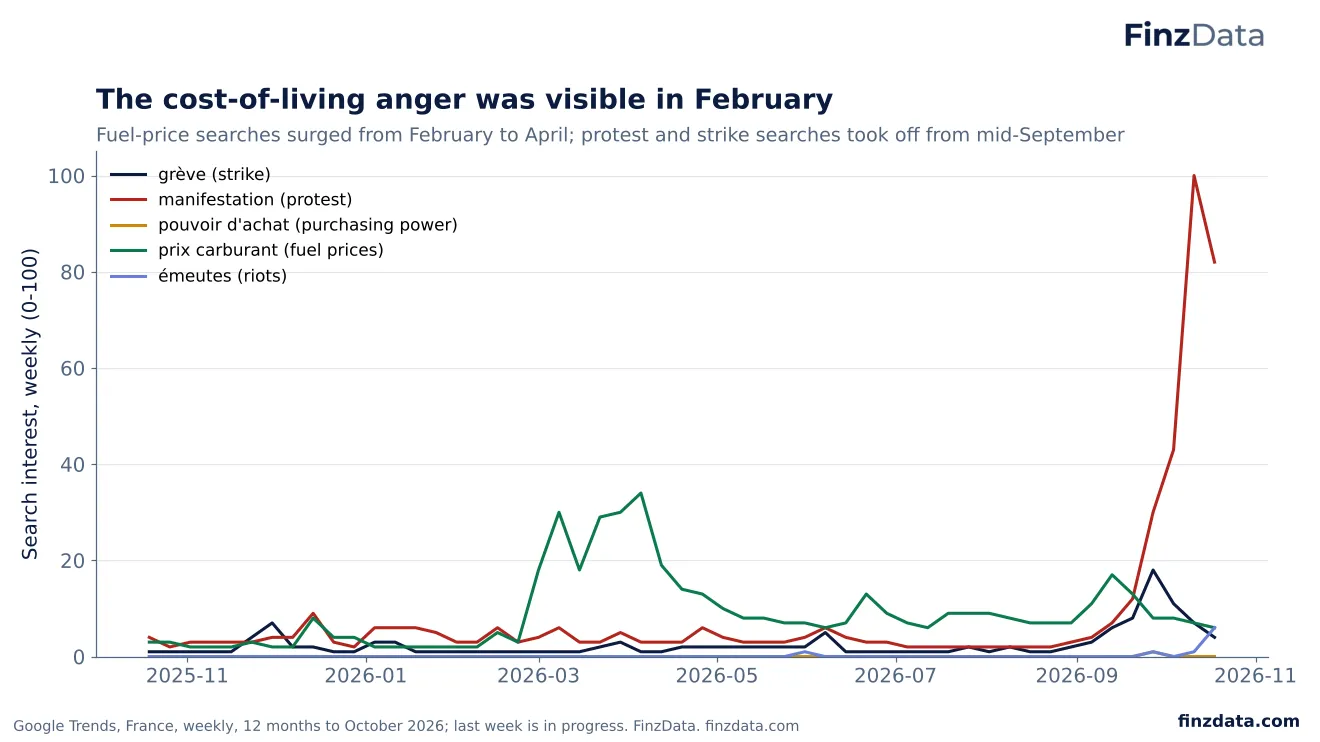
France's unrest is unmistakable in search. Daily searches for 'manifestation' (protest) climbed from mid-September, when school walkouts began in the Paris suburbs, and hit their 90-day peak on October 17, the day 550,000 to 800,000 people marched and violence broke out in several cities. Searches for 'émeutes' (riots) appeared only that week.
A critical caveat: search confirmed the unrest as it happened; it did not predict it. Protest searches rose with the school walkouts, not before them, and one episode cannot show that search anticipates social unrest.
13. fr 12m
FinzData Research, October 2026.
The cost-of-living strain was visible months earlier: French searches for fuel prices ('prix carburant') surged between February and April 2026. Strike and protest searches then took off from mid-September. France's unemployment searches are 10% above average and recession searches 44% above, from a small base.
The fuel-price surge came seven months before the October protests. It fits the story of building cost-of-living strain, but with a single episode we cannot say whether fuel-price searches reliably precede unrest.
14. India: gold outsearched the stock indexes
FinzData Research, October 2026.
15. Taiwan: TSMC and the market are one search
FinzData Research, October 2026.
16. Indonesia: the Jakarta index is back in focus
FinzData Research, October 2026.
17. UAE: gold is the market people search
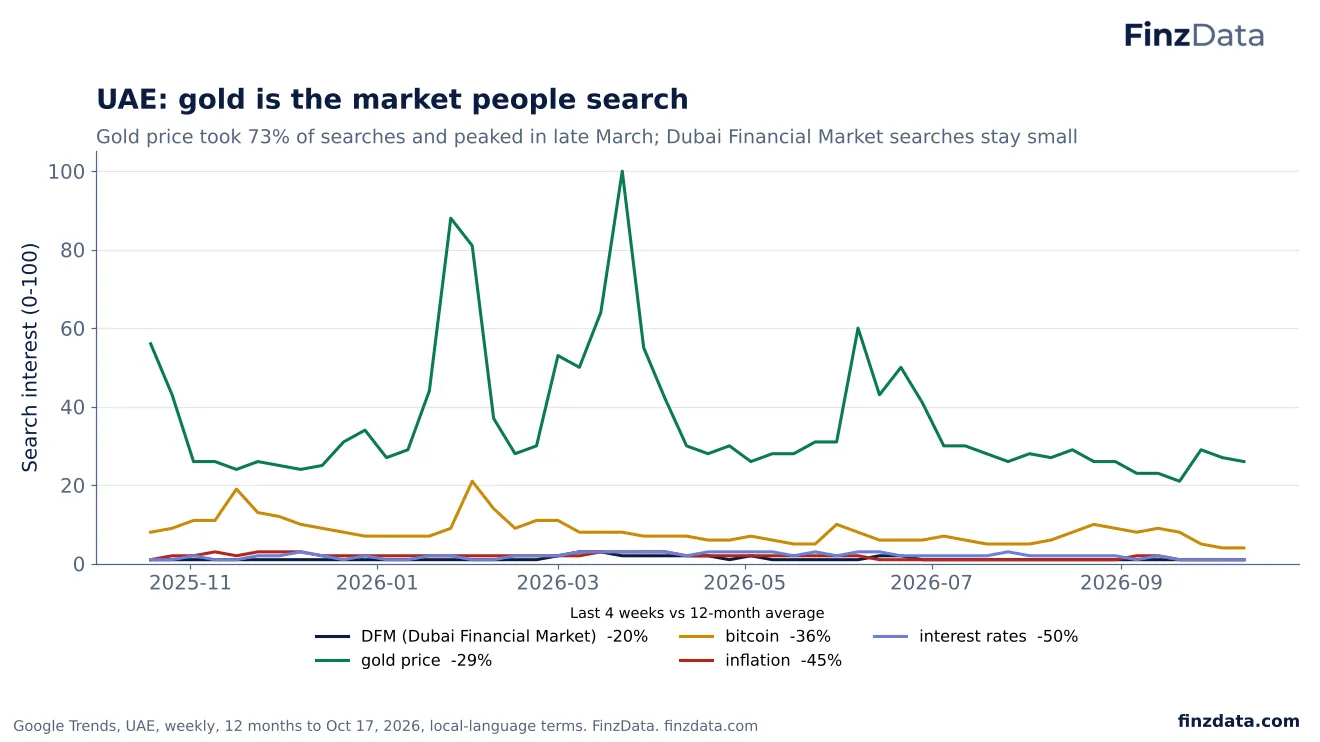
FinzData Research, October 2026.
18. Saudi Arabia: gold eclipses everything else
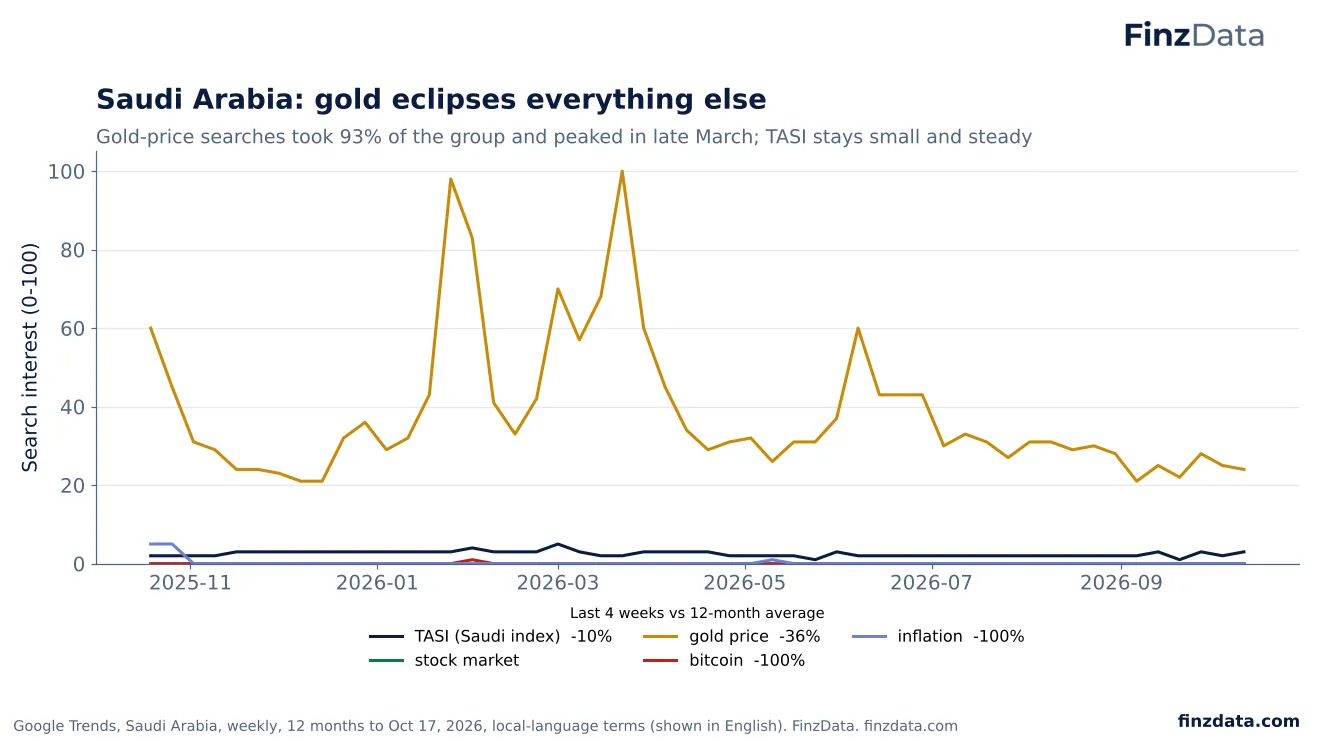
FinzData Research, October 2026.
19. Israel: bitcoin, rates and stocks share attention
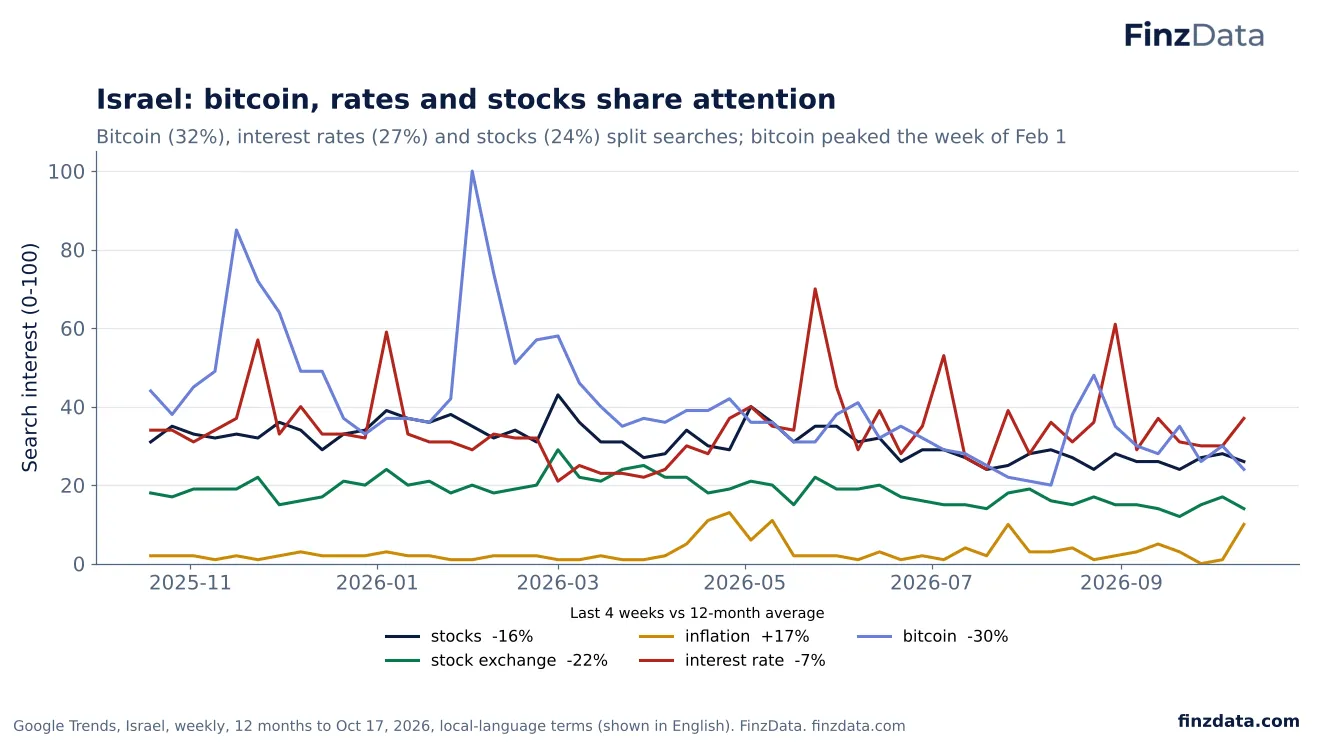
FinzData Research, October 2026.
20. Turkey: the dollar never leaves the search bar
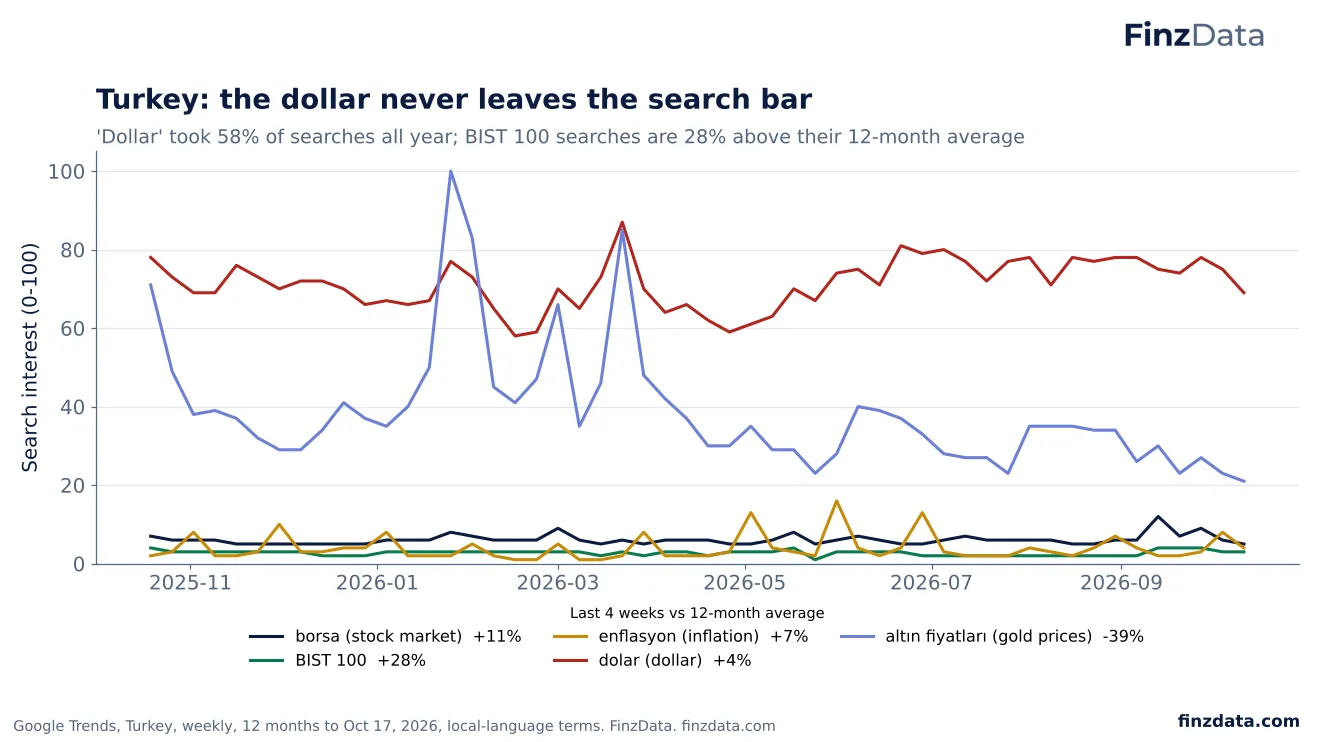
FinzData Research, October 2026.
21. South Africa: the rand is the market
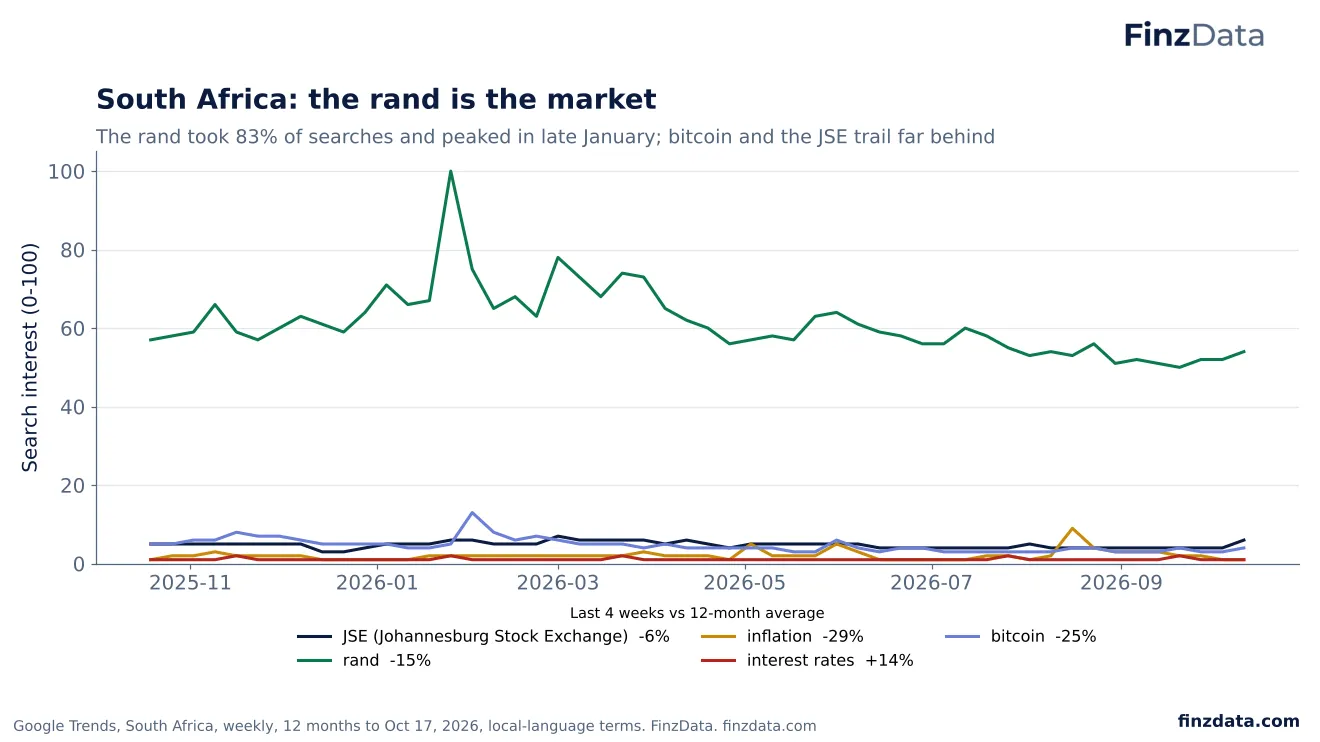
FinzData Research, October 2026.
22. Nigeria: the naira is the only number that matters
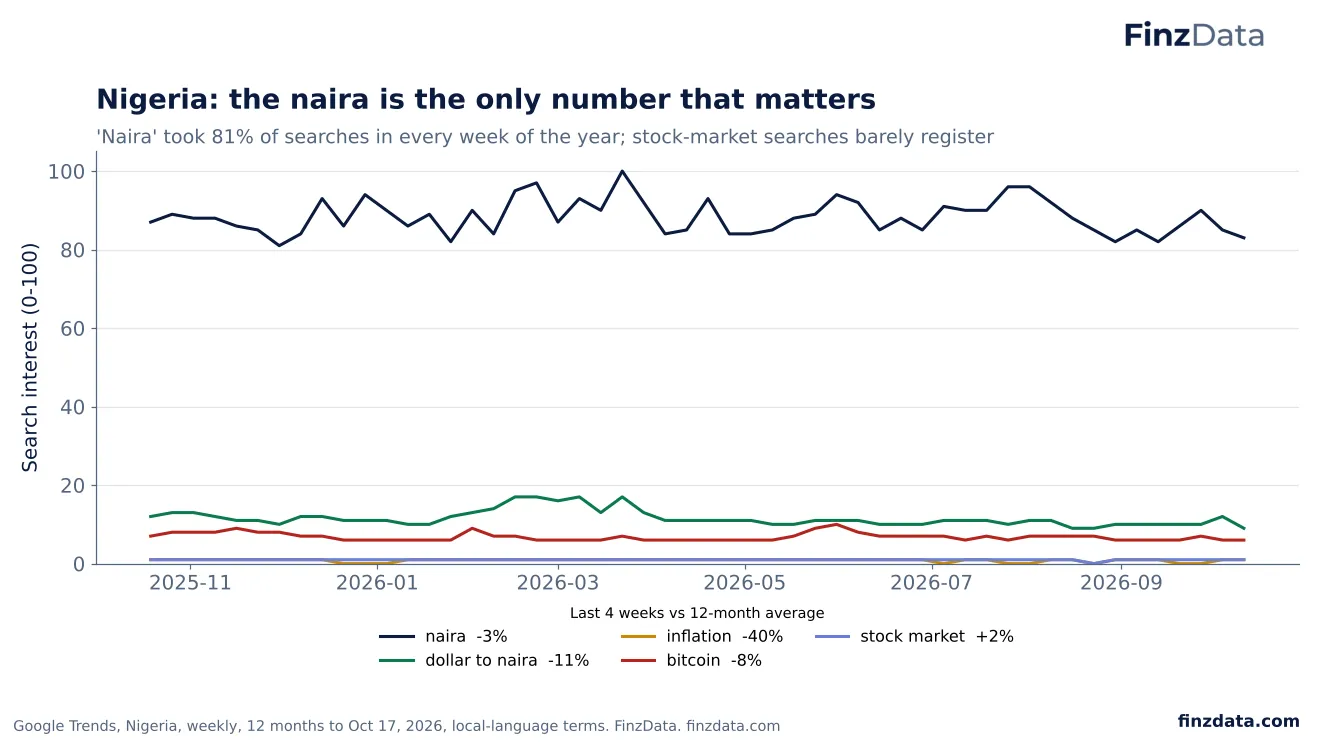
FinzData Research, October 2026.
23. Egypt: the dollar rate and gold, not stocks
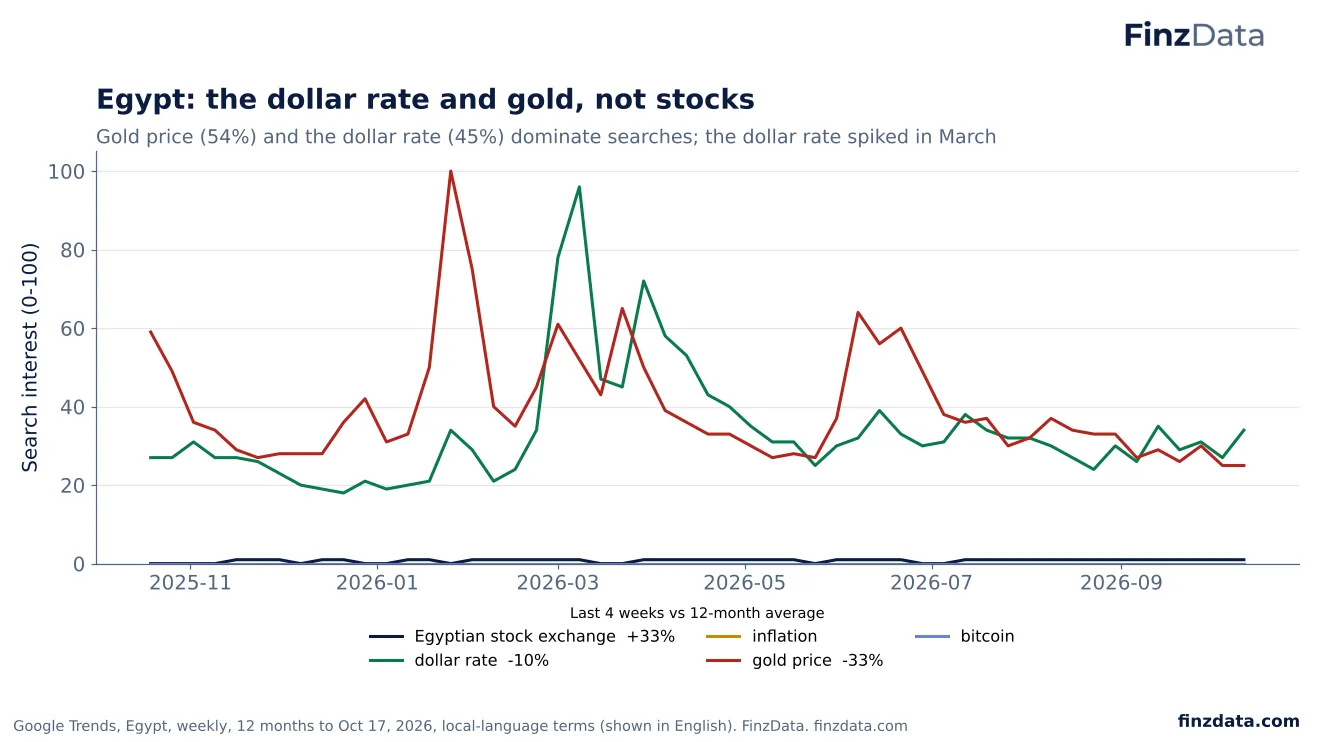
FinzData Research, October 2026.
24. Kenya: the shilling leads, the exchange is rising
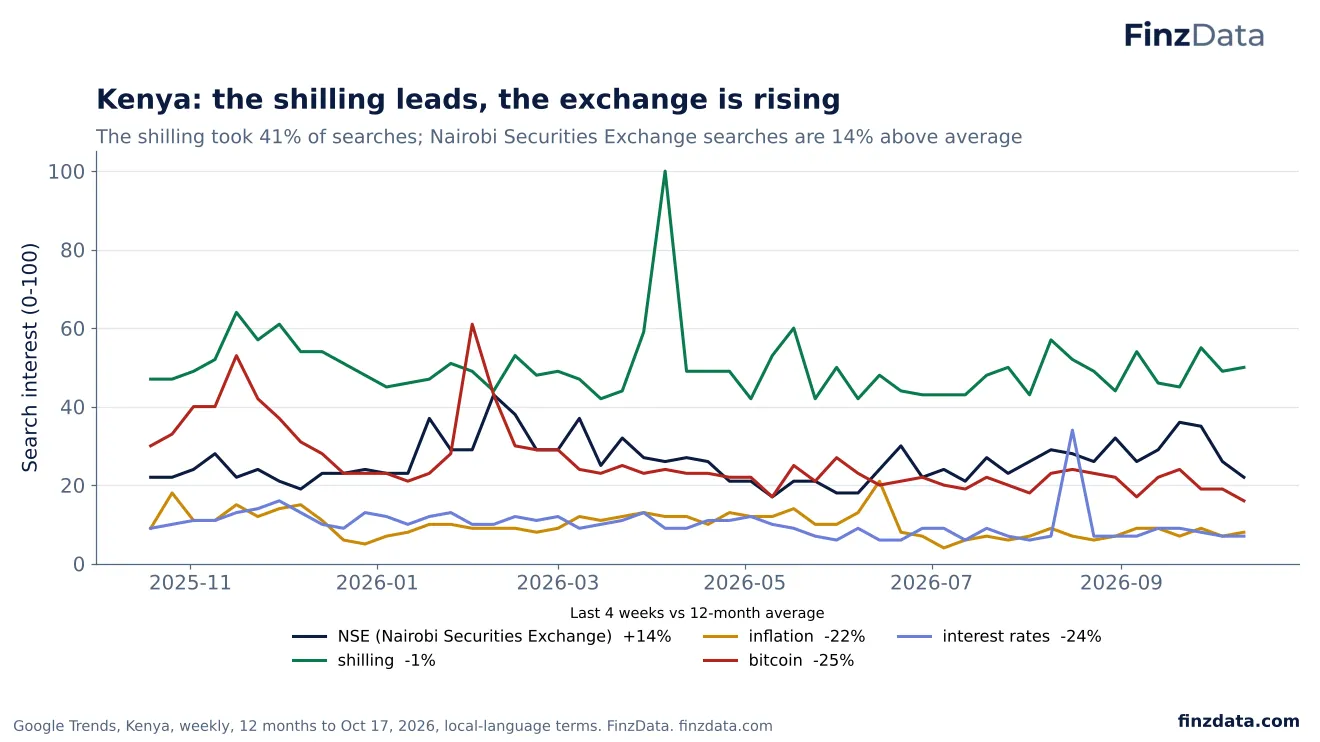
FinzData Research, October 2026.
25. Beyond the big six: currency and gold, not stocks
FinzData Research, October 2026.
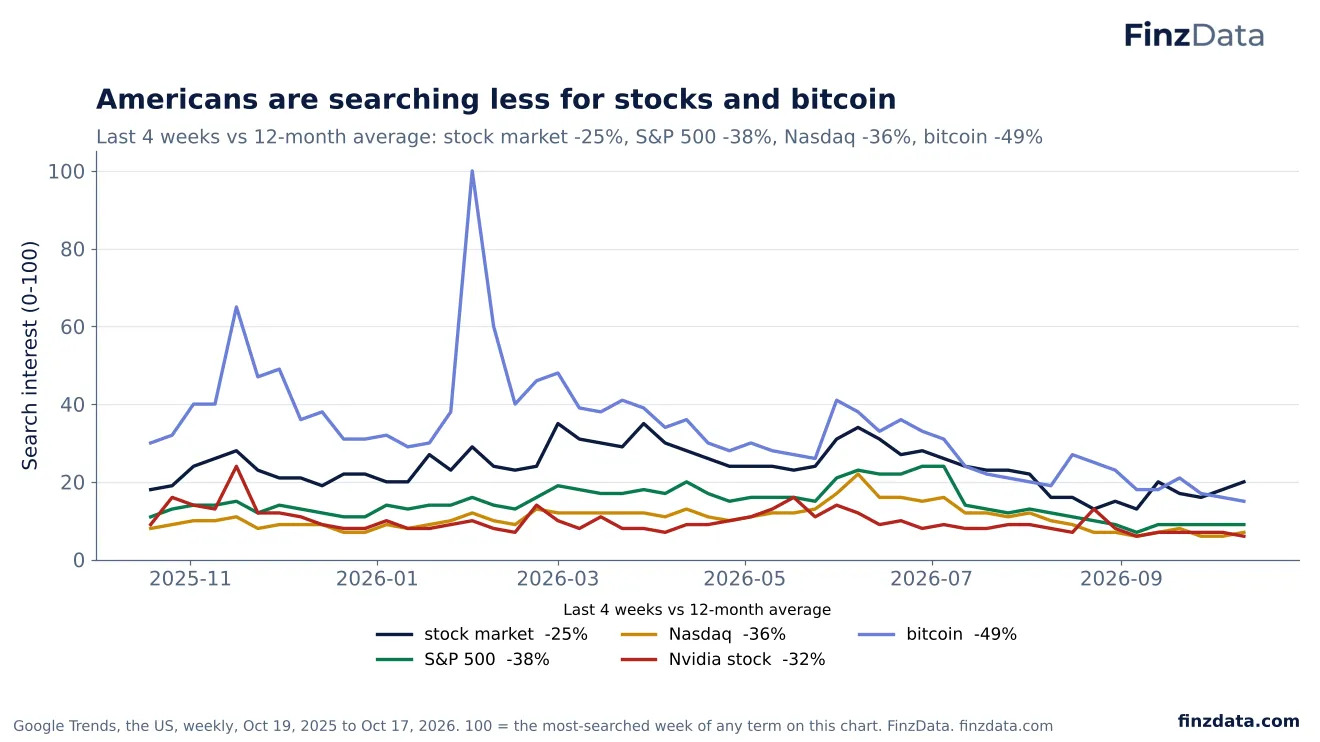
26. Americans are searching less for stocks and bitcoin
FinzData Research, October 2026.
Every market term we tracked is searched less now than over the past year. Over the last four weeks, searches for "stock market" ran 25% below their 12-month average, "S&P 500" 38% below, "Nasdaq" 36% below and "Nvidia stock" 32% below. Bitcoin is still the most-searched term in the group (37% of its searches over the year) but has fallen furthest, down 49% from its average after peaking the week of February 1.
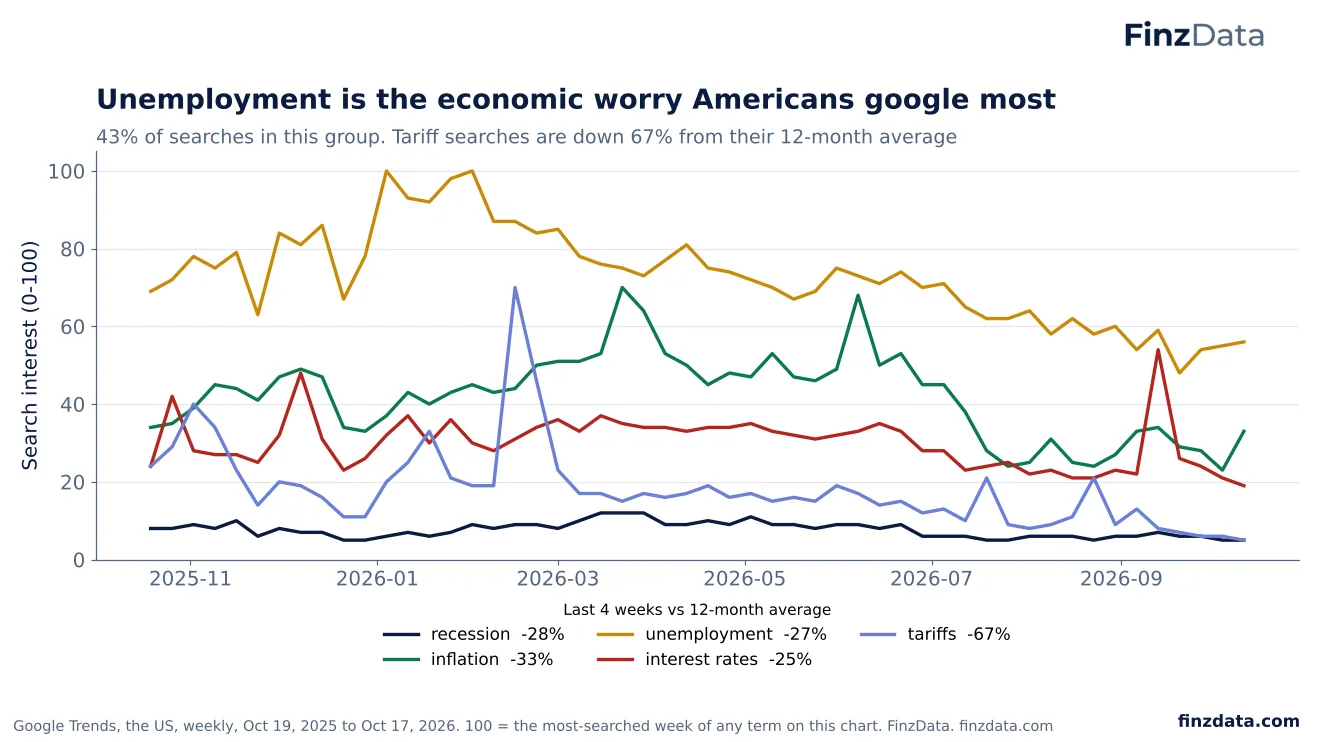
27. Unemployment is the economic worry Americans google most
FinzData Research, October 2026.
Unemployment is what Americans search most about the economy: 43% of searches in this group over the past year, peaking the first week of January. Inflation is second at 25%. All five terms are below their 12-month averages, and tariffs have dropped the most, down 67% since their peak in the week of February 15.
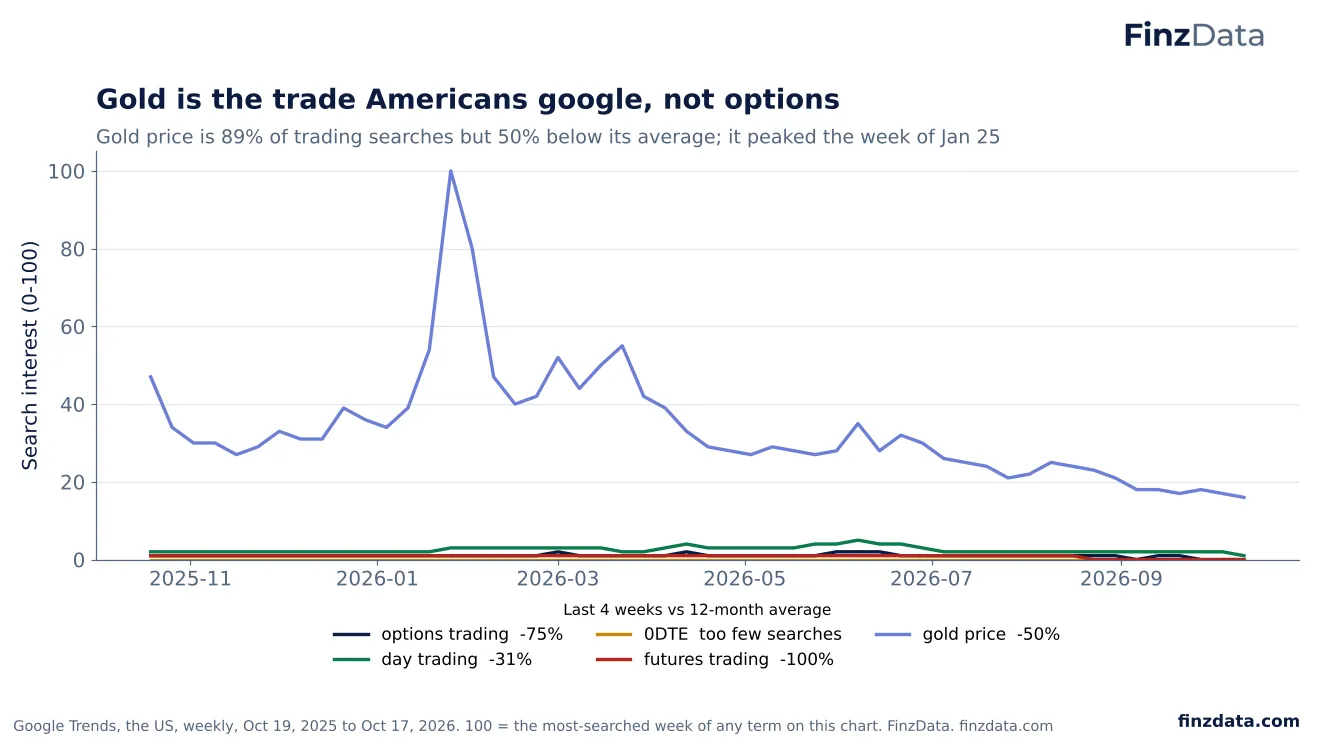
28. Gold is the trade Americans google, not options
FinzData Research, October 2026.
Gold price dominates US trading searches: 89% of the group over the year, with a peak the week of January 25. Searches for options trading, day trading and futures trading barely register beside it, and "0DTE" is too rare to measure. Even gold searches are now half their 12-month average.
29. The AI-trading search boom has faded
FinzData Research, October 2026.
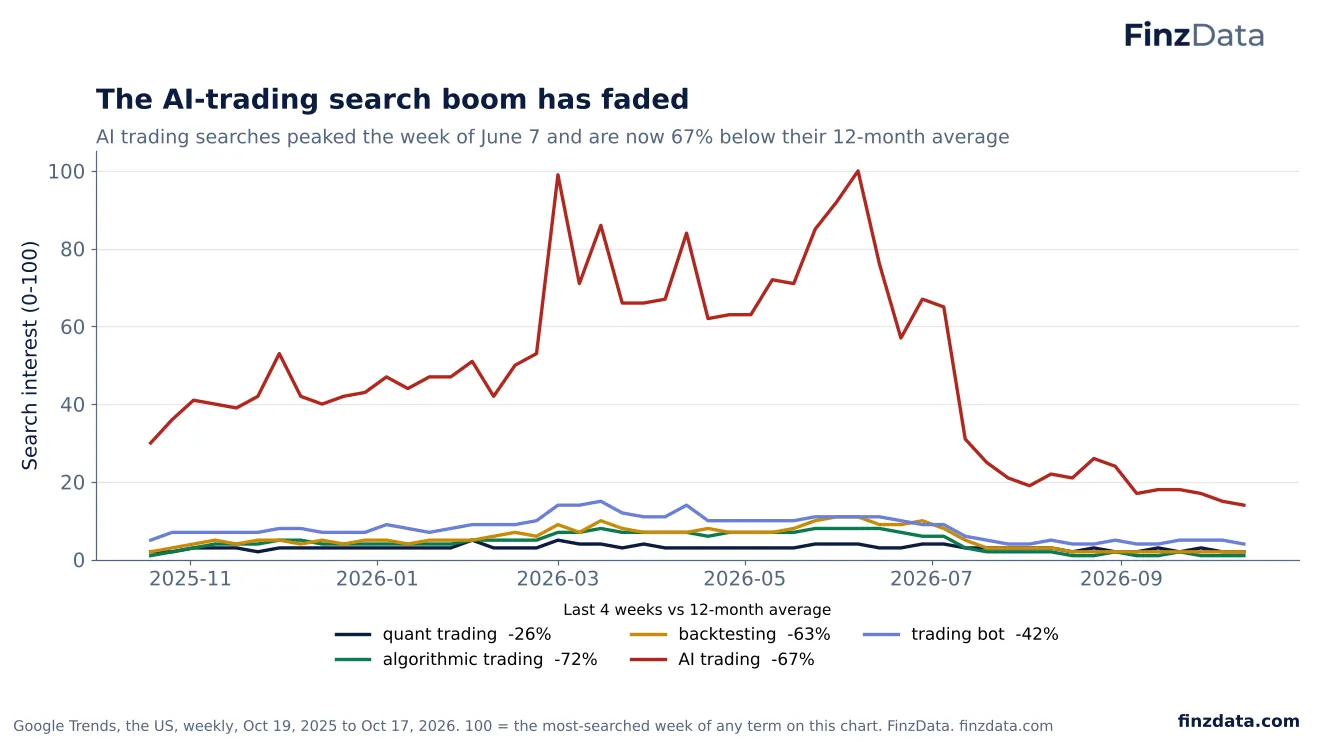
"AI trading" was the quant-and-AI search story of 2026: 70% of searches in this group, rising to a peak the week of June 7. Since July it has collapsed and is now 67% below its 12-month average. Searches for algorithmic trading (-72%) and backtesting (-63%) have fallen even more.
30. US link
FinzData Research, October 2026.
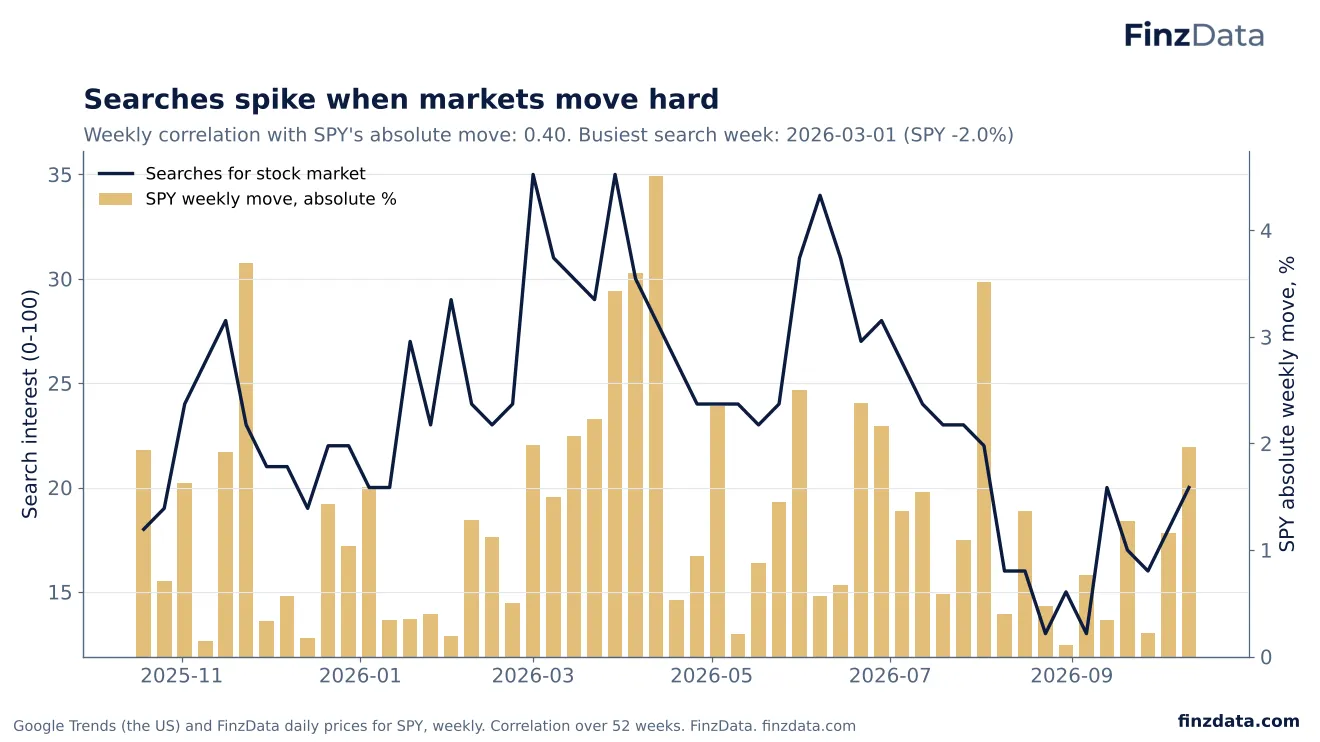
Market searches rise when the market moves hard. Across 52 weeks, the weekly correlation between searches for "stock market" and SPY's absolute weekly move was 0.40. The busiest search week, starting March 1, saw SPY fall 2.0%. Searches were lower when prices were higher (correlation -0.48), which fits today's quiet, low-attention market.
31. US rising
FinzData Research, October 2026.
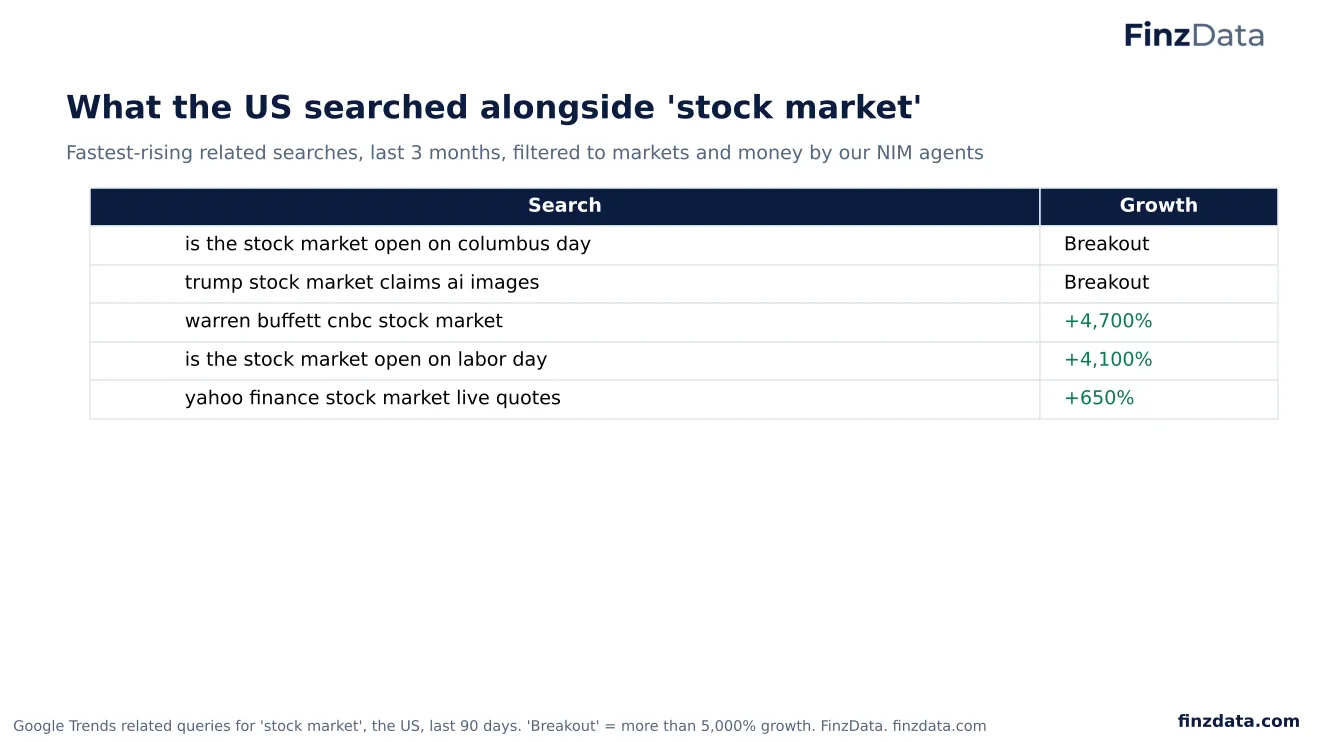
The fastest-rising searches linked to "stock market" over the last 90 days are mostly practical: whether markets are open on Columbus Day and Labor Day. Searches about Warren Buffett on CNBC (+4,700%) and a story on AI images of market claims also broke out. Overall, the most common related searches are "stock market today" and "stock market news".
32. KOSPI searches jumped as Korean stocks fell
FinzData Research, October 2026.
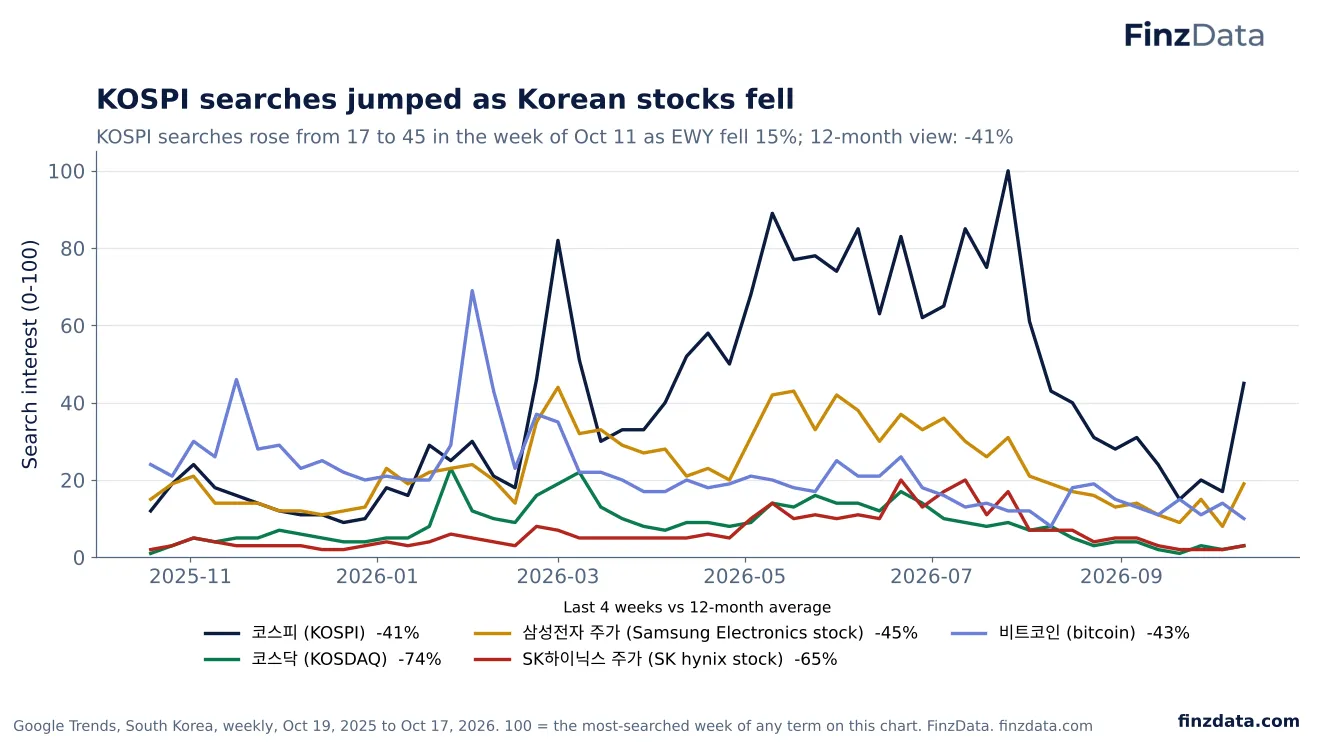
Korean searches for the KOSPI (코스피) are the most popular market search in the country, 41% of the group over the year, and they follow the market closely. They peaked the week of July 26 and then faded, but in the week of October 11 they jumped 2.6 times, from 17 to 45, as Korean stocks sold off: EWY fell 15% that week. Samsung Electronics (-45% vs average) and SK hynix (-65%) searches are still well below their peaks.
33. The won and housing are what Koreans google
FinzData Research, October 2026.
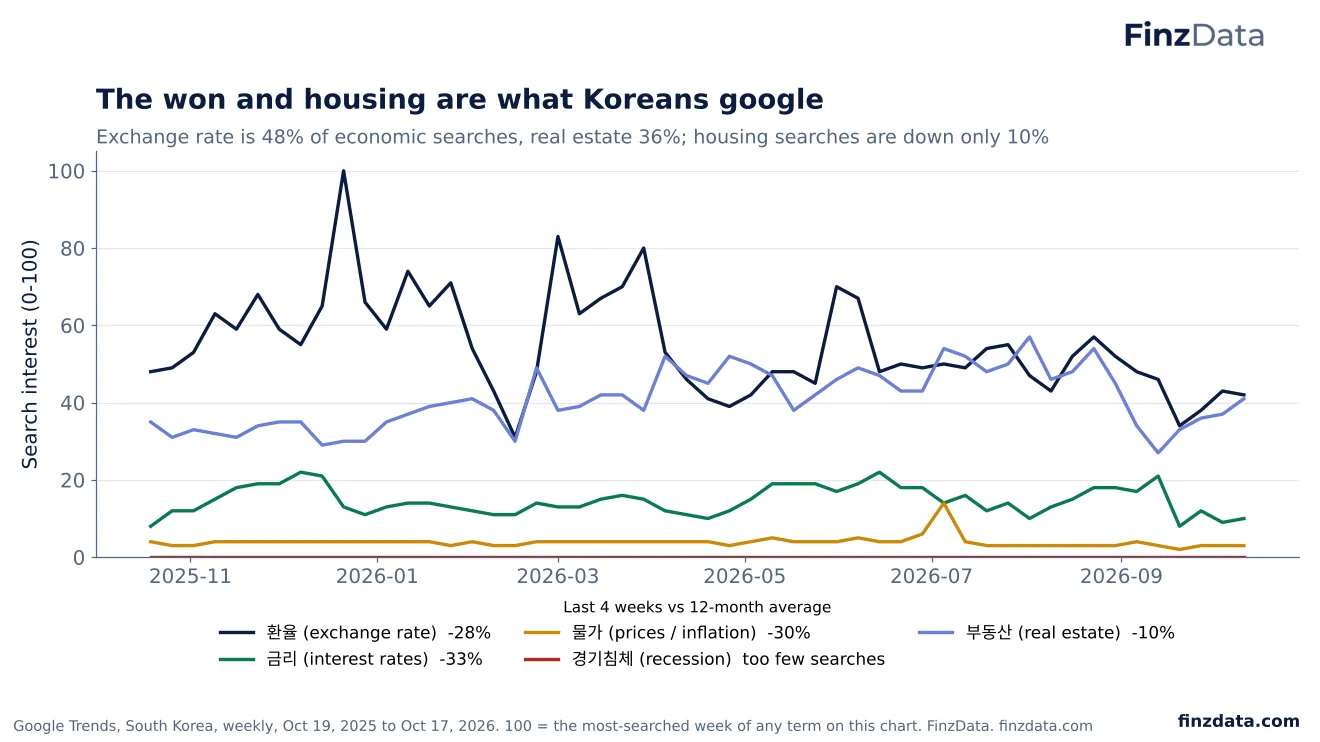
Koreans search about the exchange rate (환율) more than anything else in the economy: 48% of searches in this group, with a peak the week of December 21, 2025. Real estate (부동산) is second at 36% and has held up best, only 10% below its 12-month average and peaking as recently as the week of August 2. Searches for recession (경기침체) barely register.
34. Korea's ETF search boom has burst
FinzData Research, October 2026.
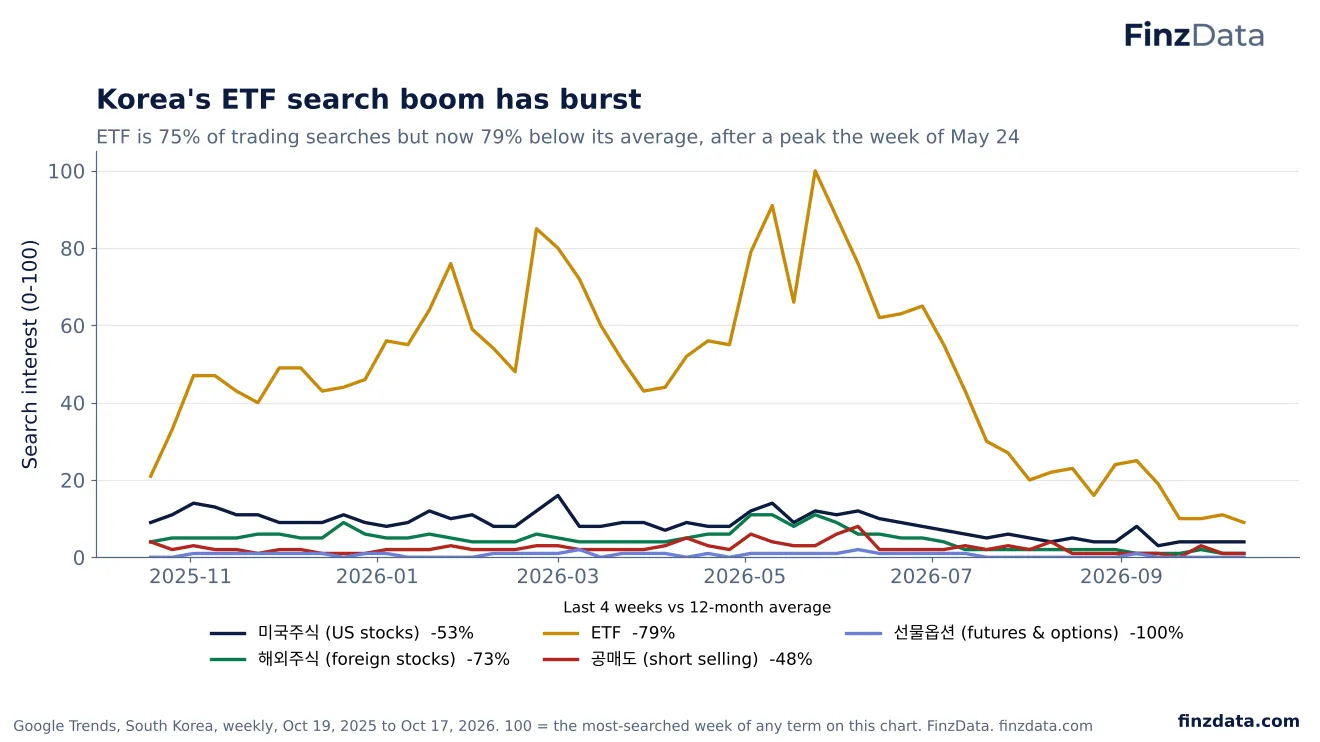
ETF searches dominated Korean trading searches in 2026, 75% of this group, and peaked the week of May 24. They have since collapsed to 79% below their 12-month average. Searches for US stocks (-53%) and foreign stocks (-73%) have fallen too, and short selling (공매도) searches are down 48%.
35. AI investing searches are down 80% from their average
FinzData Research, October 2026.
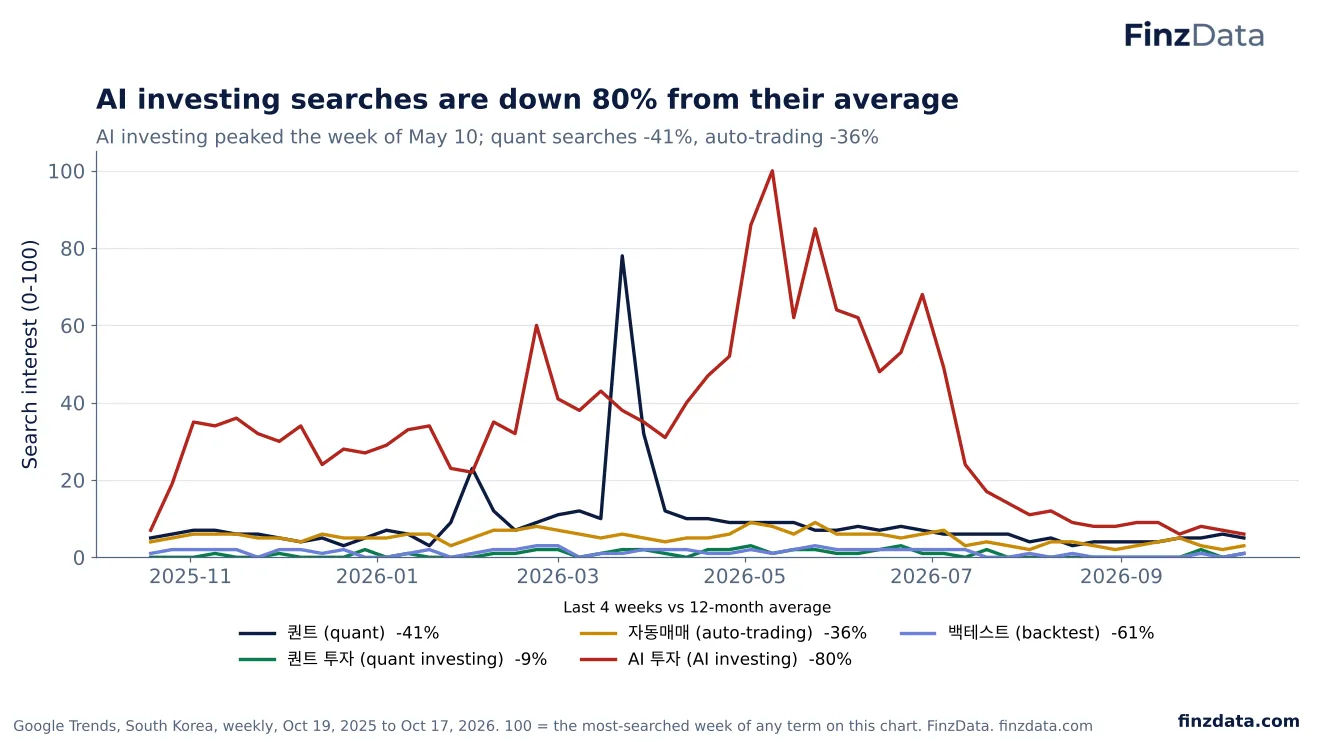
AI investing (AI 투자) is Korea's dominant quant search, 68% of the group, and it peaked the week of May 10. It is now 80% below its 12-month average. Searches for quant (퀀트) spiked once, in the week of March 22, and are 41% below average; auto-trading (자동매매) is down 36%.
36. KR rising
FinzData Research, October 2026.
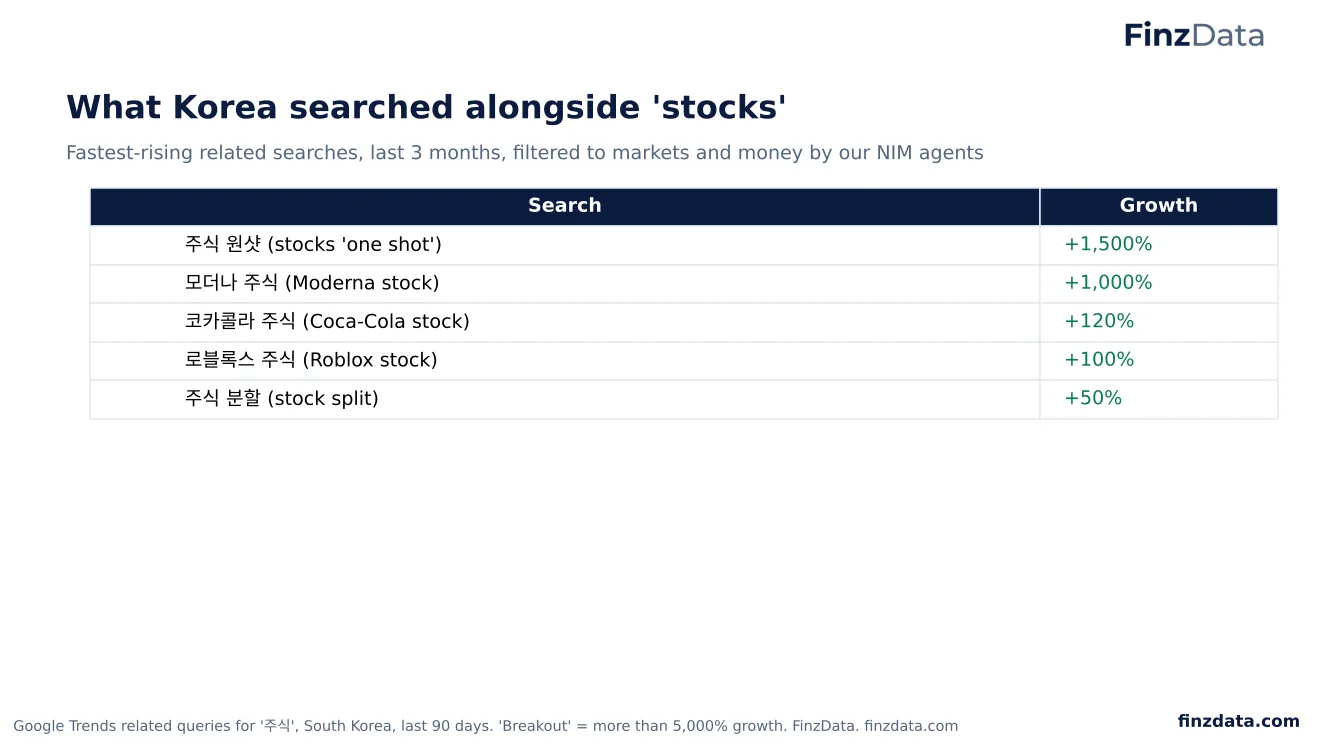
Over 90 days, the fastest-rising searches around 주식 (stocks) point abroad: Moderna (+1,000%), Coca-Cola (+120%) and Roblox (+100%) stock. Stock splits are rising too (+50%). The most common related searches remain Samsung, US stocks and SK hynix.
37. Japanese stock searches have cooled, but less than in the US
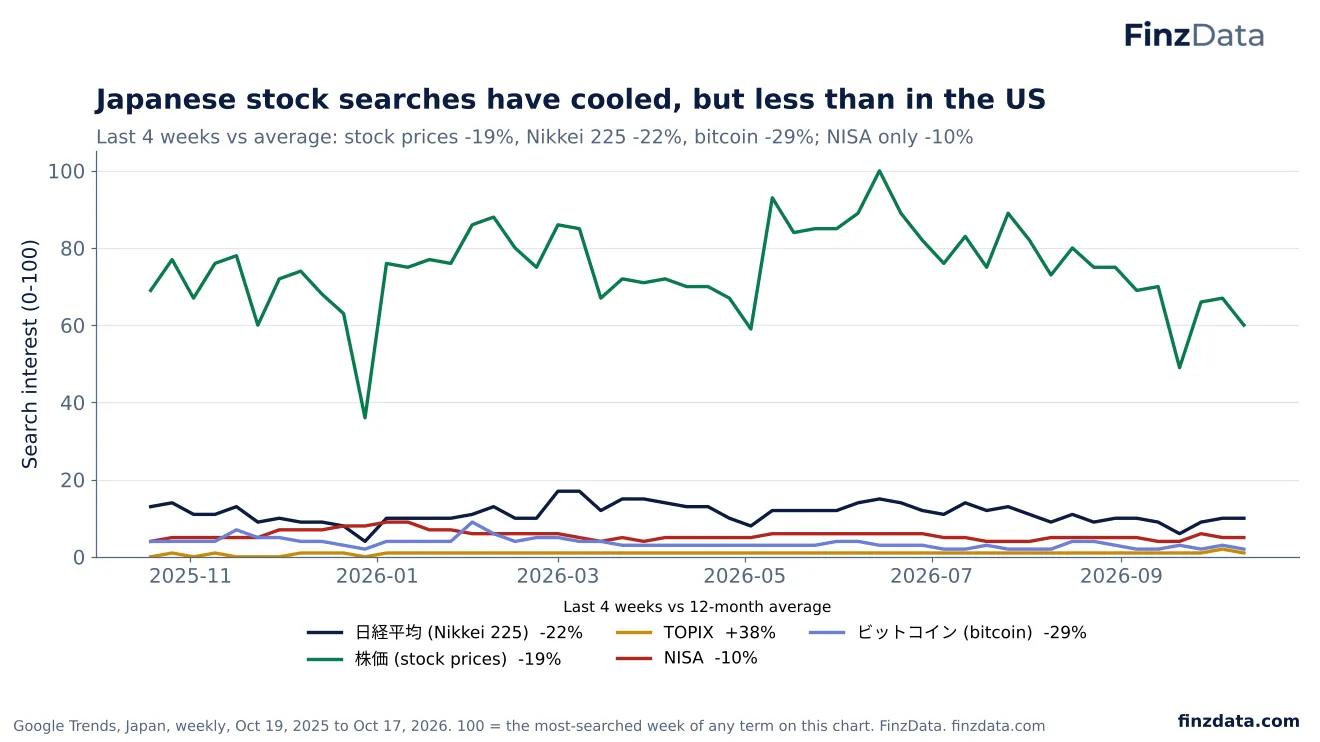
FinzData Research, October 2026.
Japanese investors mostly search for stock prices in general (株価), 78% of searches in this group, which peaked the week of June 14. Searches for the Nikkei 225 are 22% below their 12-month average and bitcoin 29% below, a gentler cooling than in the US. NISA, Japan's tax-free investment account, is down only 10%.
38. Interest rates are Japan's economic search, and rising
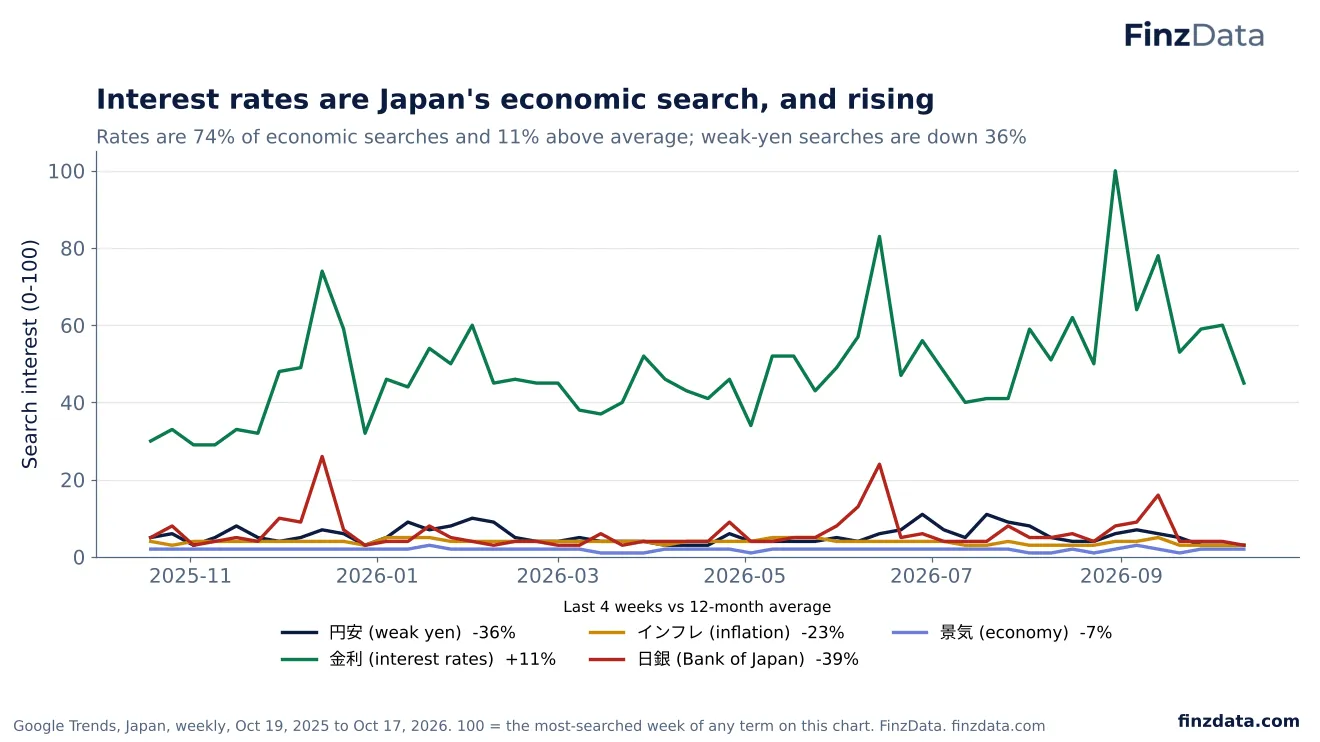
FinzData Research, October 2026.
Interest rates (金利) dominate Japanese economic searches: 74% of this group over the year, with a peak as recent as the week of August 30. They are the one big economic term searched more now than on average (+11%). Searches for the weak yen (円安, -36%) and the Bank of Japan (日銀, -39%) have fallen.
39. FX trading searches are climbing in Japan
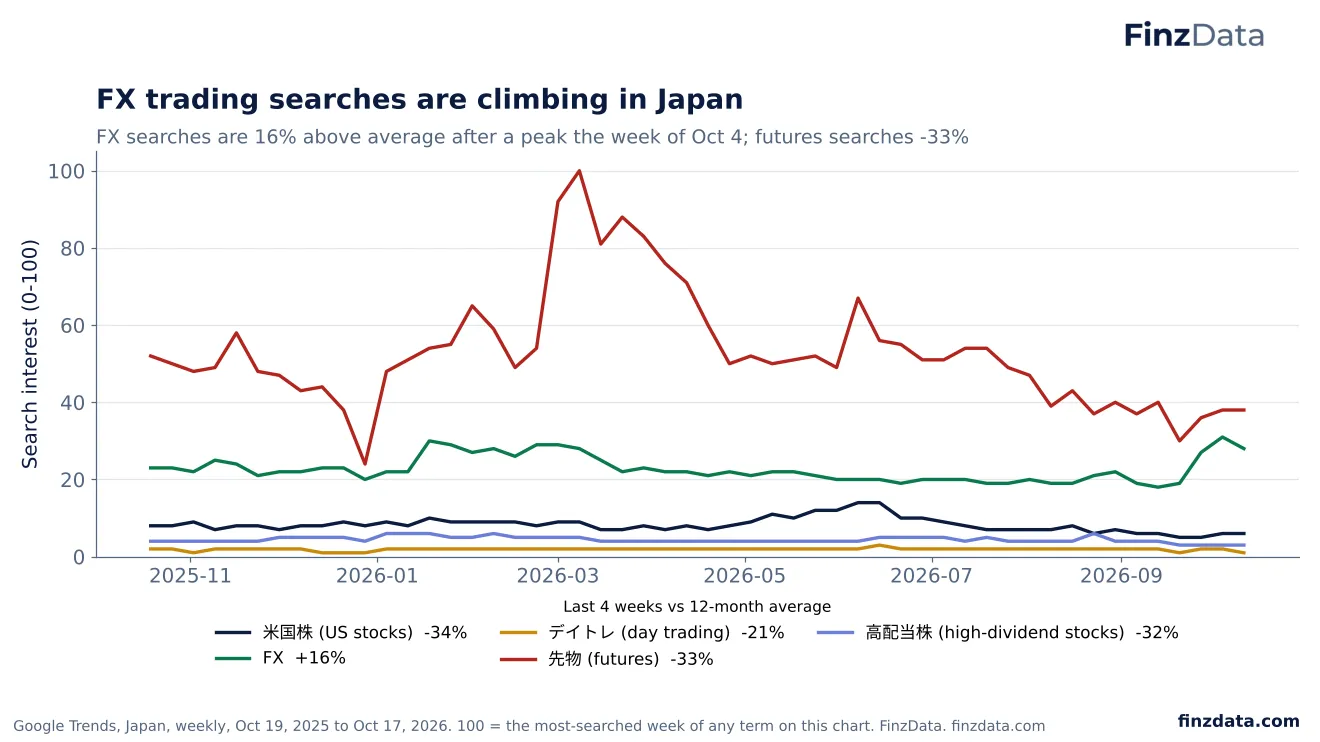
FinzData Research, October 2026.
Futures (先物) are Japan's most-searched trading term, 59% of the group, but they are 33% below average since a peak the week of March 8. FX searches are going the other way: 16% above their average, with the 12-month high in the week of October 4. Searches for US stocks (-34%) and high-dividend stocks (-32%) are down.
40. Japan's AI-investing interest is down, but holding up
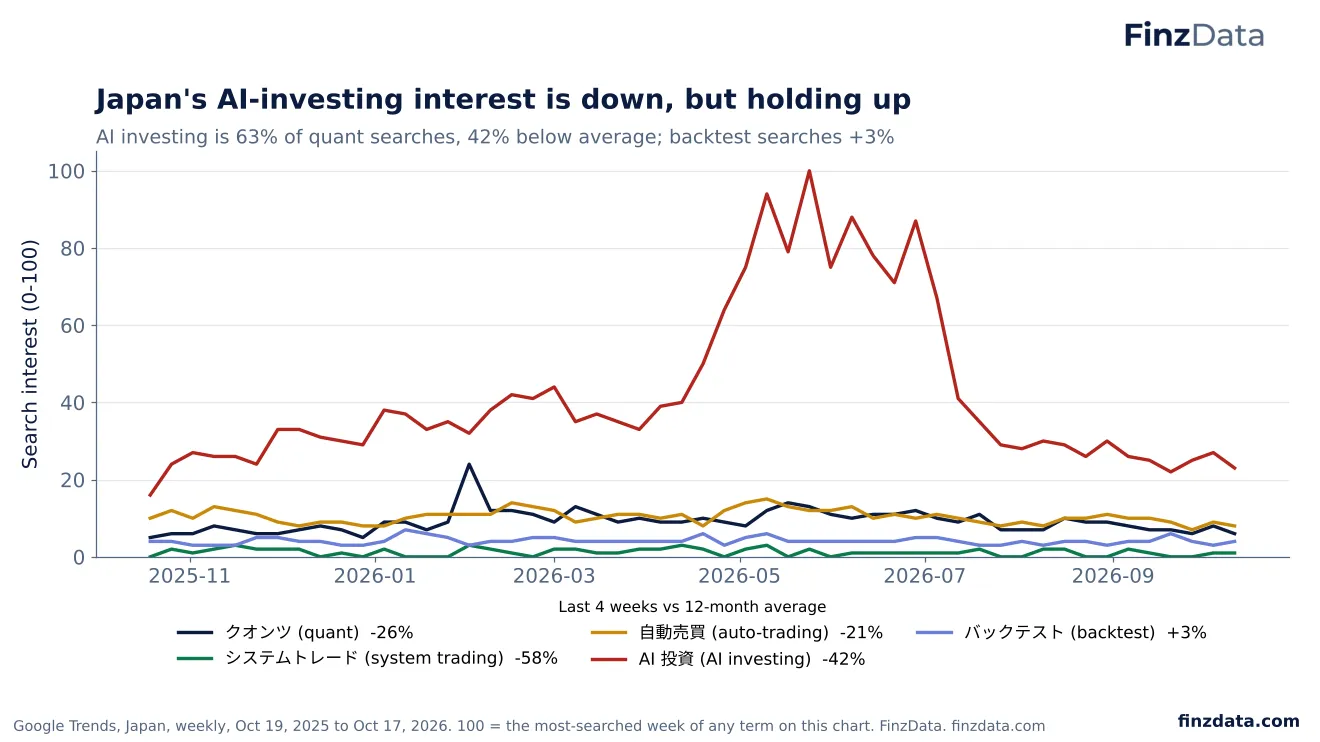
FinzData Research, October 2026.
AI investing (AI 投資) is 63% of Japanese quant searches and peaked the week of May 24. At 42% below its average it has held up far better than in the US or Korea. Searches for backtests (バックテスト) are slightly above average (+3%), while system trading has fallen 58%.
41. JP link
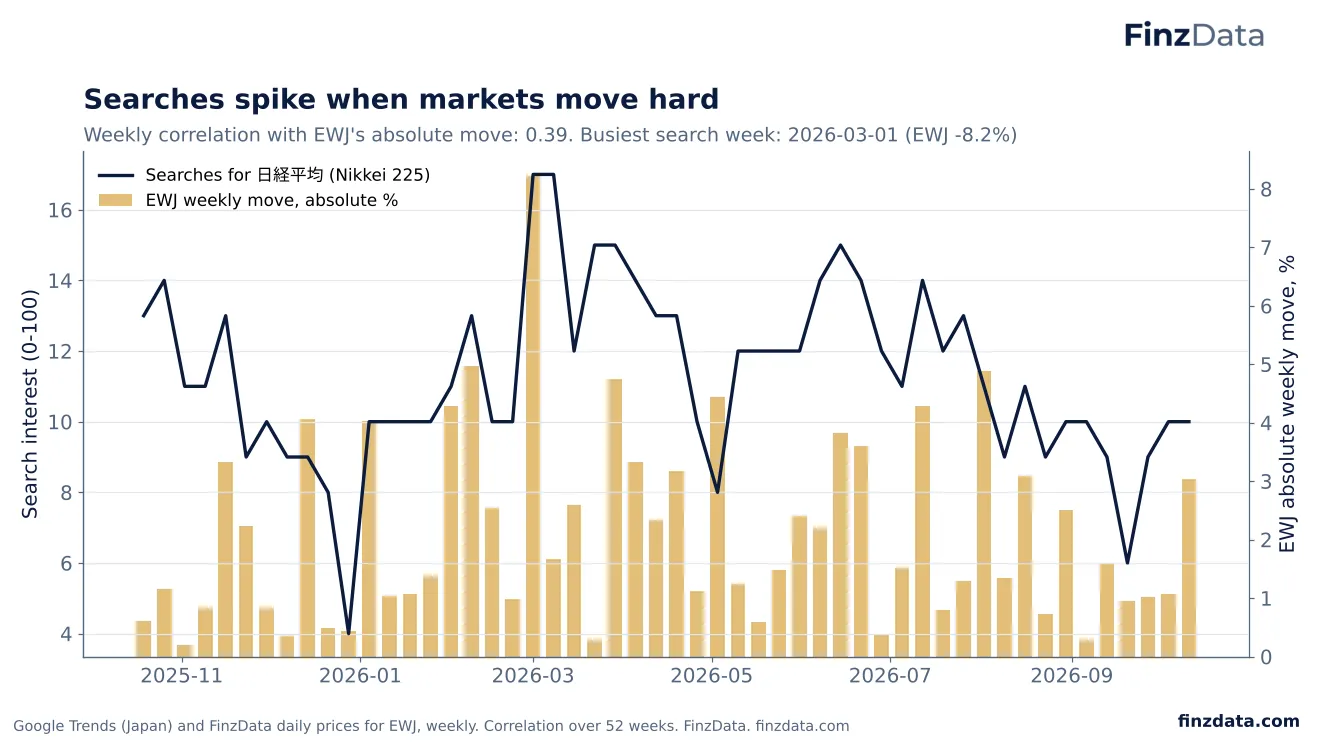
FinzData Research, October 2026.
Nikkei searches rise in weeks when Japanese stocks move hard: the weekly correlation with EWJ's absolute move was 0.39 over 52 weeks. The busiest week, starting March 1, came with an 8.2% fall in EWJ. Searches had almost no relationship with the price level (correlation -0.14).
42. JP rising
FinzData Research, October 2026.
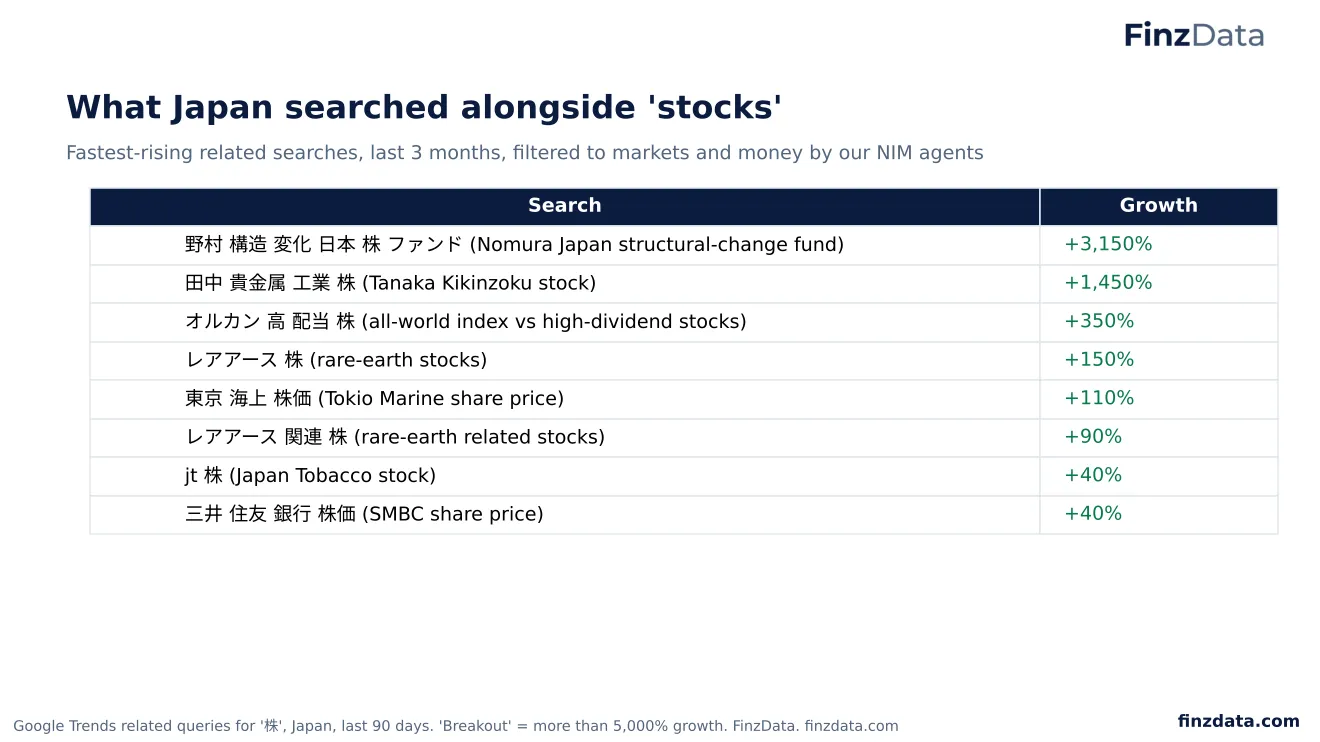
The fastest-rising stock searches in Japan over 90 days are specific: a Nomura fund focused on structural change in Japanese stocks (+3,150%), Tanaka Kikinzoku, a precious-metals group (+1,450%), and rare-earth stocks (+150%). Investors are also comparing all-world index funds (オルカン) with high-dividend stocks.
43. British investors search the FTSE less, and bitcoin far less
FinzData Research, October 2026.
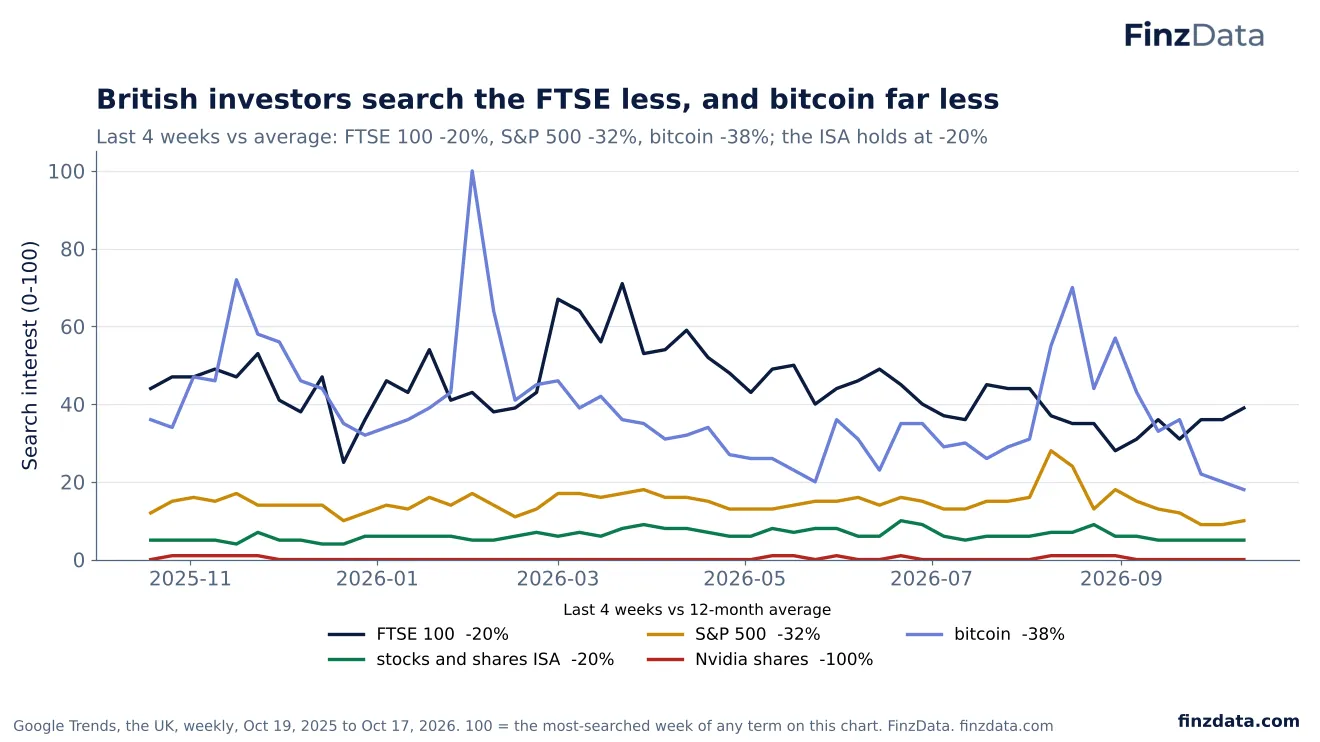
The FTSE 100 is Britain's most-searched market term, 42% of this group, peaking the week of March 22. In the last four weeks it was 20% below its 12-month average, the S&P 500 32% below and bitcoin 38% below. Searches for the stocks and shares ISA, the UK's tax-free investment account, are down 20%.
44. The Budget is Britain's biggest economic search
FinzData Research, October 2026.
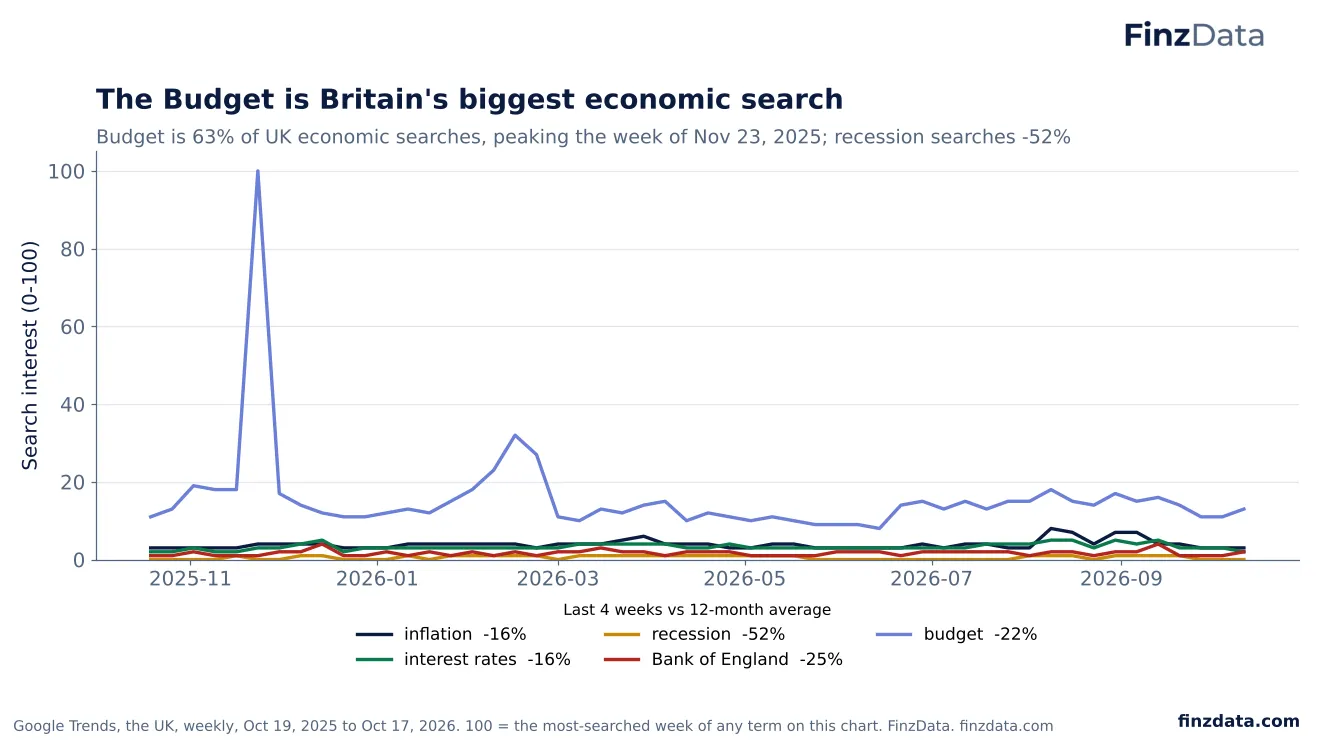
The Budget dominates British economic searches: 63% of this group over the year, with a peak in the week of November 23, 2025, around the Autumn Budget. Inflation and interest-rate searches are both 16% below average, and recession searches have more than halved (-52%).
45. Gold dominates UK trading searches too
FinzData Research, October 2026.
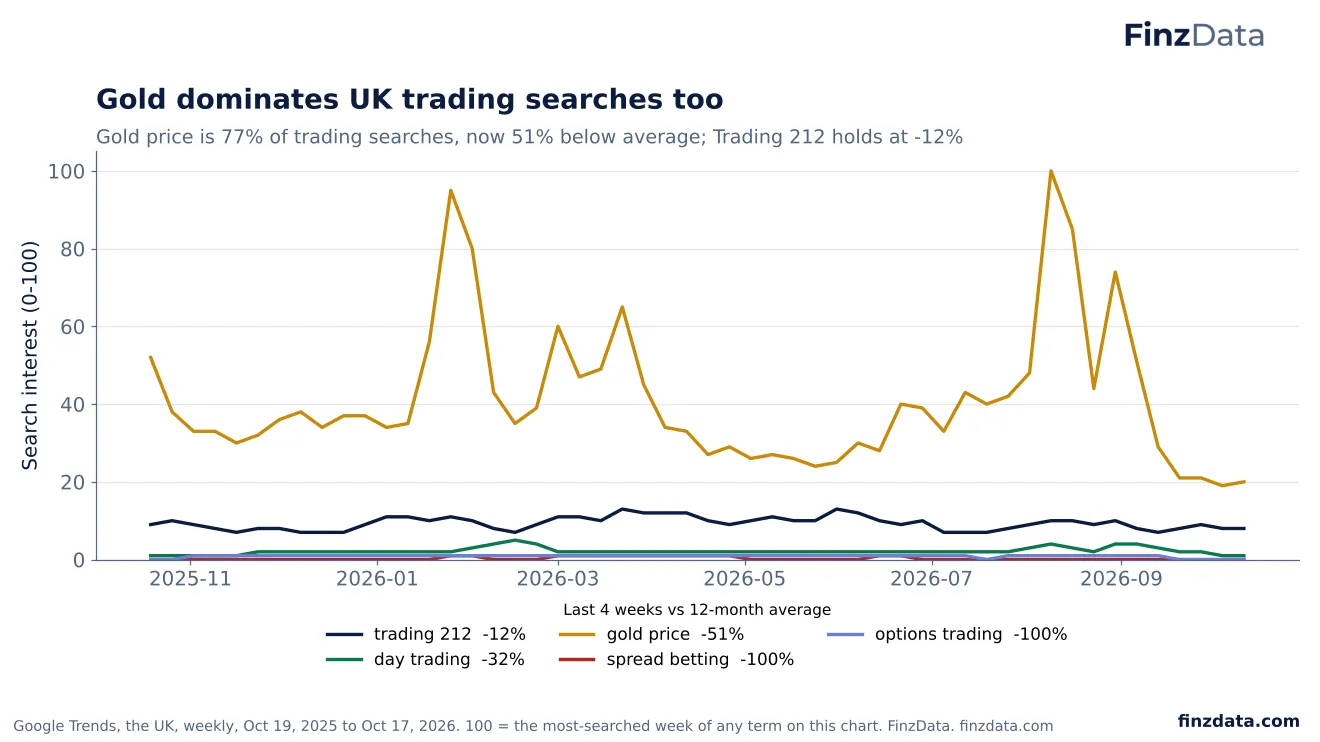
As in the US, gold leads UK trading searches: 77% of the group, peaking the week of August 9, and now 51% below average. The trading app Trading 212 has held up best (-12%), while day-trading searches are down 32%.
46. UK AI-trading interest has held up better than in the US
FinzData Research, October 2026.
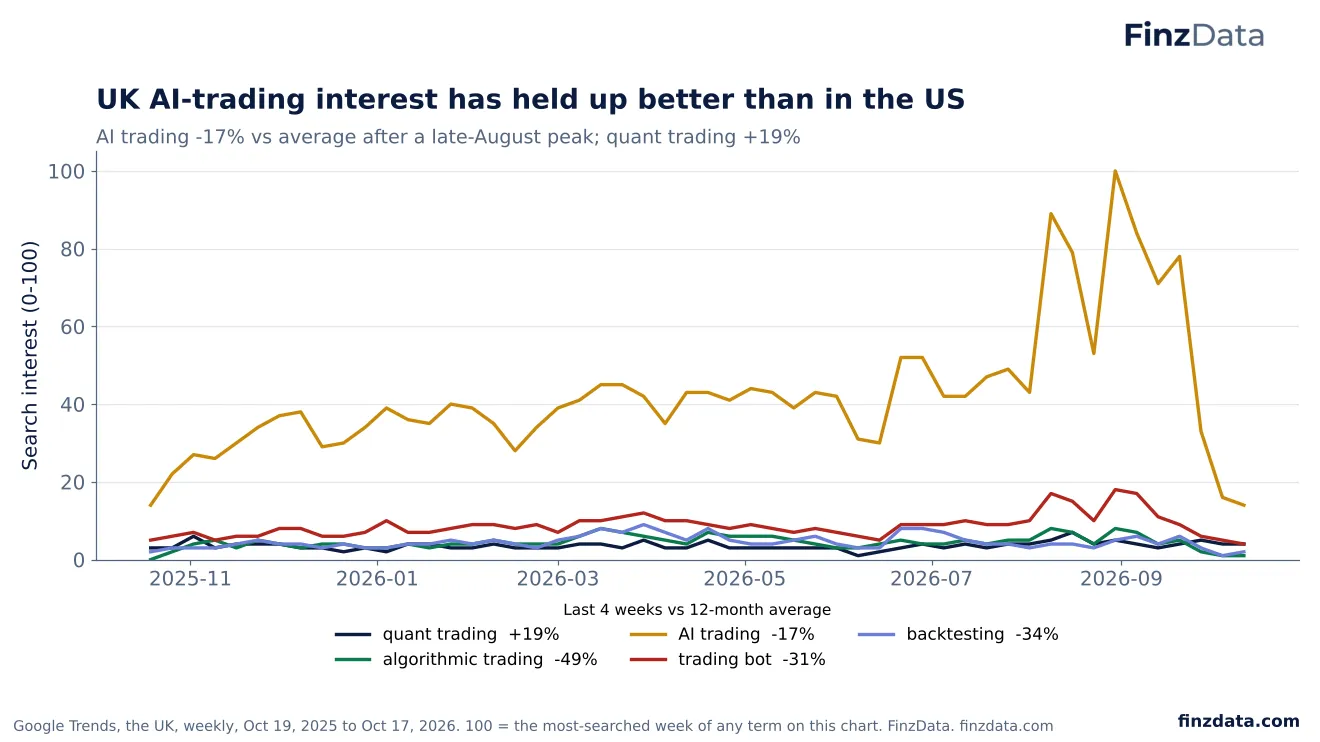
AI trading is 67% of UK quant searches and peaked as late as the week of August 30; it is only 17% below its average, compared with 67% in the US. Searches for quant trading are 19% above average, the only rise in this group.
47. GB link
FinzData Research, October 2026.
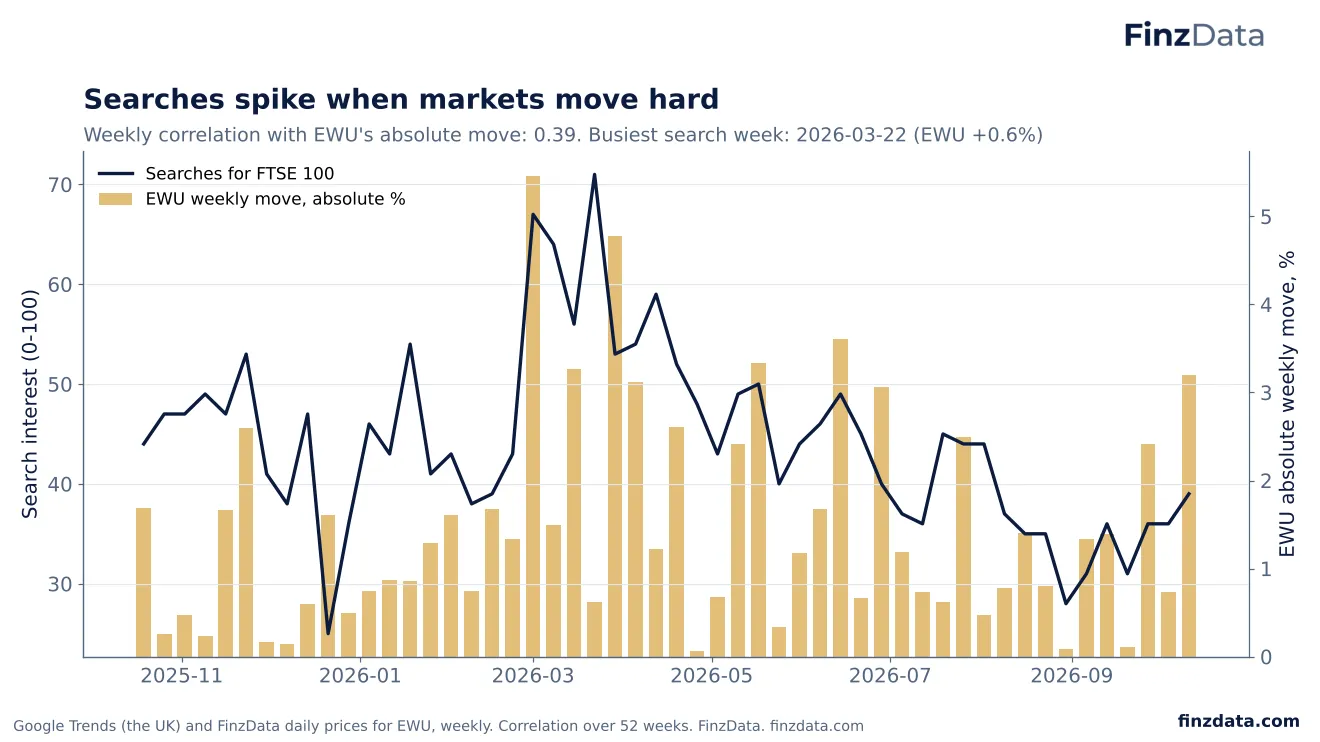
FTSE 100 searches rise in weeks when UK stocks move more: the weekly correlation with EWU's absolute move was 0.39. Searches were slightly lower when prices were higher (correlation -0.28).
48. GB rising
FinzData Research, October 2026.
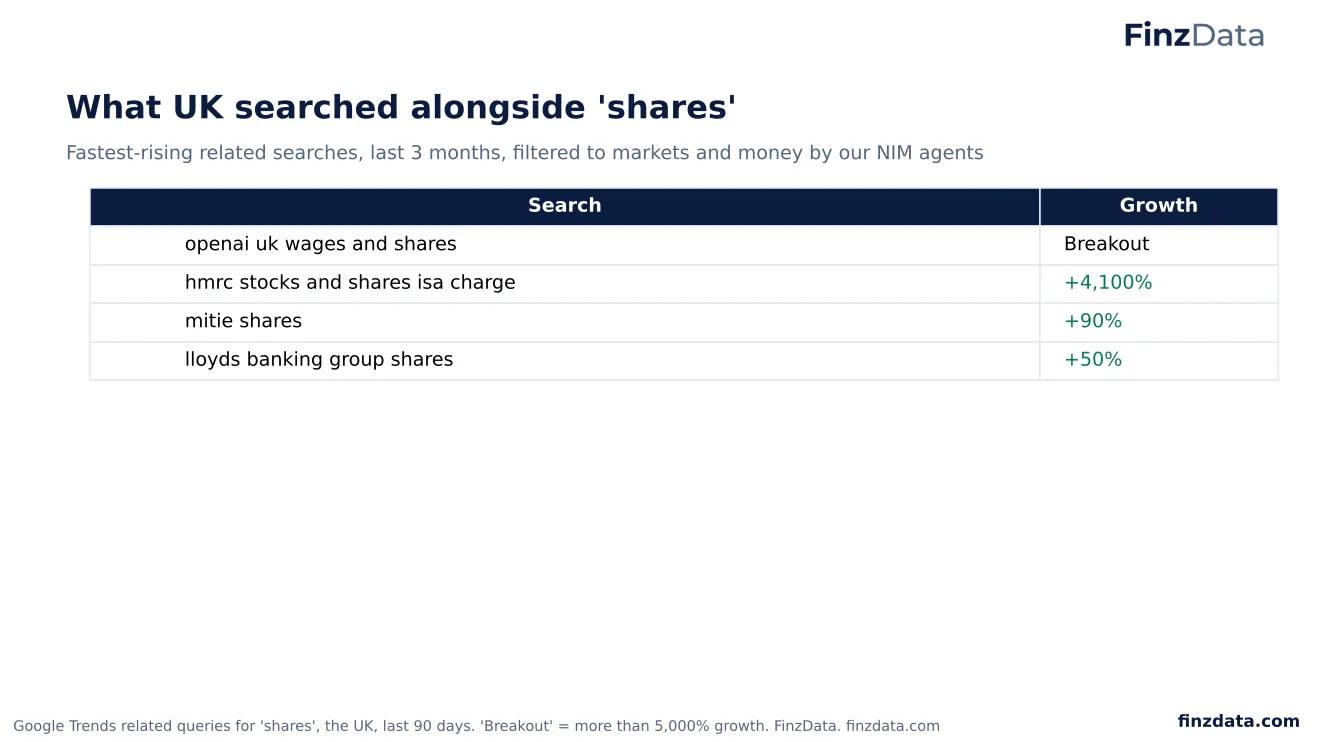
The fastest-rising UK searches around shares are about tax and pay: an HMRC charge on stocks and shares ISAs (+4,100%) and a breakout story on OpenAI UK wages and shares. Mitie and Lloyds Banking Group shares are also rising.
49. German stock searches are down a fifth
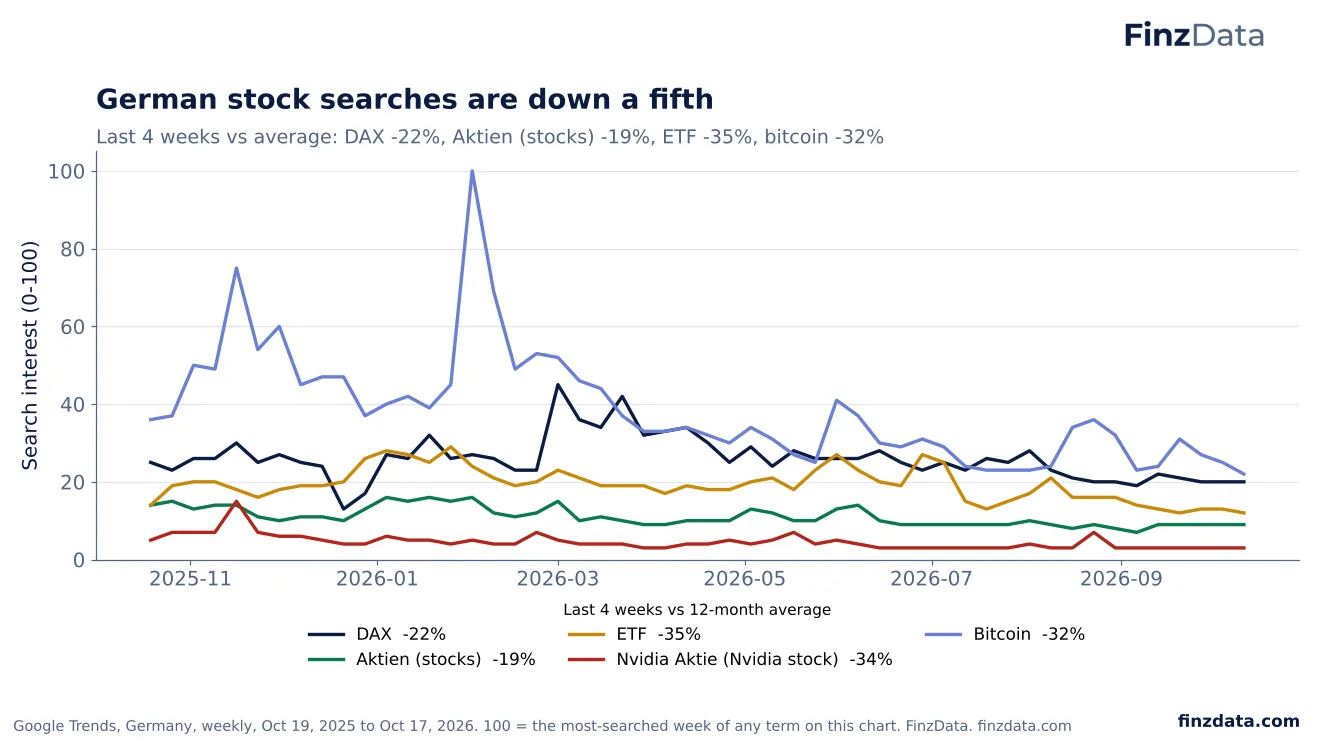
FinzData Research, October 2026.
Bitcoin (39%) and the DAX (26%) lead German market searches. In the last four weeks the DAX was 22% below its 12-month average, stocks (Aktien) 19% below and ETFs 35% below. Bitcoin is down 32% from an early-February peak, the same week it peaked in the US, Korea and the UK.
50. Germans are googling interest rates and jobs more
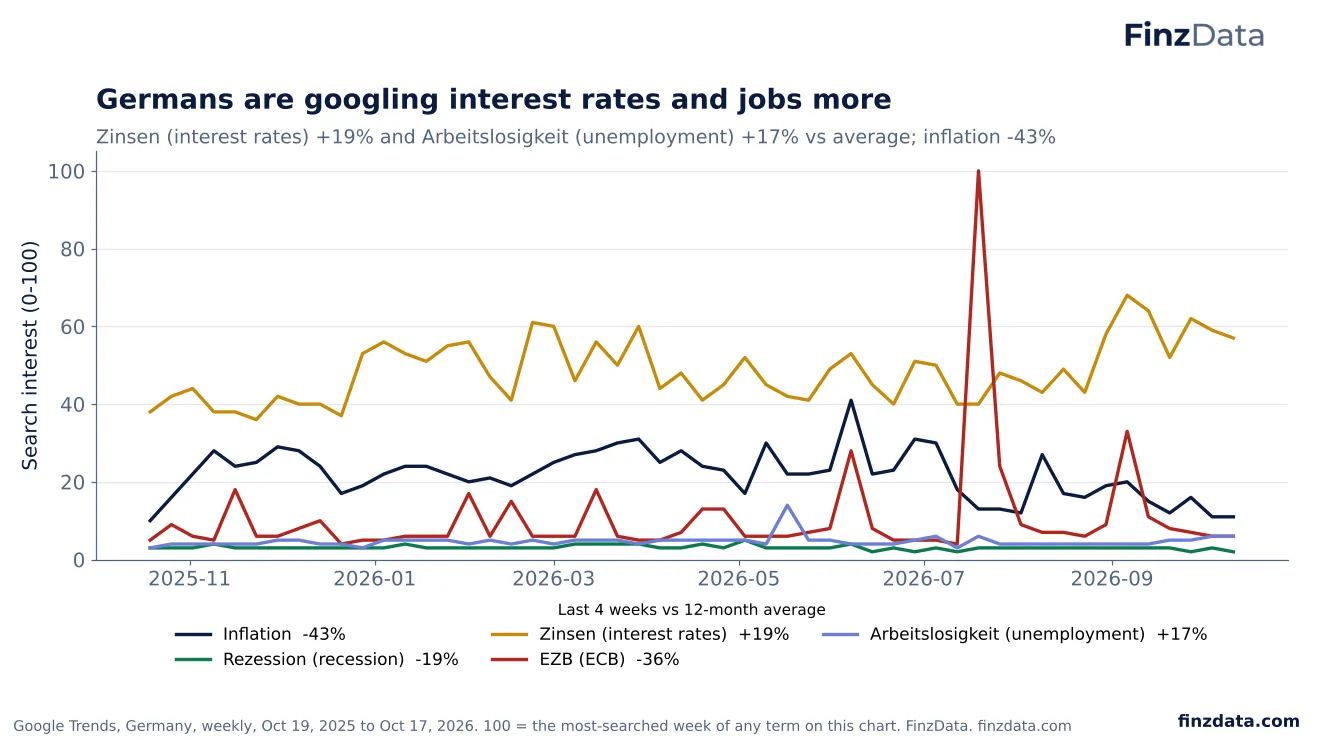
FinzData Research, October 2026.
Interest rates (Zinsen) are Germany's main economic search, 55% of the group, and are 19% above their 12-month average after a peak the week of September 6. Unemployment searches are up 17%. Inflation searches have fallen 43% and the ECB 36%.
51. Trade Republic searches are steady while gold fades
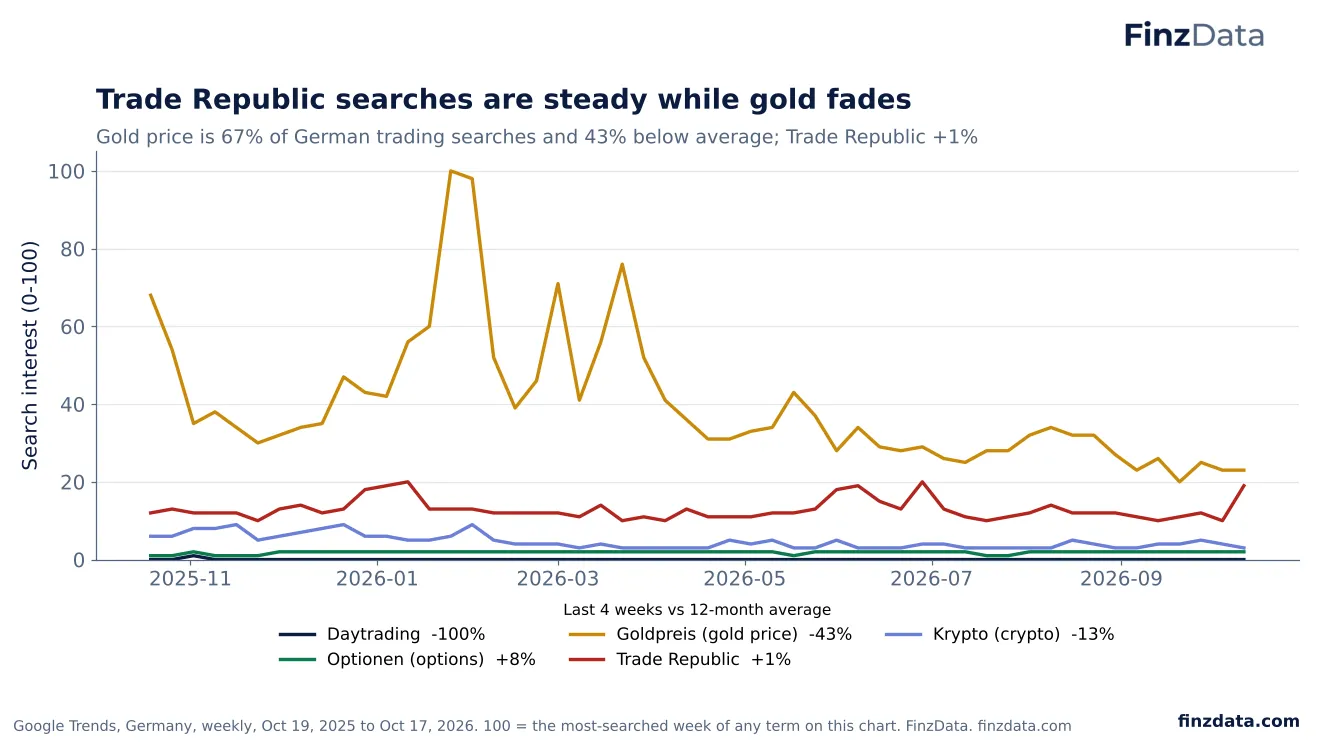
FinzData Research, October 2026.
Gold price is 67% of German trading searches, peaking the week of January 25, and is now 43% below average. Searches for the broker Trade Republic are steady (+1%), and options searches are up 8%. Day trading barely registers in German.
52. 'Quant' spiked in Germany and France in the same week
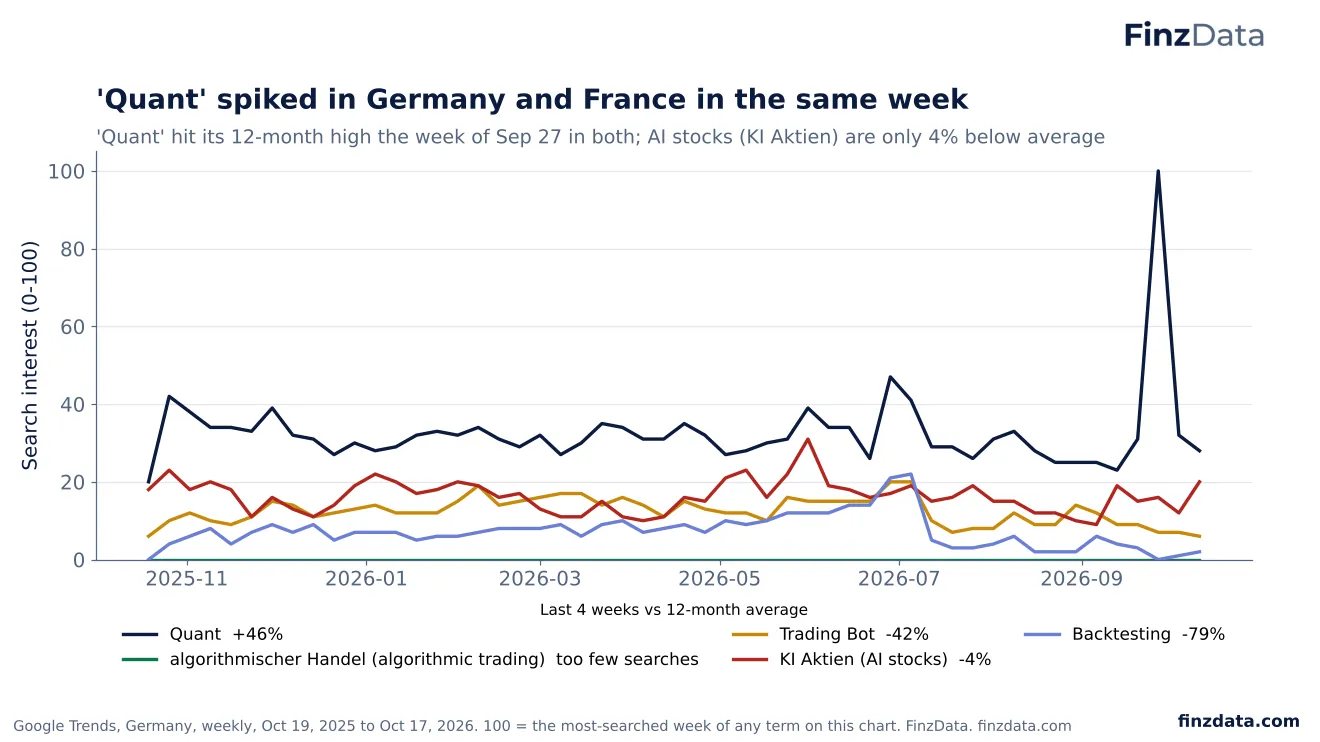
FinzData Research, October 2026.
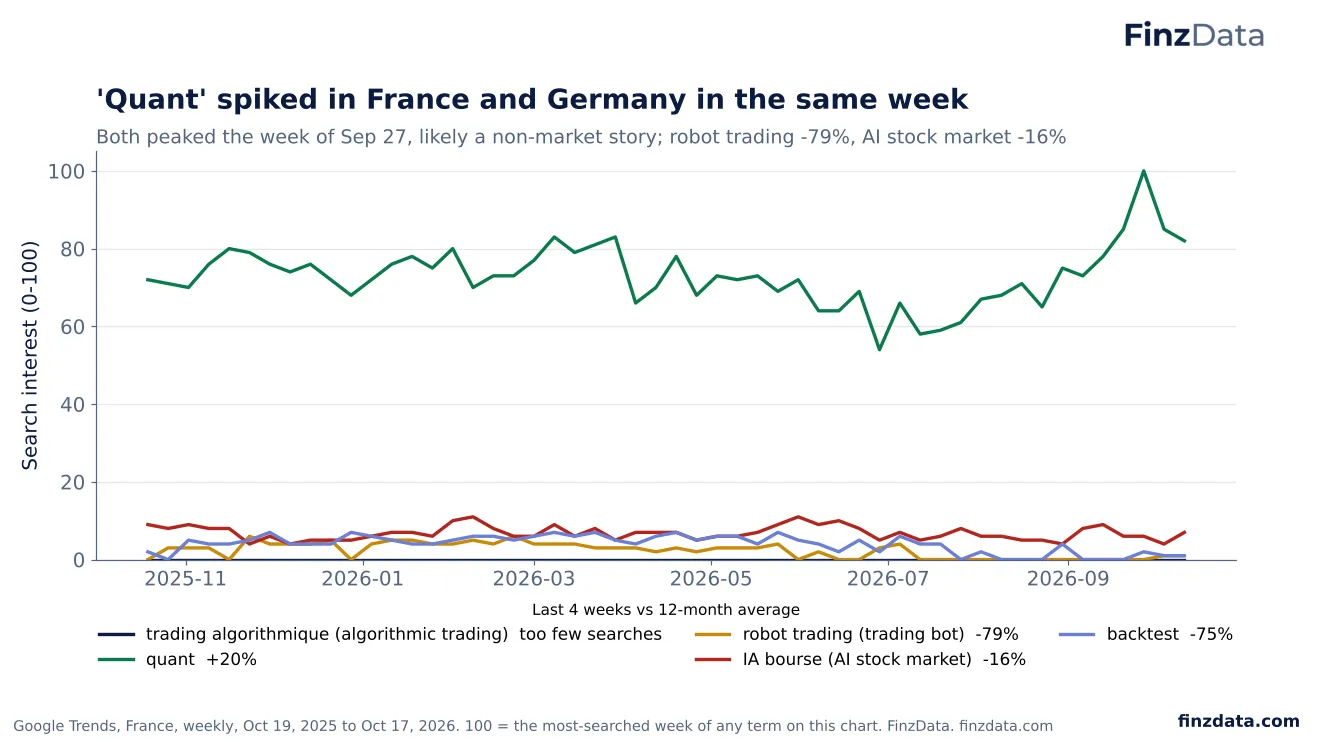
Searches for 'Quant' jumped to their 12-month high in the single week of September 27, which lifts the four-week average to 46% above normal. French searches for 'quant' peaked the same week, which points to a story outside markets, so we treat the jump with caution. AI stocks (KI Aktien) are only 4% below average, while backtesting is down 79%.
53. DE link
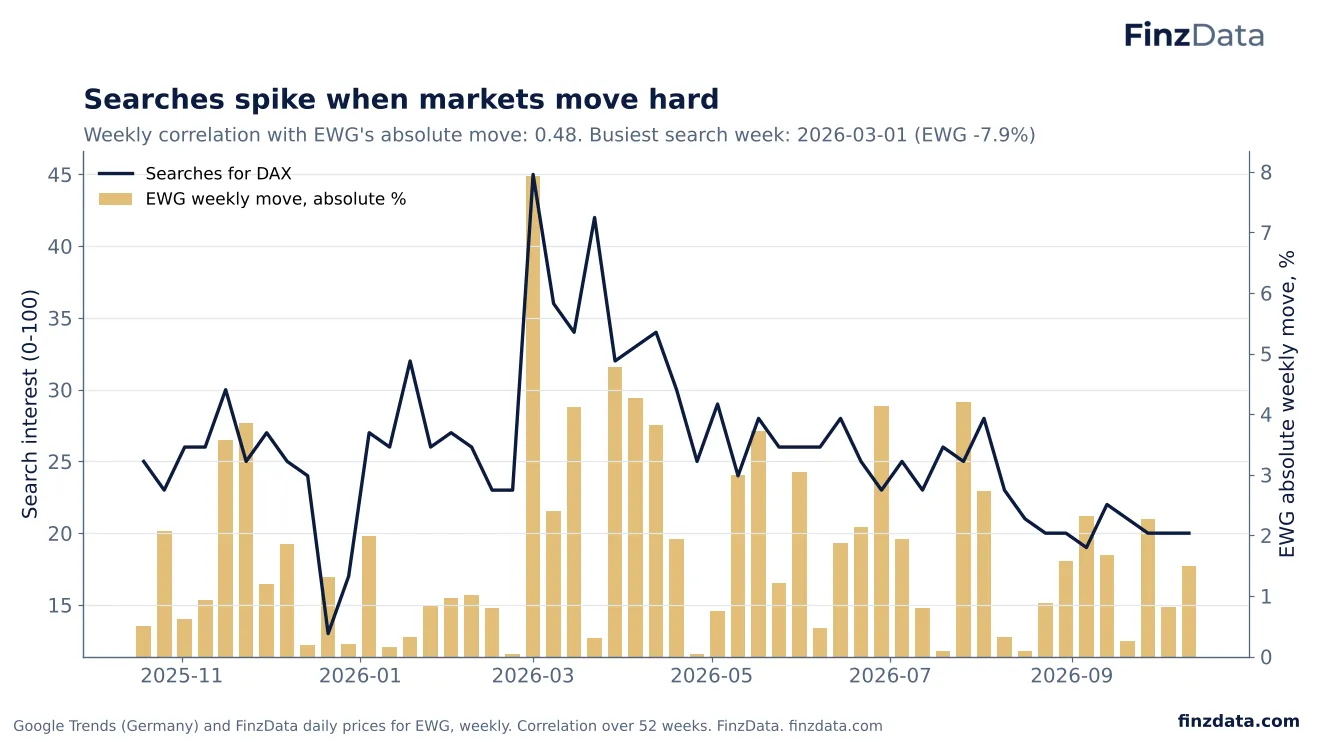
FinzData Research, October 2026.
German DAX searches follow the size of market moves closely: the weekly correlation with EWG's absolute move was 0.48, second only to France. The busiest week, starting March 1, came with a 7.9% fall in EWG.
54. DE rising
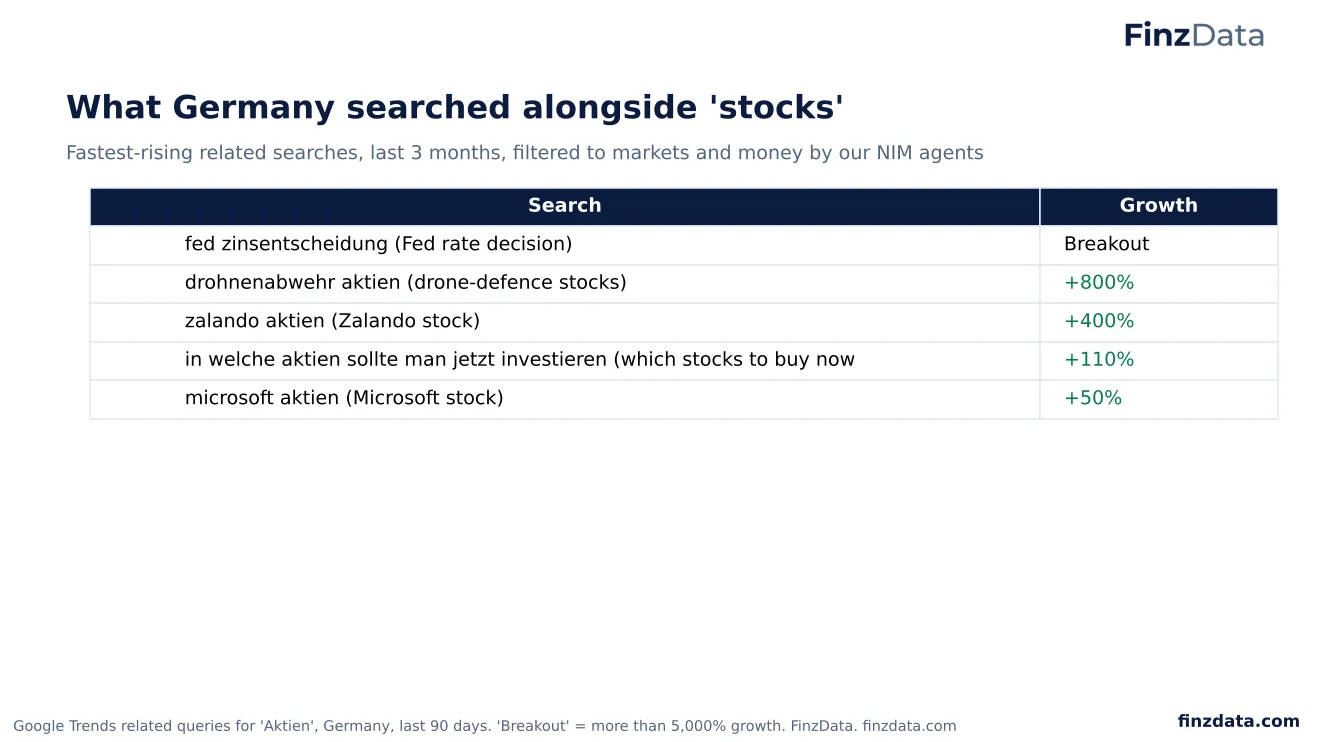
FinzData Research, October 2026.
The fastest-rising German stock searches include the Fed's rate decision (breakout), drone-defence stocks (+800%) and Zalando (+400%). Searches asking which stocks to buy now are up 110%.
55. French market searches have held up best in Europe
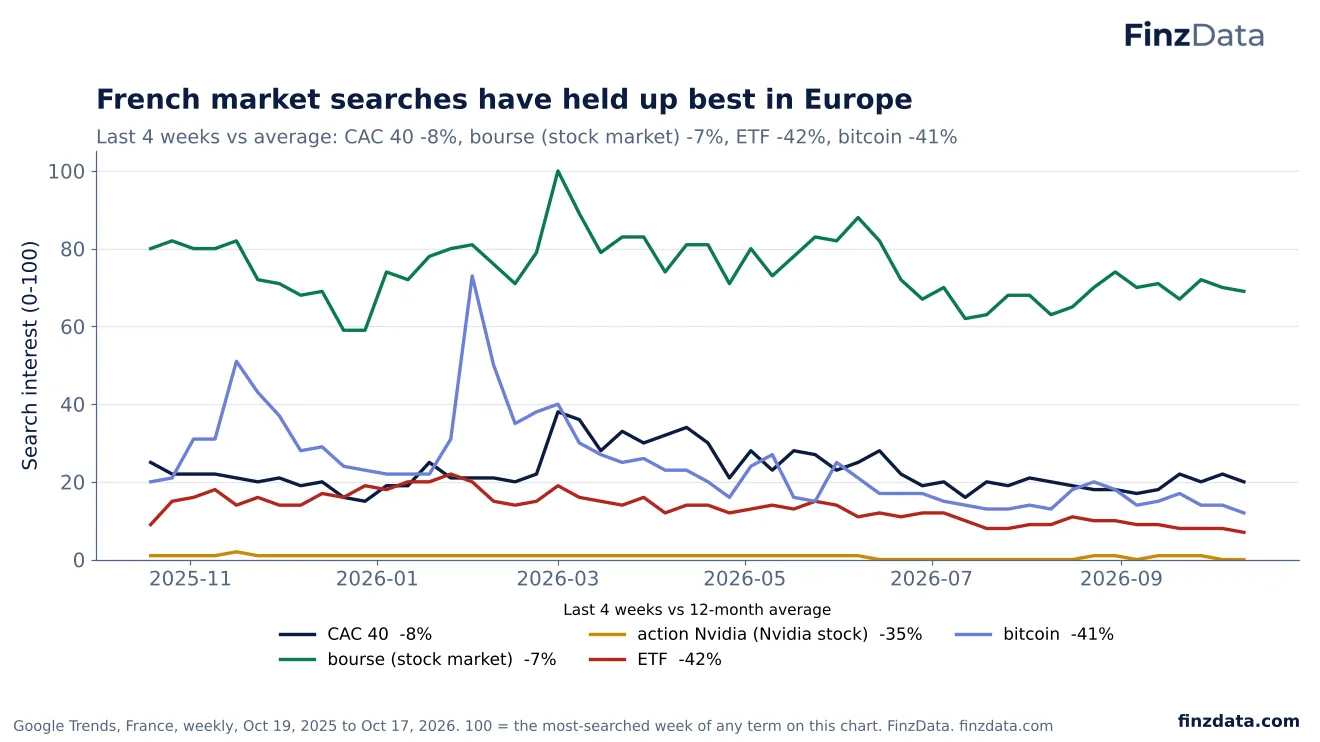
FinzData Research, October 2026.
'Bourse' (the stock market) is France's main market search, 55% of the group. It and the CAC 40 are only 7% and 8% below their 12-month averages, the smallest declines of any index search we tracked; both peaked the week of March 1. ETF (-42%) and bitcoin (-41%) searches have fallen much further.
56. France worries about jobs more than inflation now
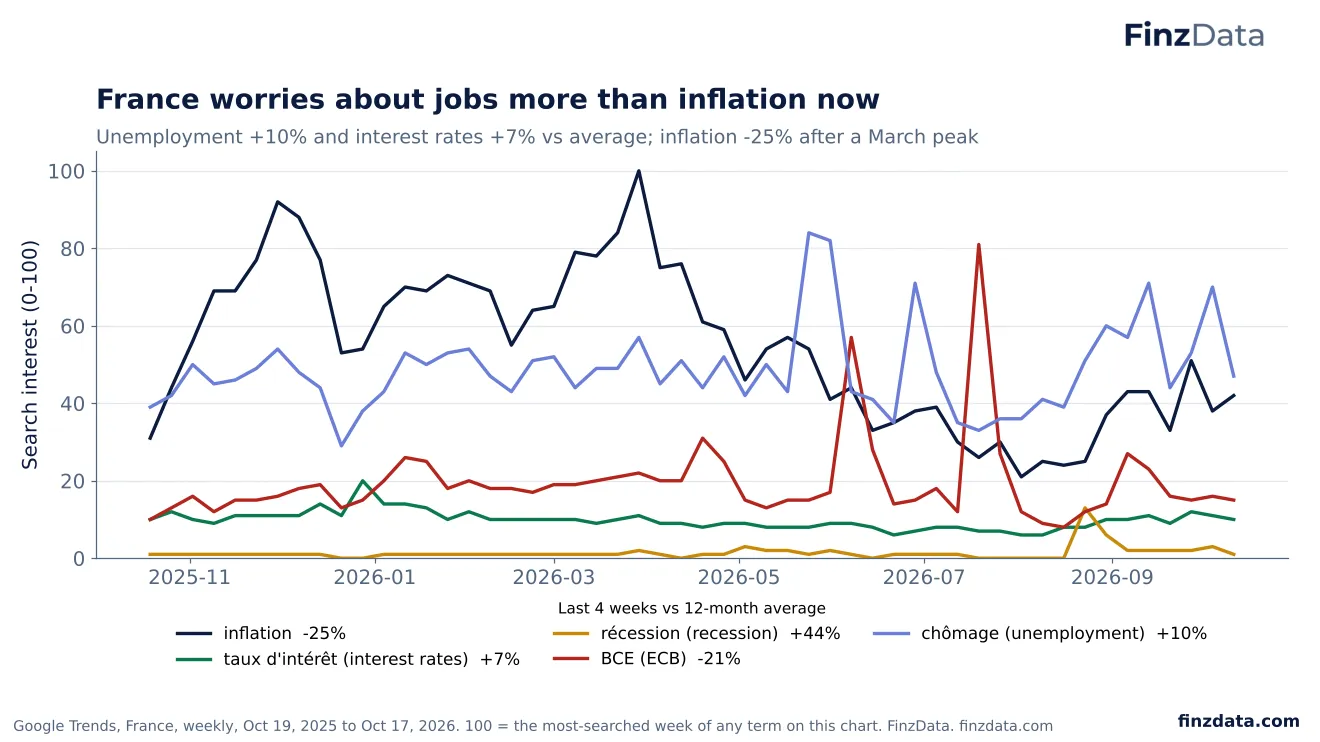
FinzData Research, October 2026.
Inflation is still France's top economic search (41% of the group) but is 25% below its average after a peak the week of March 29. Unemployment (chômage, 36%) is 10% above average and interest rates 7% above. Recession searches are 44% above average, but from a very small base: they are 1% of the group.
57. French trading searches peaked in late September
FinzData Research, October 2026.
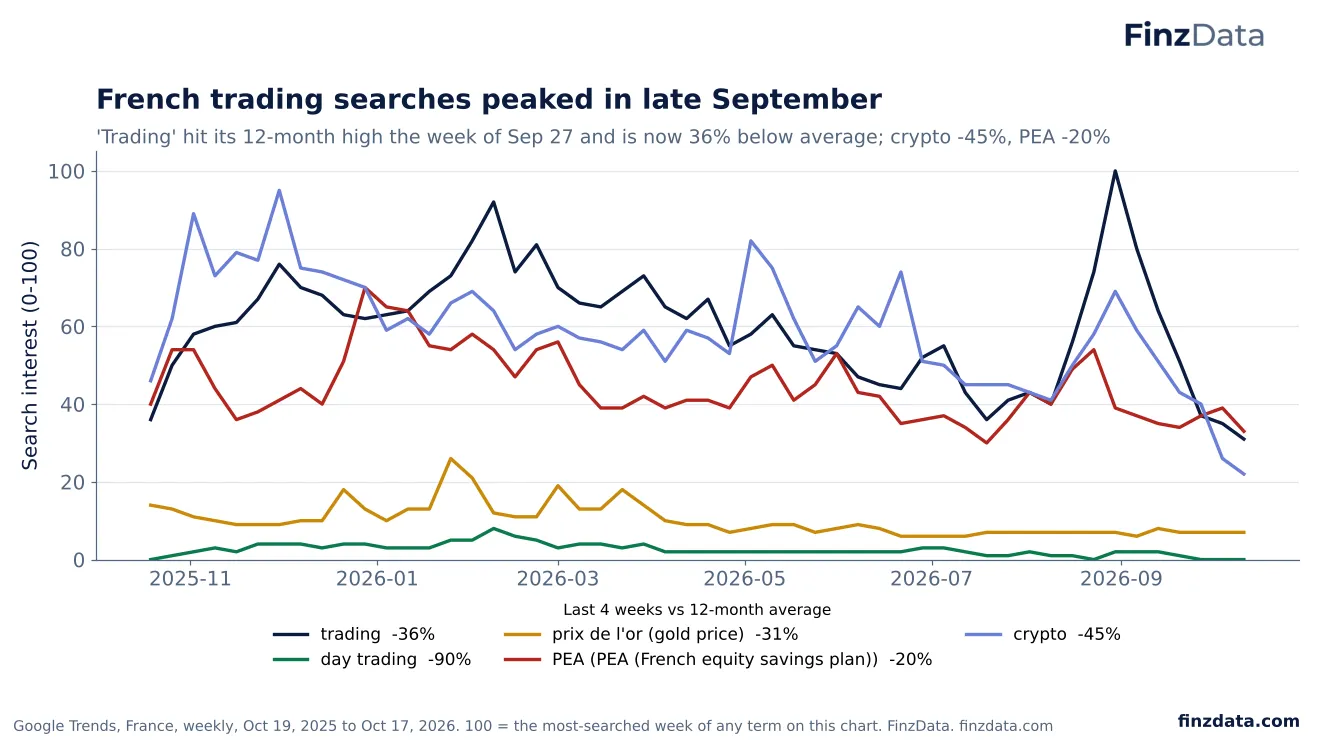
In France, 'trading' (34% of the group) and crypto (33%) lead trading searches, followed by the PEA, France's tax-advantaged share account (25%). Trading searches hit their 12-month high the week of September 27 and have since fallen to 36% below average; crypto is 45% below and the PEA 20% below. Gold is a much smaller search in France than in the US, UK or Germany.
58. 'Quant' spiked in France and Germany in the same week
FinzData Research, October 2026.
'Quant' is also a common French word (it means 'as for'), so its level says little about investing; its spike in the week of September 27 matched Germany's. Searches for AI and the stock market (IA bourse) are 16% below average, robot trading 79% below and backtests 75% below. Algorithmic trading barely registers in French.
59. FR link
FinzData Research, October 2026.
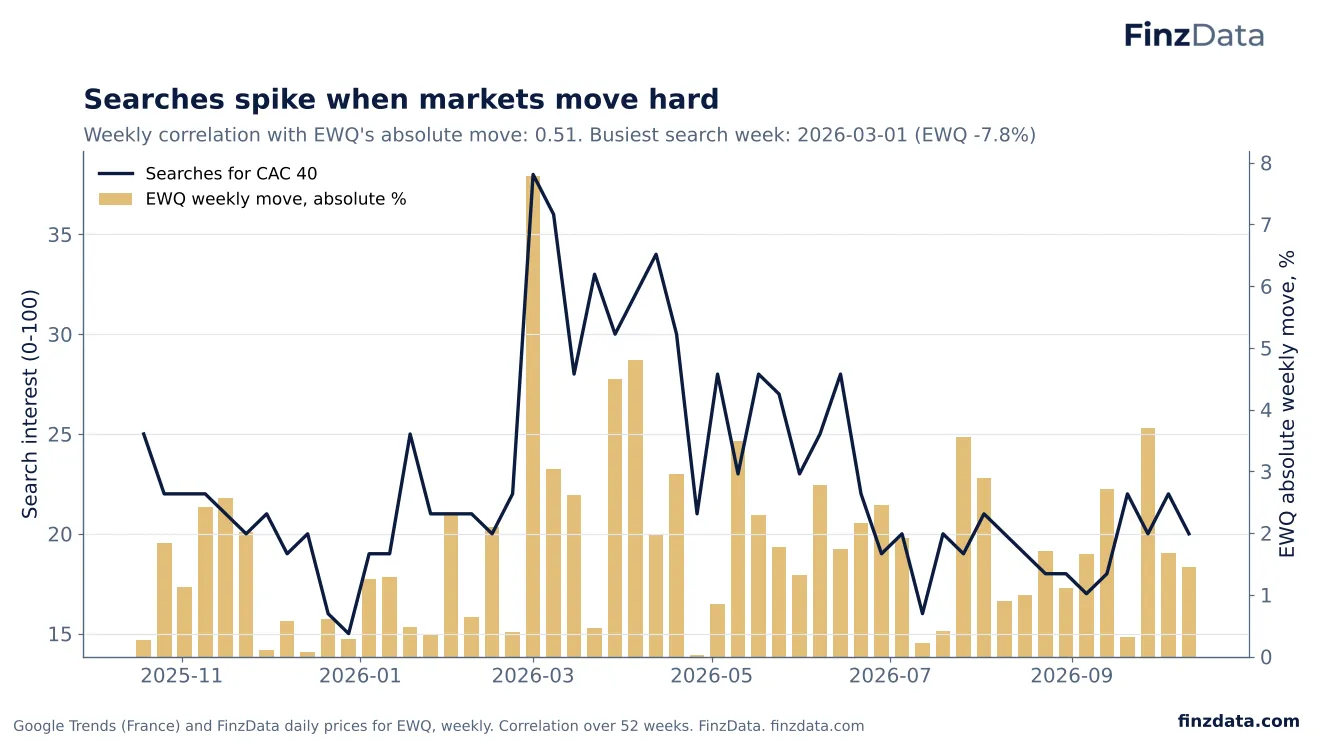
French CAC 40 searches follow the size of market moves more closely than any other index we studied: the weekly correlation with EWQ's absolute move was 0.51. The busiest week, starting March 1, came with a 7.8% fall in EWQ.
60. FR rising
FinzData Research, October 2026.
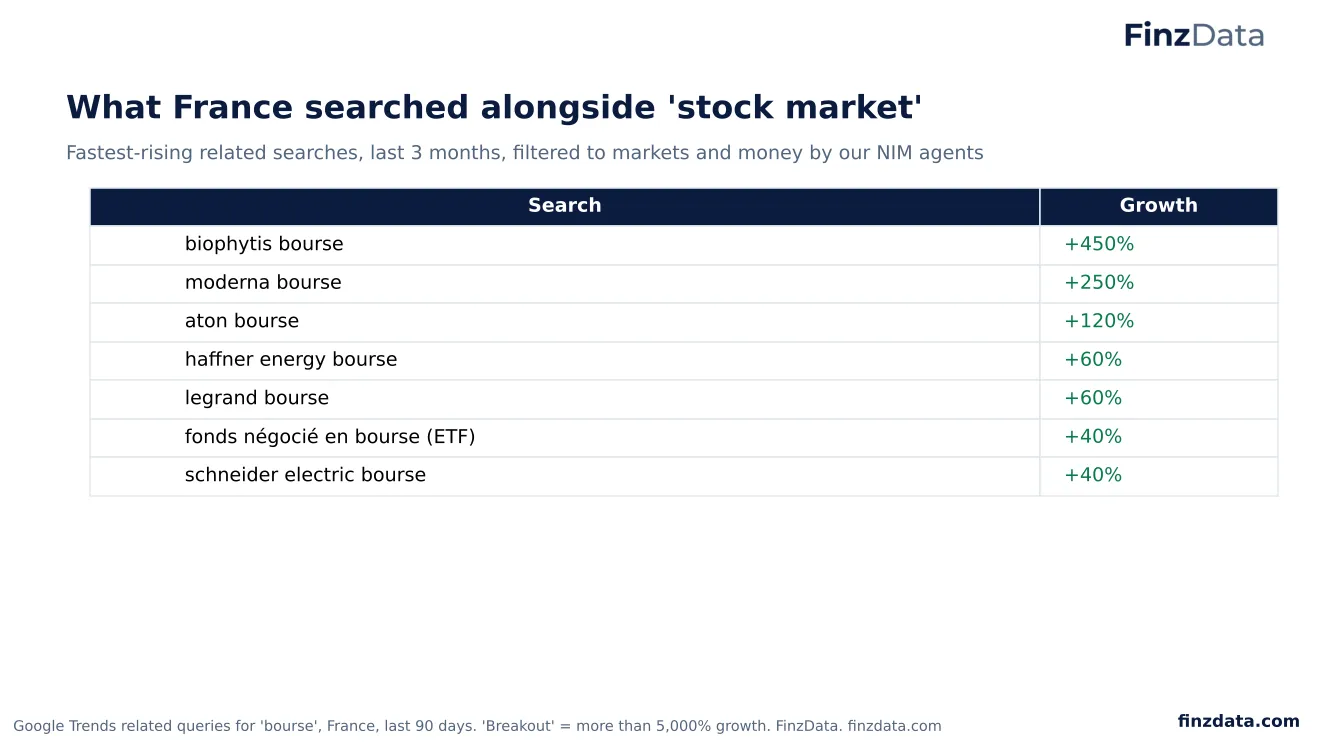
The fastest-rising French searches around 'bourse' are single stocks: the biotech Biophytis (+450%), Moderna (+250%), Aton, Haffner Energy, Legrand and Schneider Electric. Searches for exchange-traded funds are up 40%. The most common related searches are brokers: Bourse Direct and Boursorama.
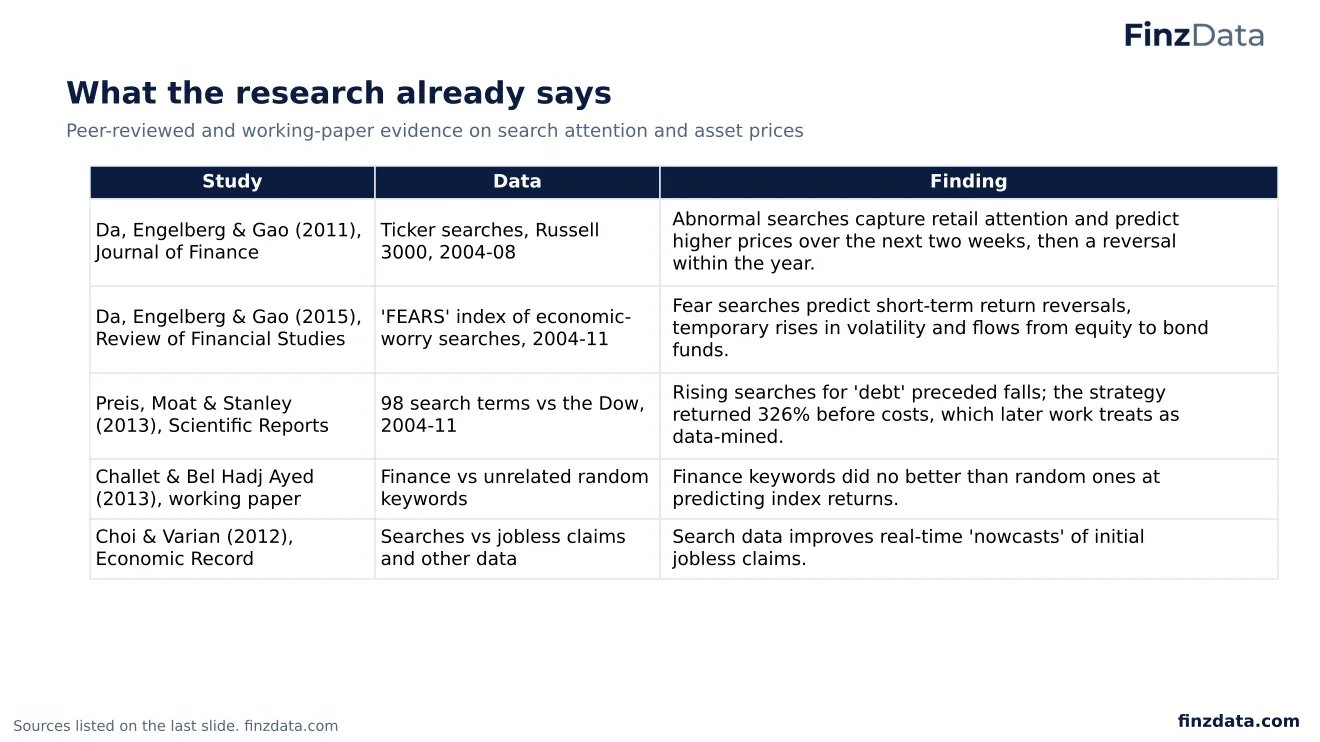
61. What the research already says
FinzData Research, October 2026.
| Study | Data | Finding |
|---|---|---|
| Da, Engelberg & Gao (2011), Journal of Finance | Ticker searches, Russell 3000, 2004-08 | Abnormal searches capture retail attention and predict higher prices over the next two weeks, then a reversal within the year. |
| Da, Engelberg & Gao (2015), Review of Financial Studies | 'FEARS' index of economic-worry searches, 2004-11 | Fear searches predict short-term return reversals, temporary rises in volatility and flows from equity to bond funds. |
| Preis, Moat & Stanley (2013), Scientific Reports | 98 search terms vs the Dow, 2004-11 | Rising searches for 'debt' preceded falls; the strategy returned 326% before costs, which later work treats as data-mined. |
| Challet & Bel Hadj Ayed (2013), working paper | Finance vs unrelated random keywords | Finance keywords did no better than random ones at predicting index returns. |
| Choi & Varian (2012), Economic Record | Searches vs jobless claims and other data | Search data improves real-time 'nowcasts' of initial jobless claims. |
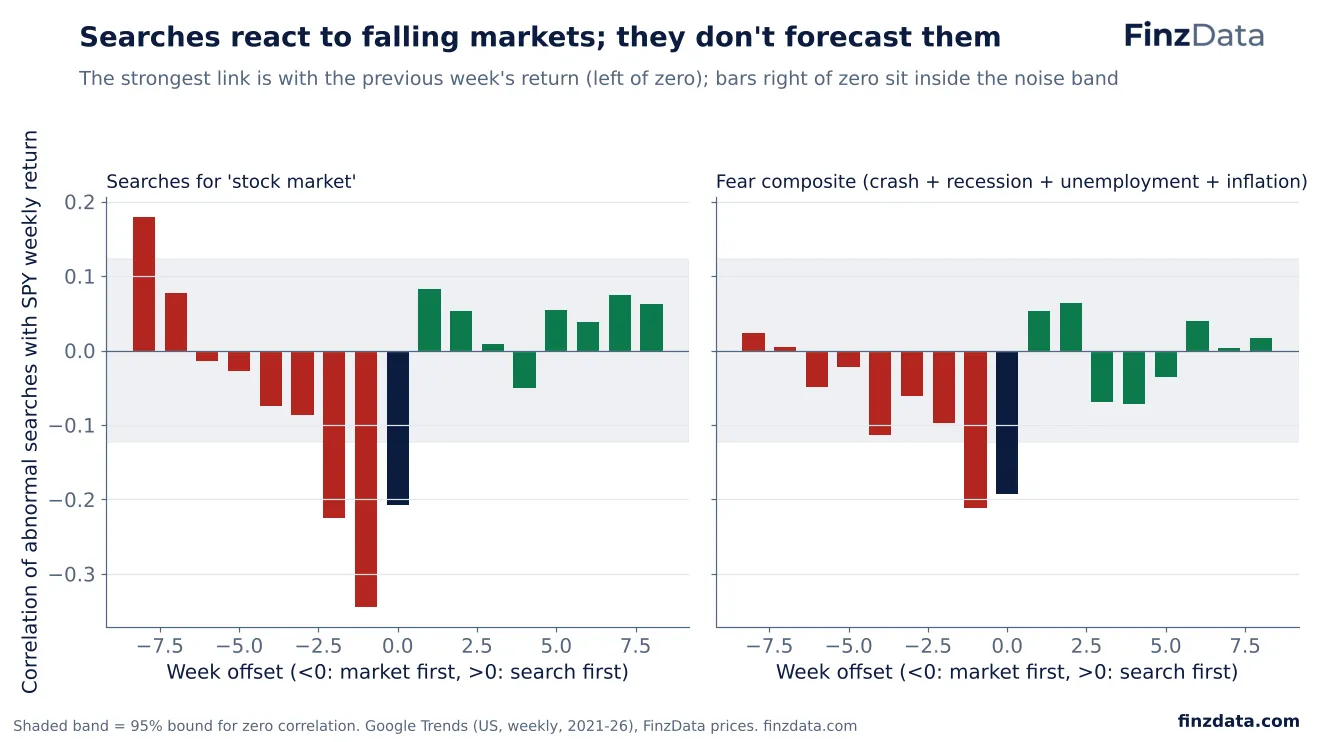
62. Searches react to falling markets; they don't forecast them
FinzData Research, October 2026.
We correlated abnormal searches with SPY's weekly return at offsets from eight weeks before to eight weeks after. The strongest correlations are with the previous week's return (-0.35 for 'stock market', -0.25 for 'stock market crash'): searches rise after falls. Bars where searches come first mostly sit inside the 95% noise band.
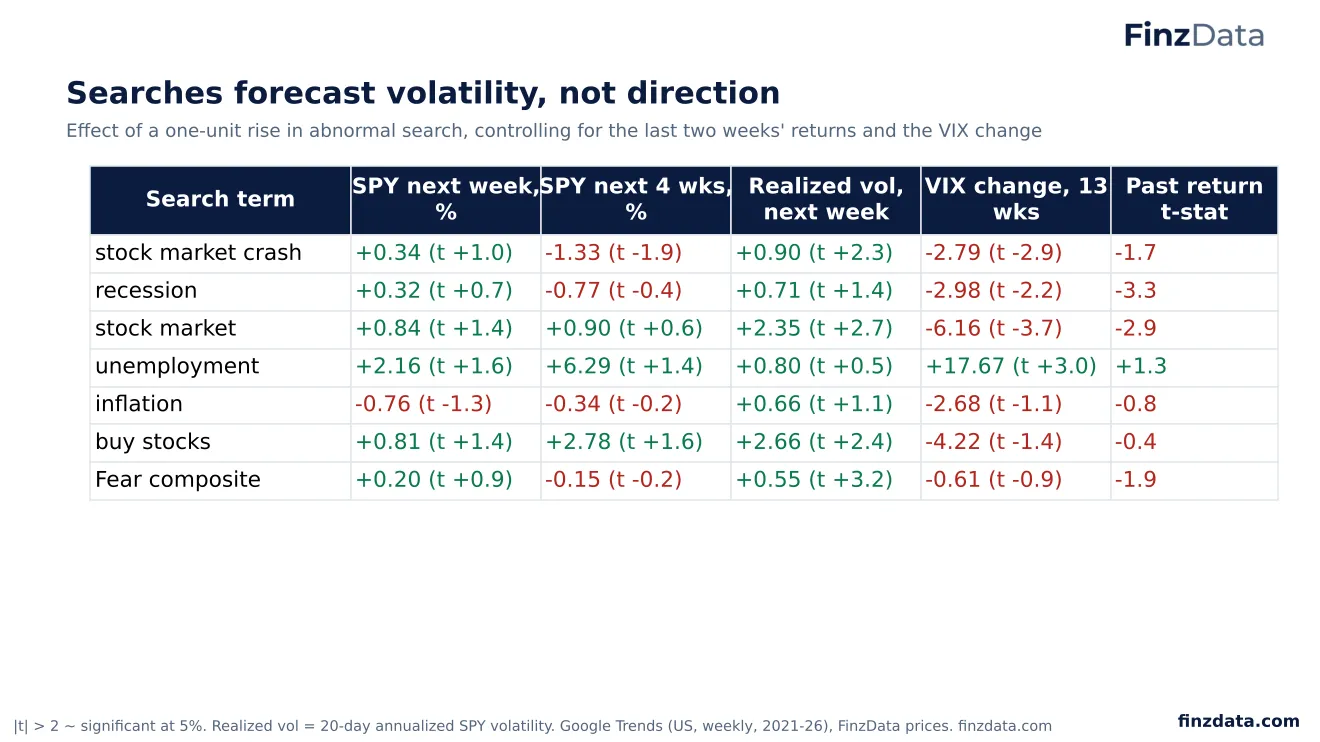
63. Searches forecast volatility, not direction
FinzData Research, October 2026.
Controlling for the last two weeks' returns and the VIX change, no search term predicts SPY's return over the next week or month. Several predict higher realized volatility next week (t +2.3 to +3.4), and spikes in market-fear searches are followed by a lower VIX 13 weeks later. Searches for 'unemployment' are the exception: they were followed by a higher VIX 13 weeks later (t +3.0).
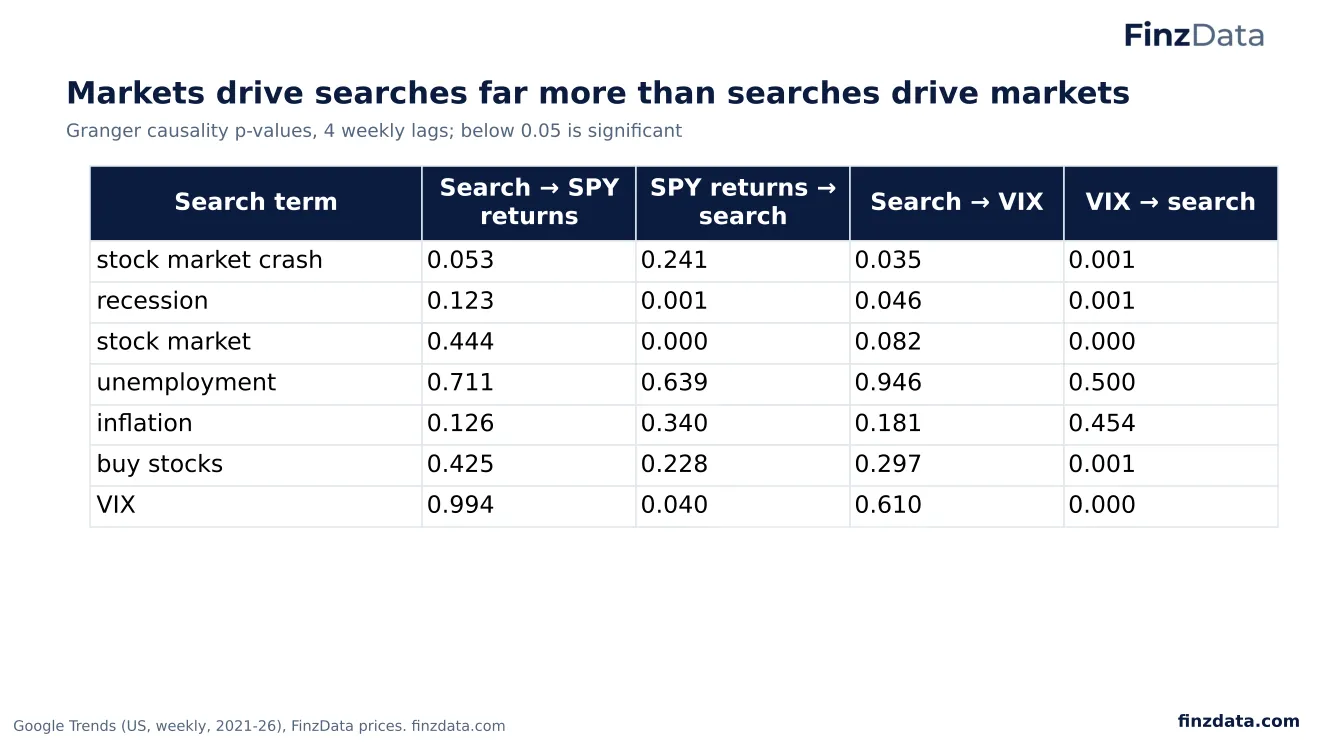
64. Markets drive searches far more than searches drive markets
FinzData Research, October 2026.
Granger tests ask whether one series helps predict another. Returns help predict searches for 'stock market' (p 0.0001) and 'recession' (p 0.0007), and the VIX helps predict most search terms. Searches do not help predict returns at the 5% level for any term.
65. Fear searches spike with the VIX
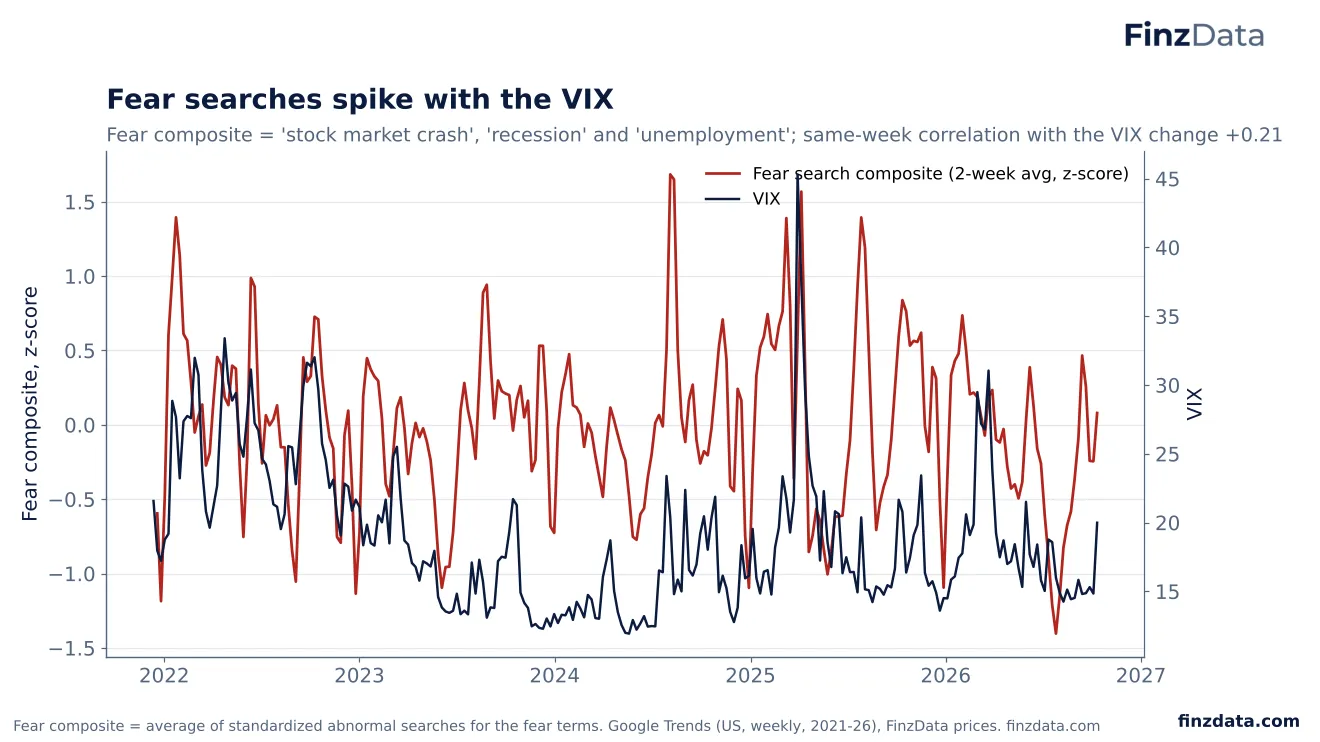
FinzData Research, October 2026.
Our fear composite averages standardized abnormal searches for 'stock market crash', 'recession' and 'unemployment'. It spikes with the VIX: same-week correlation +0.21 with the VIX change and -0.19 with SPY's return. The biggest spikes came in the 2022 bear market, August 2024 and April 2025.
66. After fear spikes: more volatility, no reliable direction
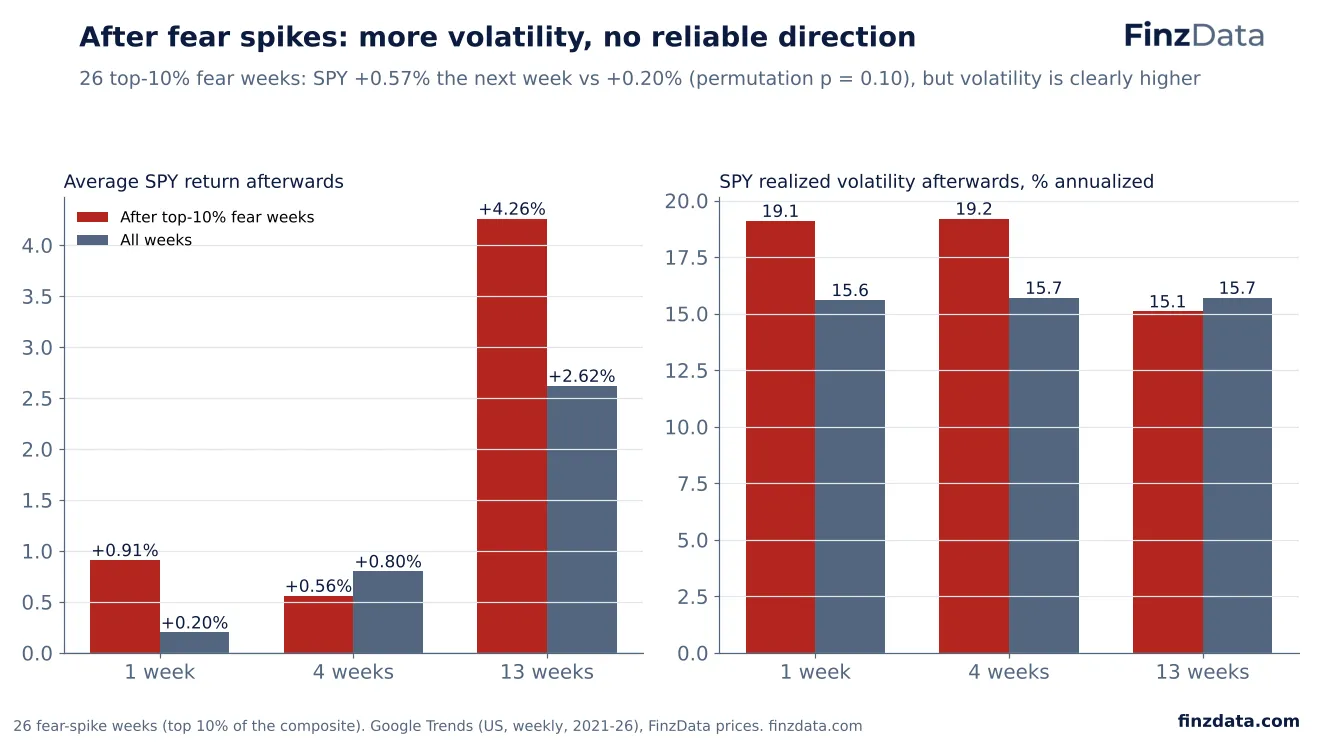
FinzData Research, October 2026.
In the 26 weeks with the highest fear searches, SPY rose 0.57% on average the next week versus 0.20% normally, but a permutation test puts that gap within chance (p = 0.10). Volatility is the reliable effect: next-week realized volatility averaged 19.3% versus 15.6%.
67. Bitcoin attention follows big moves, in either direction
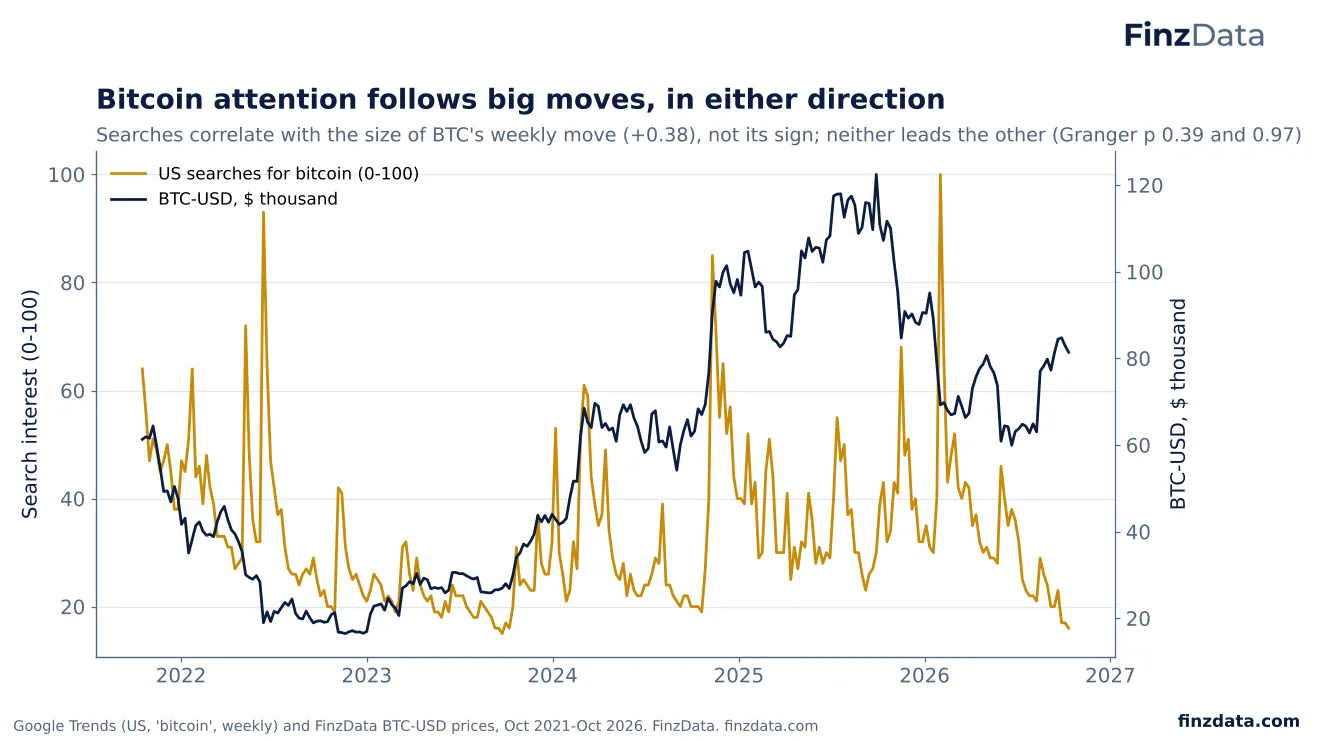
FinzData Research, October 2026.
US bitcoin searches move with the size of bitcoin's weekly move (correlation +0.38) but not its direction, and big moves raise the next week's searches (t +2.9). Neither searches nor price help predict the other in Granger tests.
68. Job searches are a real-time read on jobless claims
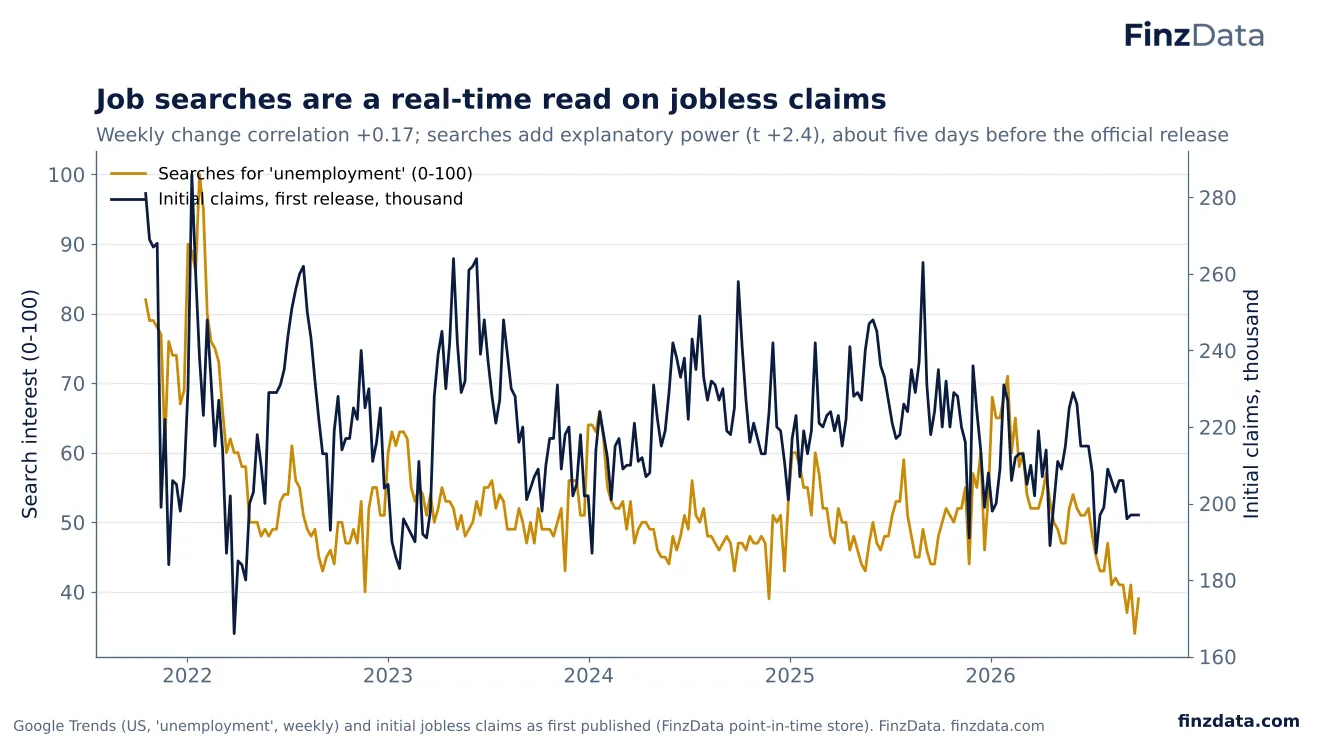
FinzData Research, October 2026.
Weekly searches for 'unemployment' track initial jobless claims as first published: the weekly changes correlate at +0.17, and adding searches to a model of claims raises its explanatory power from 7% to 10% (t +2.4). Searches are available days before the Thursday release.
69. Twenty-two years: fear searches peak inside sell-offs
FinzData Research, October 2026.
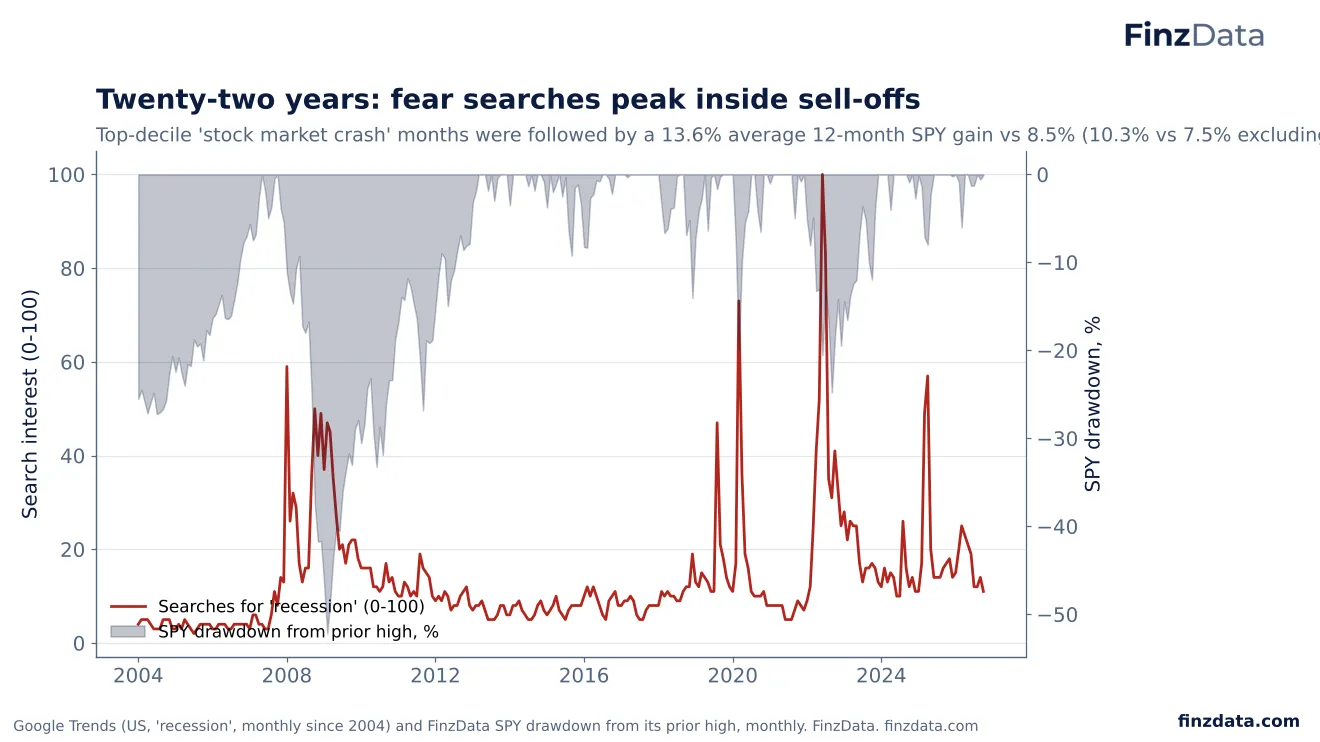
Monthly since 2004, searches for 'stock market crash' peaked in February 2018, March 2020, April 2025 and August 2024, all inside sell-offs. Months in the top 10% were followed by a 13.6% average 12-month SPY return versus 8.5% for all months, or 10.3% versus 7.5% excluding 2020.
70. In every market, attention follows volatility
FinzData Research, October 2026.
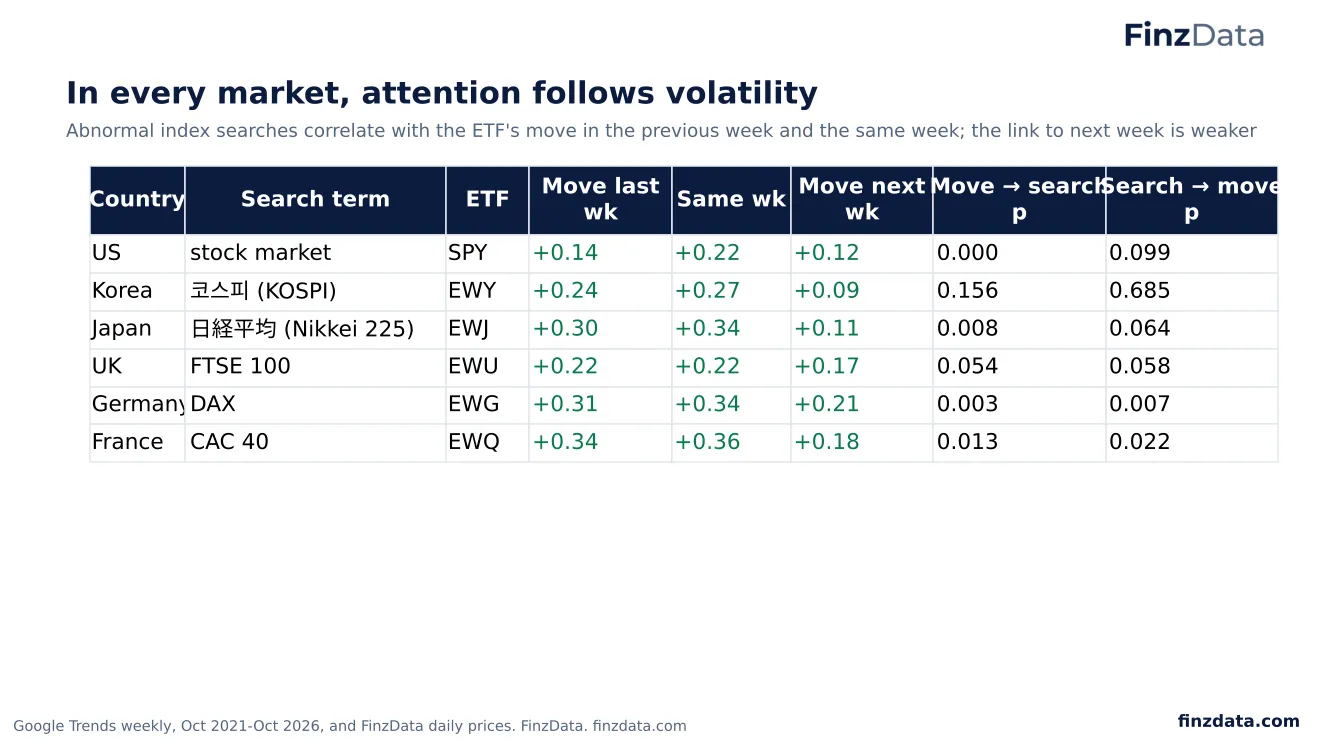
In Korea, Japan, Germany, France, the UK and the US, abnormal index searches rise with the size of the ETF's move in the same week (+0.22 to +0.36) and the week before. Germany (p 0.007) and France (p 0.022) are the two markets where searches also help predict next week's move size.
71. We asked an AI referee to attack our method
FinzData Research, October 2026.
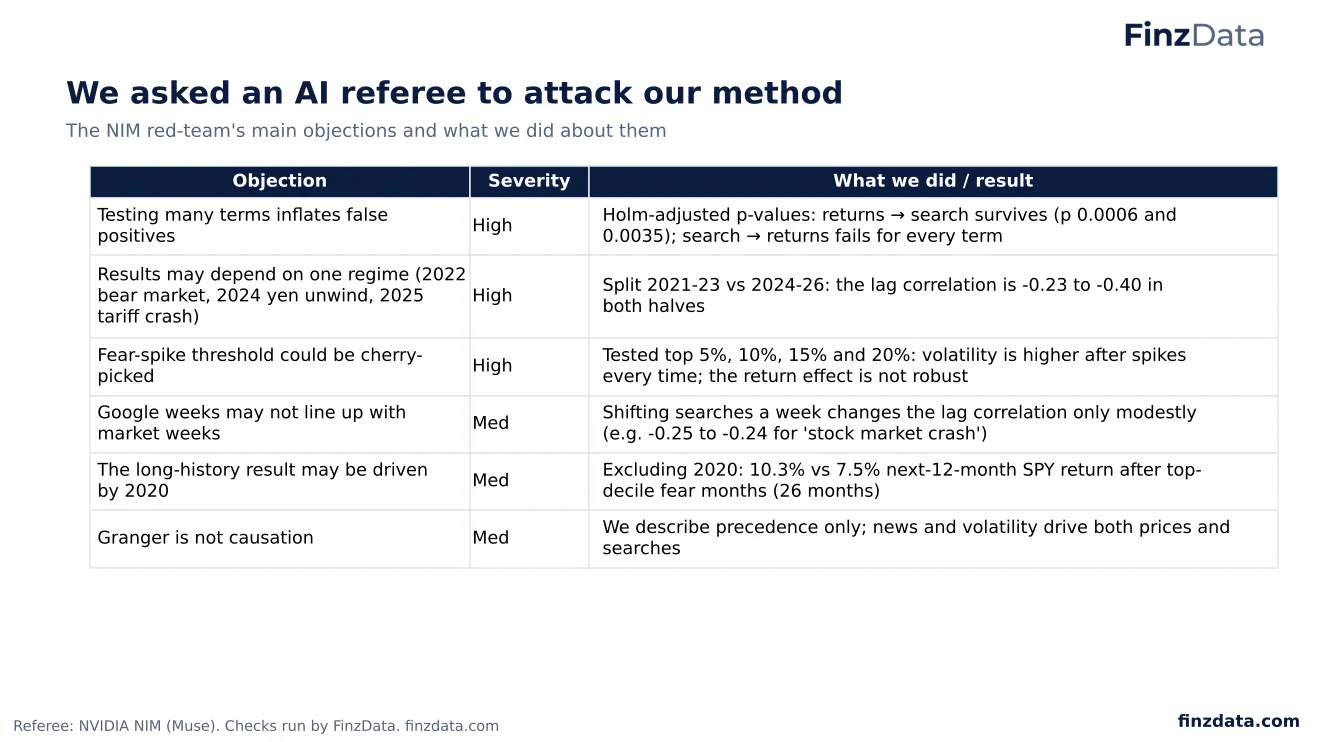
| Objection | Severity | What we did / result |
|---|---|---|
| Testing many terms inflates false positives | High | Holm-adjusted p-values: returns → search survives (p 0.0006 and 0.0035); search → returns fails for every term |
| Results may depend on one regime (2022 bear market, 2024 yen unwind, 2025 tariff crash) | High | Split 2021-23 vs 2024-26: the lag correlation is -0.23 to -0.40 in both halves |
| Fear-spike threshold could be cherry-picked | High | Tested top 5%, 10%, 15% and 20%: volatility is higher after spikes every time; the return effect is not robust |
| Google weeks may not line up with market weeks | Med | Shifting searches a week changes the lag correlation only modestly (e.g. -0.25 to -0.24 for 'stock market crash') |
| The long-history result may be driven by 2020 | Med | Excluding 2020: 10.3% vs 7.5% next-12-month SPY return after top-decile fear months (26 months) |
| Granger is not causation | Med | We describe precedence only; news and volatility drive both prices and searches |
72. The verdict: leading or lagging?
FinzData Research, October 2026.
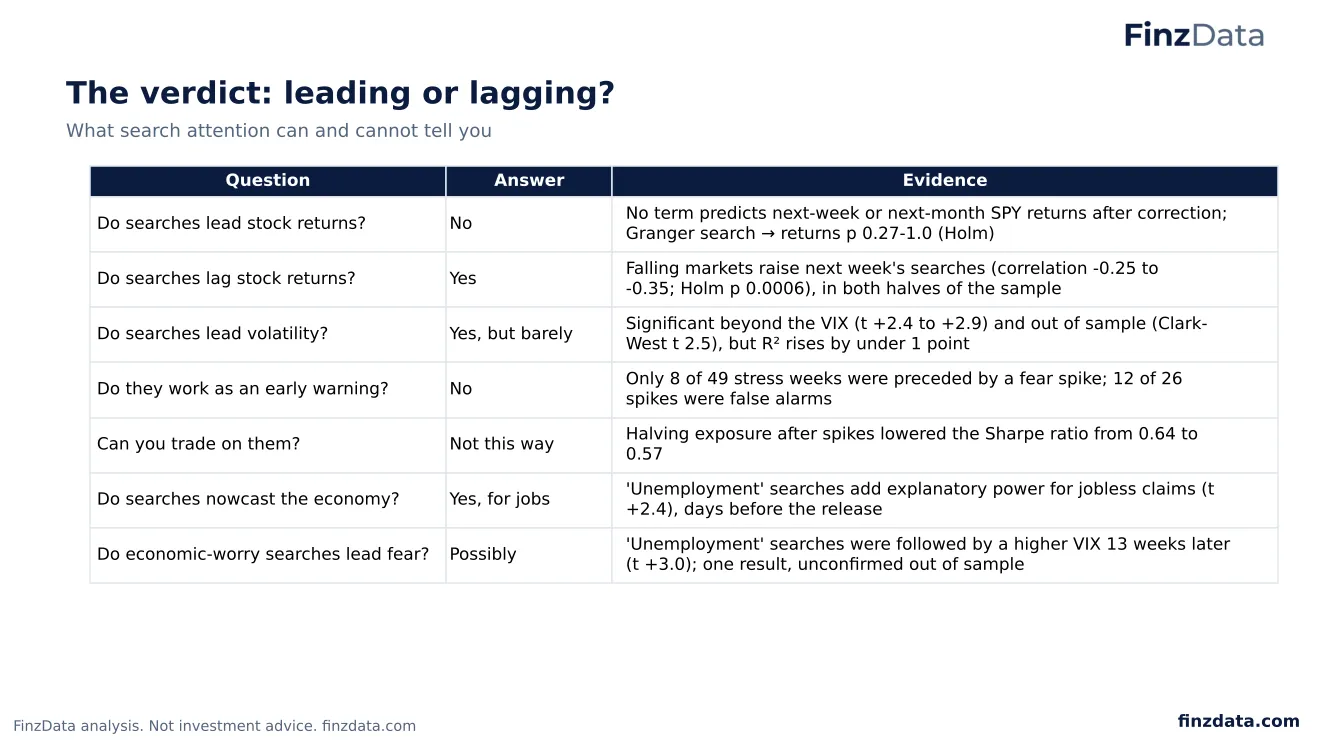
| Question | Answer | Evidence |
|---|---|---|
| Do searches lead stock returns? | No | No term predicts next-week or next-month SPY returns after correction; Granger search → returns p 0.27-1.0 (Holm) |
| Do searches lag stock returns? | Yes | Falling markets raise next week's searches (correlation -0.25 to -0.35; Holm p 0.0006), in both halves of the sample |
| Do searches lead volatility? | Yes, but barely | Significant beyond the VIX (t +2.4 to +2.9) and out of sample (Clark-West t 2.5), but R² rises by under 1 point |
| Do they work as an early warning? | No | Only 8 of 49 stress weeks were preceded by a fear spike; 12 of 26 spikes were false alarms |
| Can you trade on them? | Not this way | Halving exposure after spikes lowered the Sharpe ratio from 0.64 to 0.57 |
| Do searches nowcast the economy? | Yes, for jobs | 'Unemployment' searches add explanatory power for jobless claims (t +2.4), days before the release |
| Do economic-worry searches lead fear? | Possibly | 'Unemployment' searches were followed by a higher VIX 13 weeks later (t +3.0); one result, unconfirmed out of sample |
73. Search adds to the VIX, but only a little
FinzData Research, October 2026.
The hardest test for any new signal is whether it adds to what markets already price. Controlling for this week's realized volatility and the VIX, abnormal searches for 'stock market crash', 'recession', 'stock market' and 'VIX' still predict next week's realized volatility (t +2.4 to +2.9). But the explanatory power rises only from 88.4% to between 88.7% and 89.1%: statistically real, economically small.
74. Out of sample, the volatility signal survives
FinzData Research, October 2026.
To rule out hindsight, we forecast next-week realized volatility each week from June 2024 using only data available at the time. Adding the fear composite cut forecast errors by 2.4% relative to a model with past volatility and the VIX, and the Clark-West test (t 2.52) says the gain is significant.
75. Falls raise attention; rallies quiet it
FinzData Research, October 2026.
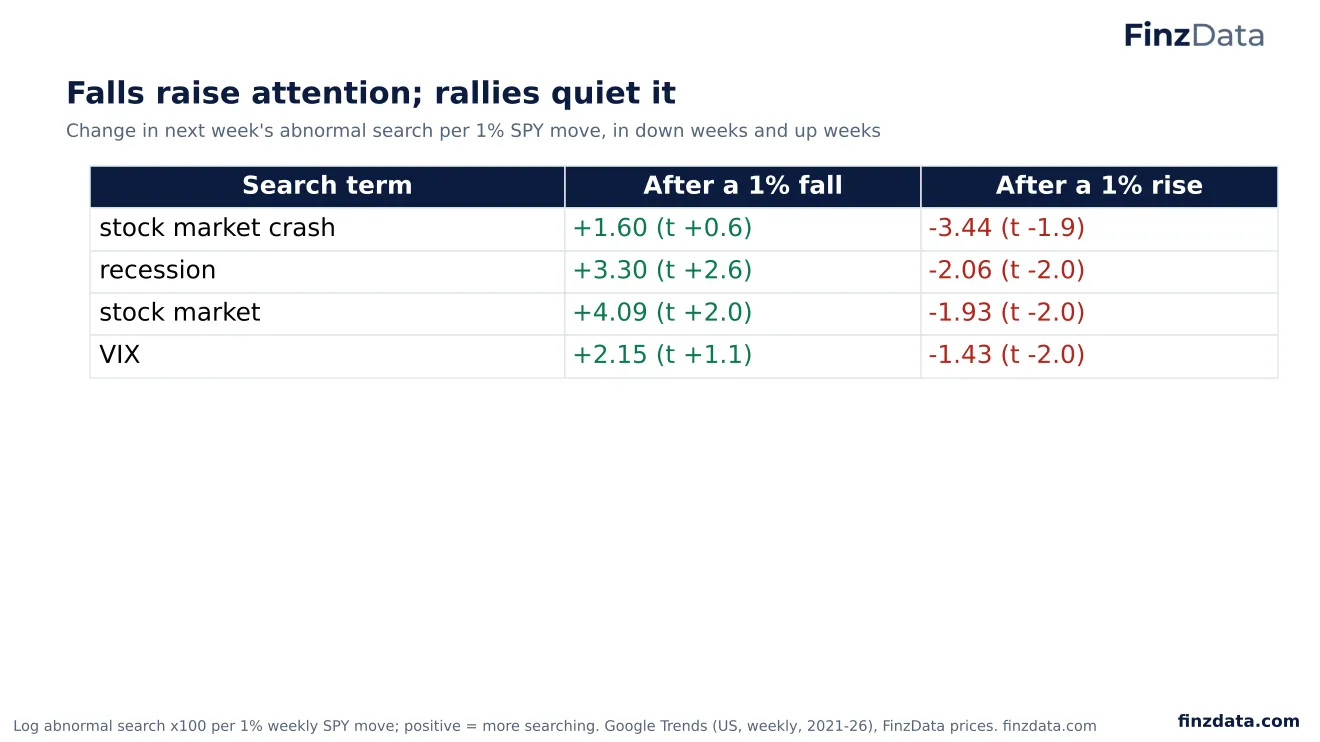
A 1% fall in SPY raises next week's abnormal searches for 'stock market' and 'recession' (t +2.0 and +2.6), and a 1% rise lowers them. Searches for 'stock market crash' and 'VIX' respond more to rallies, which calm them, than to falls, though not all of these effects are significant at 5%.
76. Google's numbers are consistent for busy terms
FinzData Research, October 2026.
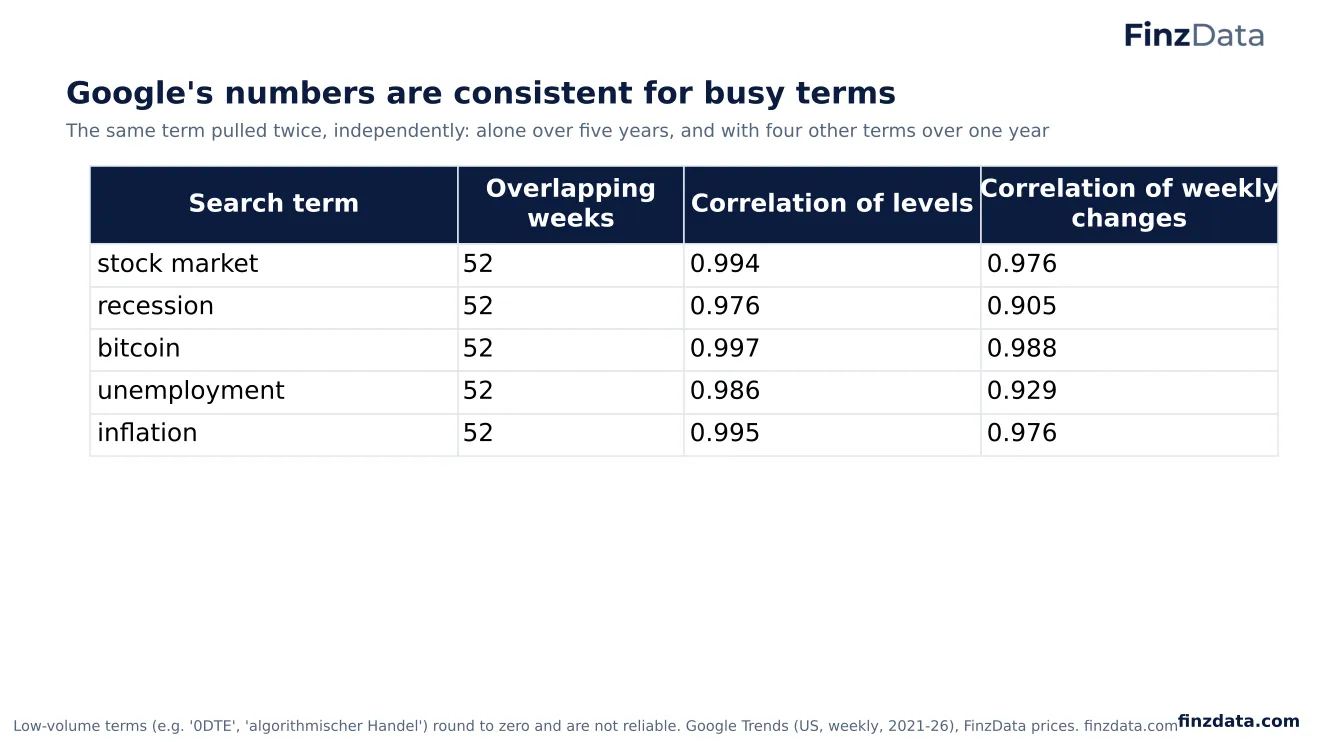
Google Trends reports a sample of searches and rescales each request, so the same query can return slightly different numbers. We pulled four terms twice, independently. For busy terms the two pulls agree almost perfectly: levels correlate at 0.98 to 0.997 and weekly changes at 0.90 to 0.99. Rare terms are much noisier, and we do not draw conclusions from them.
77. As an early warning, search mostly fails
FinzData Research, October 2026.
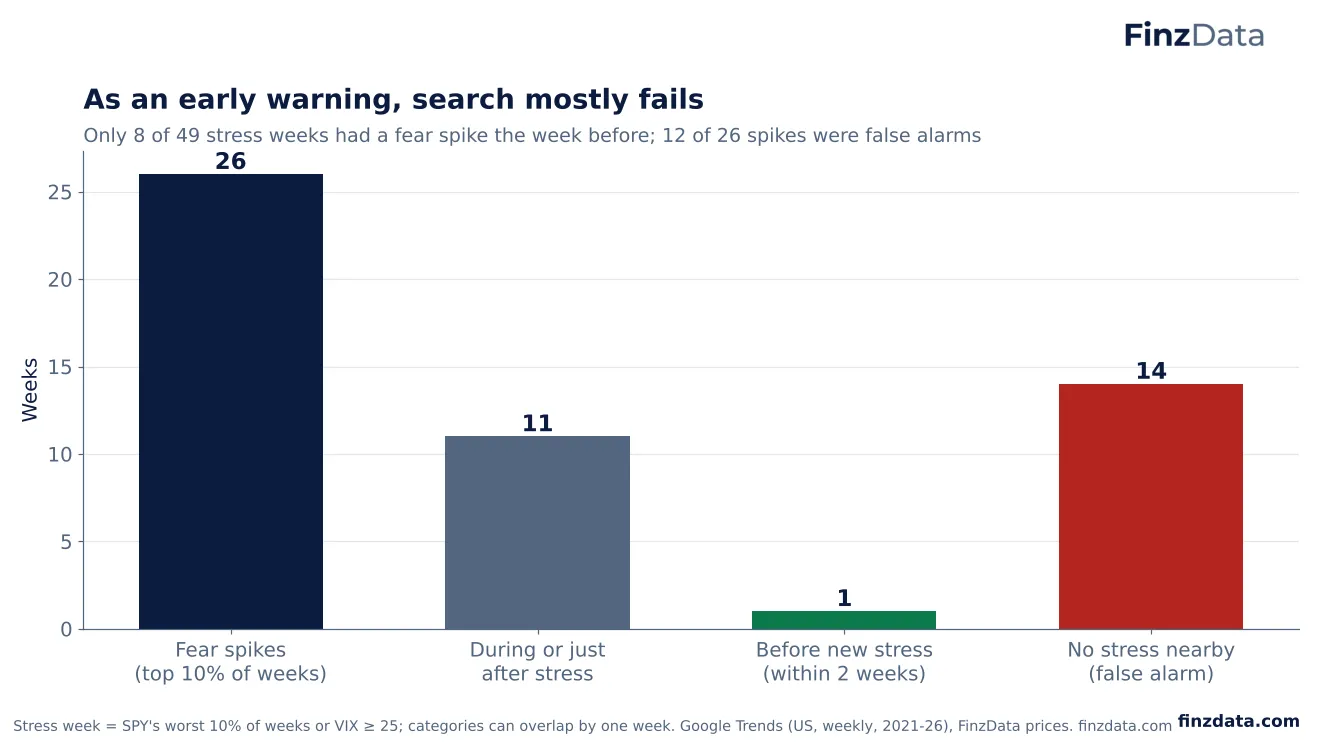
Of 26 fear-search spikes in five years, 11 came during or just after a stress week, 4 came before new stress and 12 had no stress nearby. Seen from the other side, only 8 of 49 stress weeks (SPY's worst 10% of weeks or a VIX of 25 or more) had a spike the week before. Search tells you stress has arrived, not that it is coming.
78. Acting on fear spikes would have cost money
FinzData Research, October 2026.
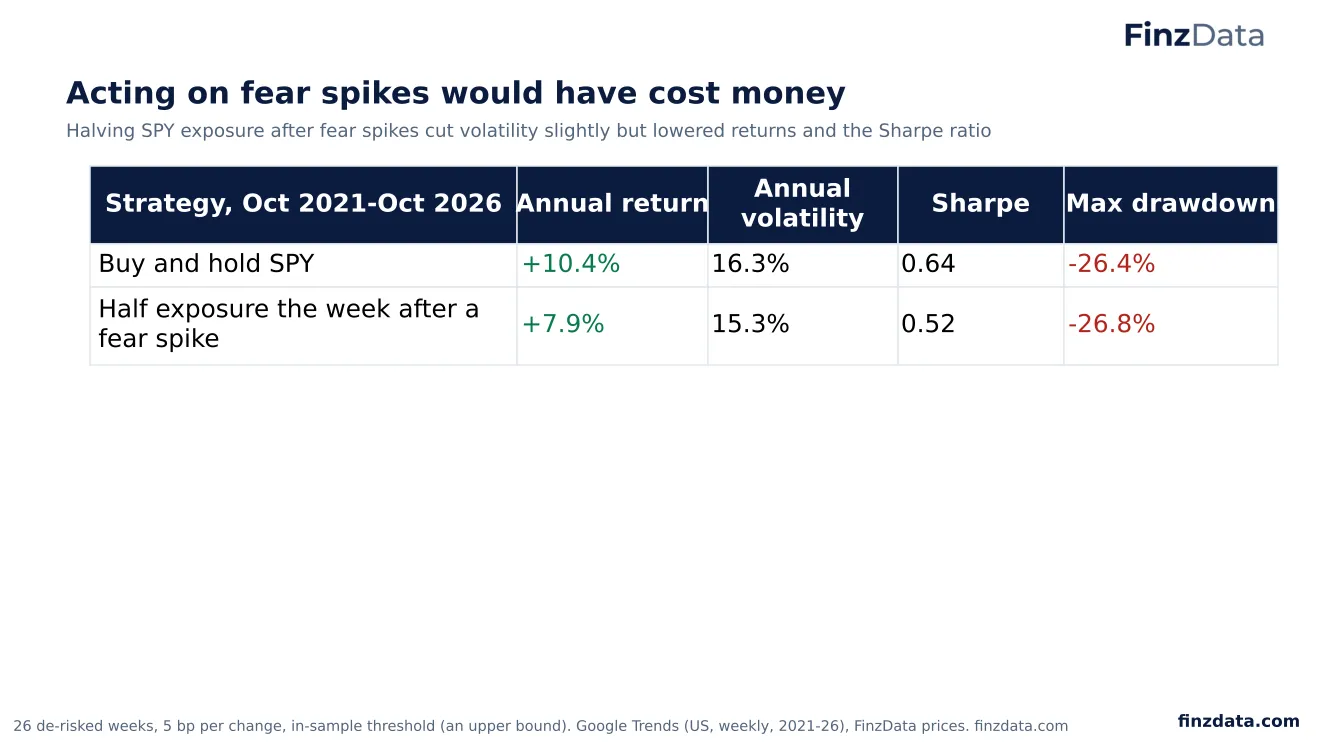
Halving SPY exposure for a week after each fear spike, with 5 basis points of cost per change, would have returned 8.8% a year against 10.4% for buy-and-hold, with slightly lower volatility, a lower Sharpe ratio (0.57 vs 0.64) and no smaller maximum drawdown. Markets tended to rebound after spikes, so cutting risk then gave up gains. The threshold was set with hindsight, so even this result is flattering.
79. devil
FinzData Research, October 2026.
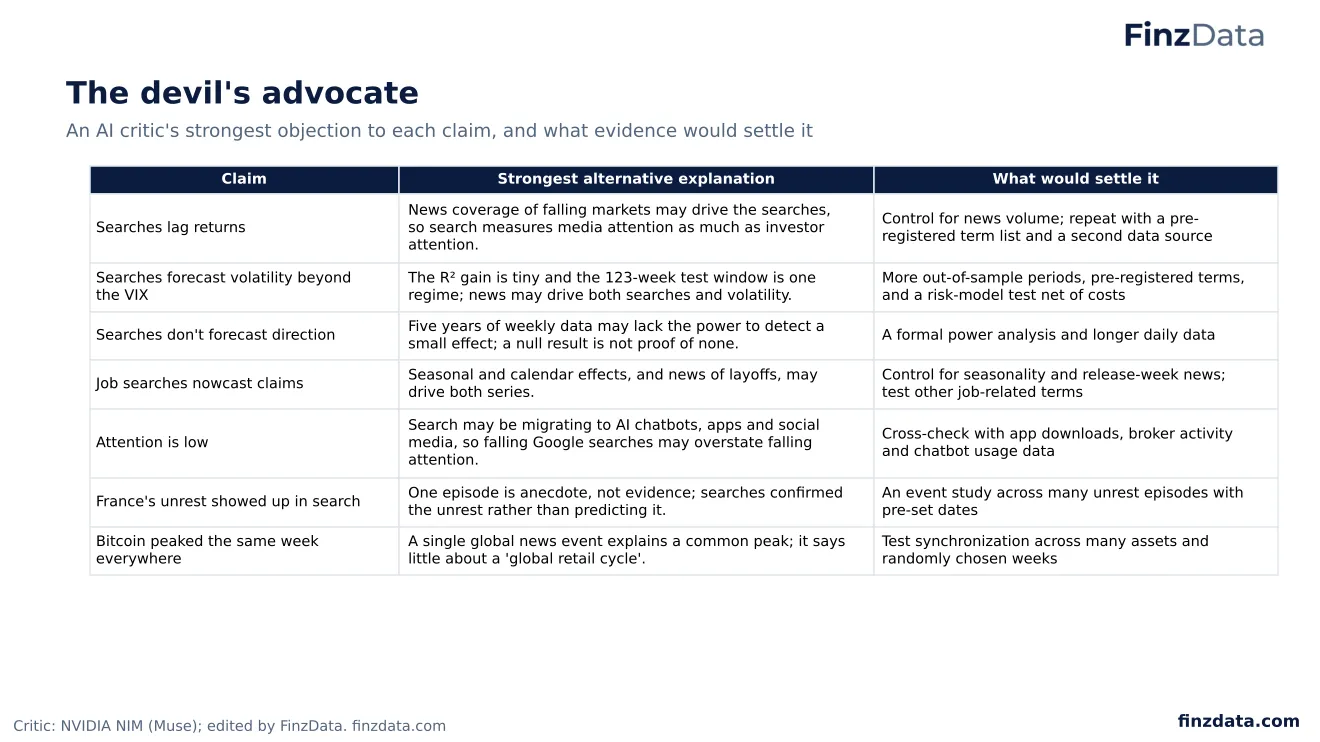
We asked an AI critic to attack every headline claim. The strongest objections: news coverage may drive both searches and markets; searches may be moving from Google to AI chatbots and apps, overstating the drop in attention; and France is a single episode. We show each objection with the evidence that would settle it.
80. limits
FinzData Research, October 2026.
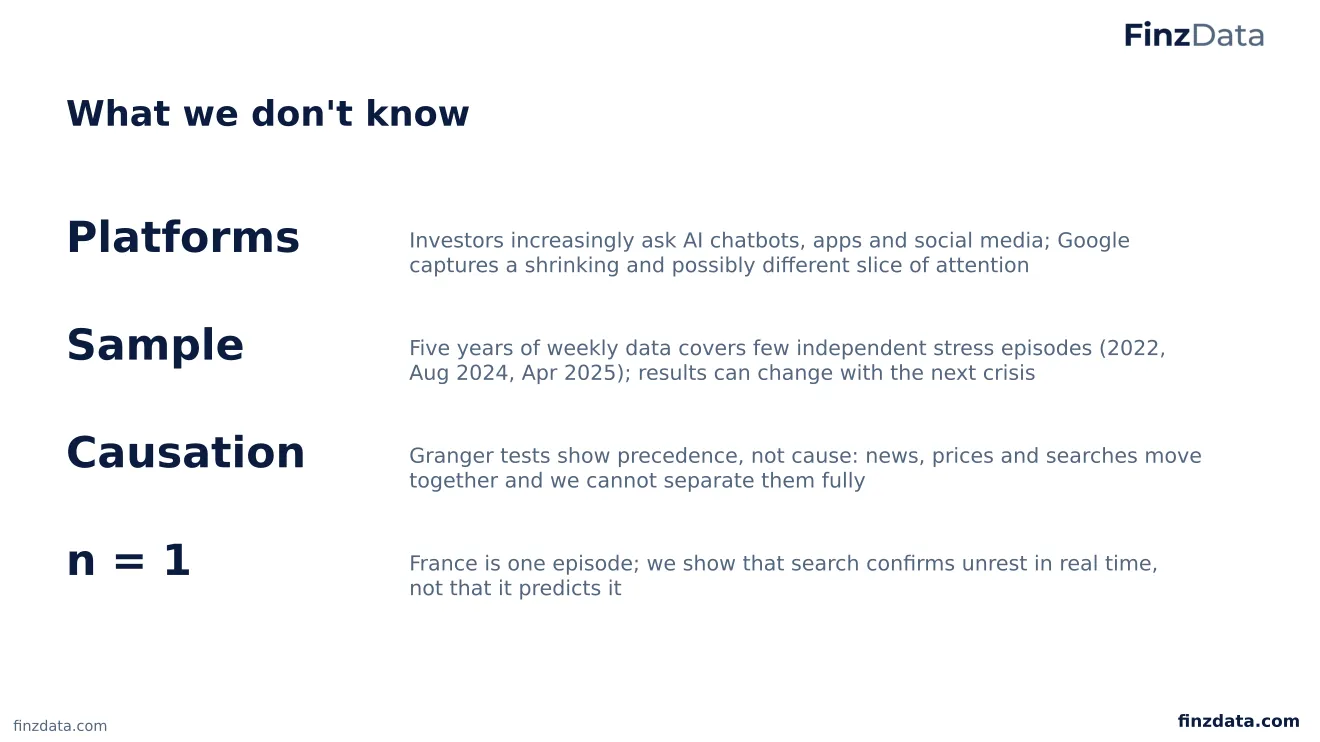
Four limits matter most: Google captures a shrinking slice of attention as investors use chatbots and apps; five years contains few independent crises; Granger tests show precedence, not cause; and the France result rests on one episode.
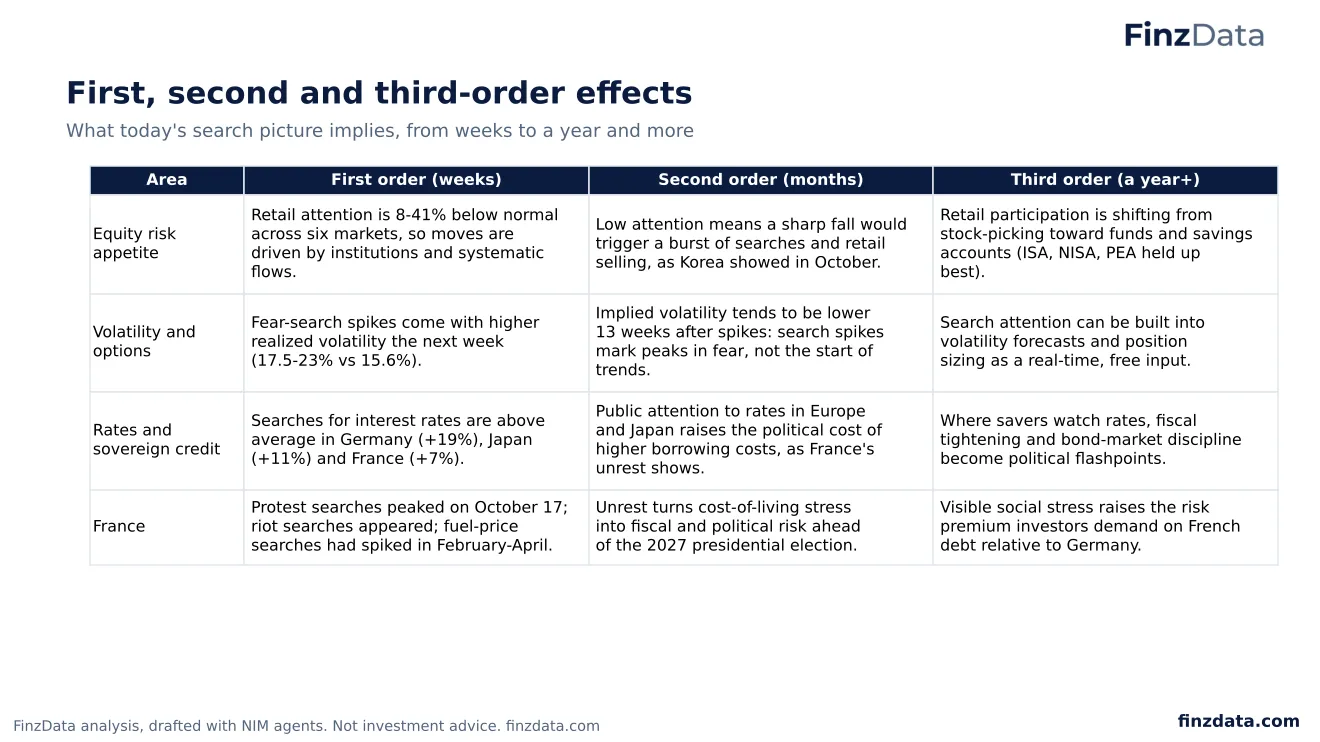
81. First, second and third-order effects
FinzData Research, October 2026.
| Area | First order (weeks) | Second order (months) | Third order (a year+) |
|---|---|---|---|
| Equity risk appetite | Retail attention is 8-41% below normal across six markets, so moves are driven by institutions and systematic flows. | Low attention means a sharp fall would trigger a burst of searches and retail selling, as Korea showed in October. | Retail participation is shifting from stock-picking toward funds and savings accounts (ISA, NISA, PEA held up best). |
| Volatility and options | Fear-search spikes come with higher realized volatility the next week (17.5-23% vs 15.6%). | Implied volatility tends to be lower 13 weeks after spikes: search spikes mark peaks in fear, not the start of trends. | Search attention can be built into volatility forecasts and position sizing as a real-time, free input. |
| Rates and sovereign credit | Searches for interest rates are above average in Germany (+19%), Japan (+11%) and France (+7%). | Public attention to rates in Europe and Japan raises the political cost of higher borrowing costs, as France's unrest shows. | Where savers watch rates, fiscal tightening and bond-market discipline become political flashpoints. |
| France | Protest searches peaked on October 17; riot searches appeared; fuel-price searches had spiked in February-April. | Unrest turns cost-of-living stress into fiscal and political risk ahead of the 2027 presidential election. | Visible social stress raises the risk premium investors demand on French debt relative to Germany. |
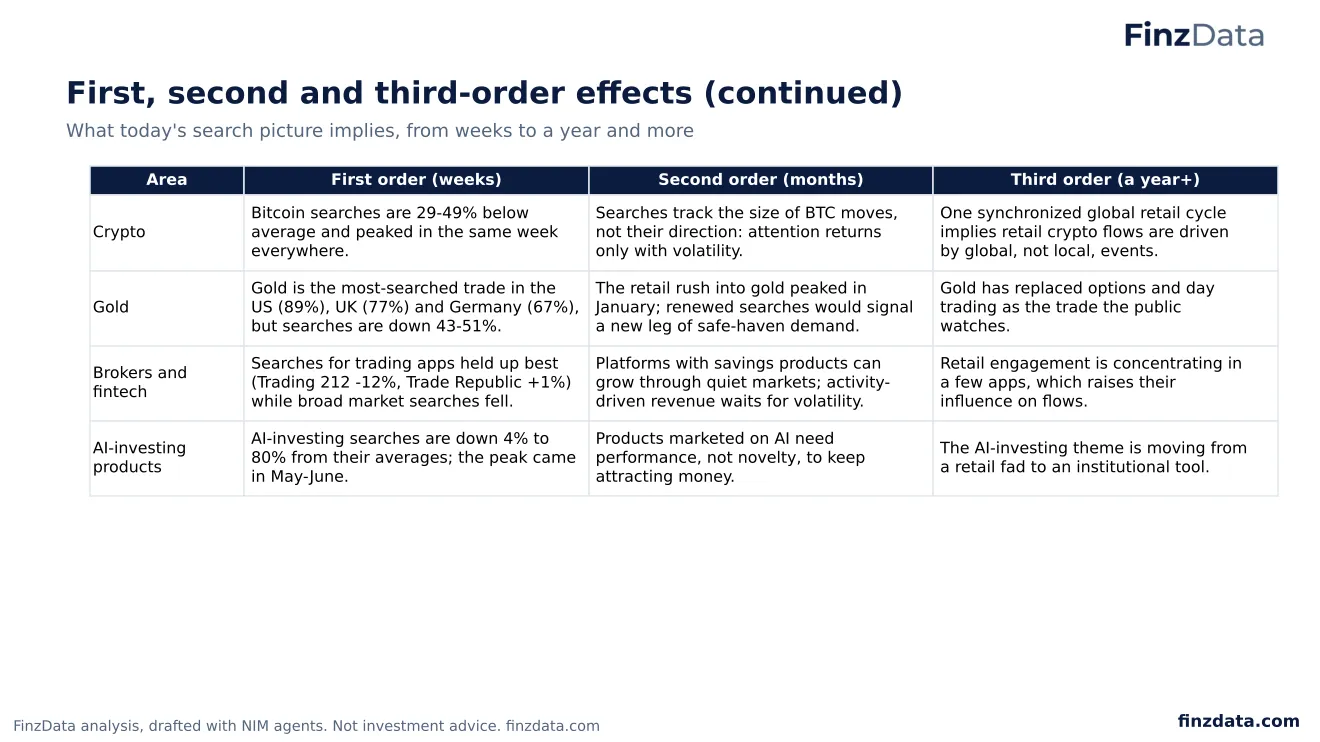
82. First, second and third-order effects (continued)
FinzData Research, October 2026.
| Area | First order (weeks) | Second order (months) | Third order (a year+) |
|---|---|---|---|
| Crypto | Bitcoin searches are 29-49% below average and peaked in the same week everywhere. | Searches track the size of BTC moves, not their direction: attention returns only with volatility. | One synchronized global retail cycle implies retail crypto flows are driven by global, not local, events. |
| Gold | Gold is the most-searched trade in the US (89%), UK (77%) and Germany (67%), but searches are down 43-51%. | The retail rush into gold peaked in January; renewed searches would signal a new leg of safe-haven demand. | Gold has replaced options and day trading as the trade the public watches. |
| Brokers and fintech | Searches for trading apps held up best (Trading 212 -12%, Trade Republic +1%) while broad market searches fell. | Platforms with savings products can grow through quiet markets; activity-driven revenue waits for volatility. | Retail engagement is concentrating in a few apps, which raises their influence on flows. |
| AI-investing products | AI-investing searches are down 4% to 80% from their averages; the peak came in May-June. | Products marketed on AI need performance, not novelty, to keep attracting money. | The AI-investing theme is moving from a retail fad to an institutional tool. |
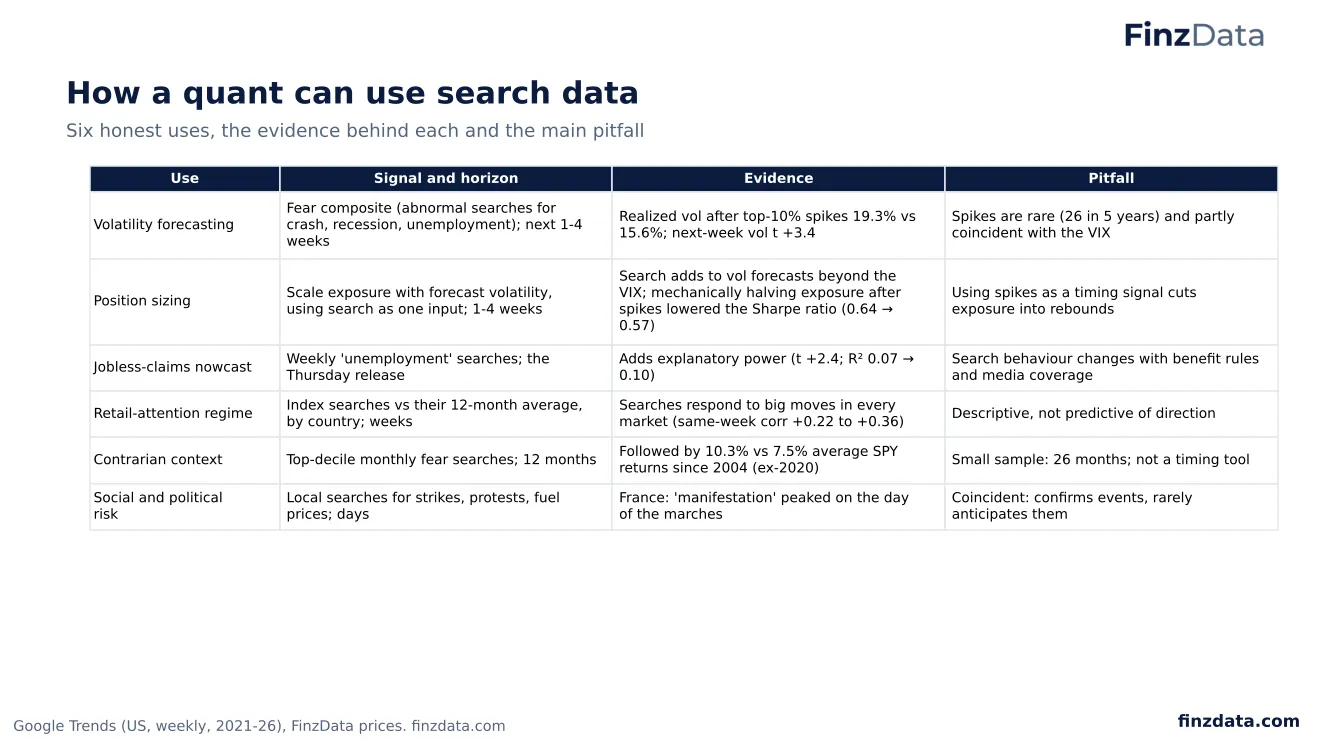
83. How a quant can use search data
FinzData Research, October 2026.
| Use | Signal and horizon | Evidence | Pitfall |
|---|---|---|---|
| Volatility forecasting | Fear composite (abnormal searches for crash, recession, unemployment); next 1-4 weeks | Realized vol after top-10% spikes 19.3% vs 15.6%; next-week vol t +3.4 | Spikes are rare (26 in 5 years) and partly coincident with the VIX |
| Position sizing | Scale exposure with forecast volatility, using search as one input; 1-4 weeks | Search adds to vol forecasts beyond the VIX; mechanically halving exposure after spikes lowered the Sharpe ratio (0.64 → 0.57) | Using spikes as a timing signal cuts exposure into rebounds |
| Jobless-claims nowcast | Weekly 'unemployment' searches; the Thursday release | Adds explanatory power (t +2.4; R² 0.07 → 0.10) | Search behaviour changes with benefit rules and media coverage |
| Retail-attention regime | Index searches vs their 12-month average, by country; weeks | Searches respond to big moves in every market (same-week corr +0.22 to +0.36) | Descriptive, not predictive of direction |
| Contrarian context | Top-decile monthly fear searches; 12 months | Followed by 10.3% vs 7.5% average SPY returns since 2004 (ex-2020) | Small sample: 26 months; not a timing tool |
| Social and political risk | Local searches for strikes, protests, fuel prices; days | France: 'manifestation' peaked on the day of the marches | Coincident: confirms events, rarely anticipates them |
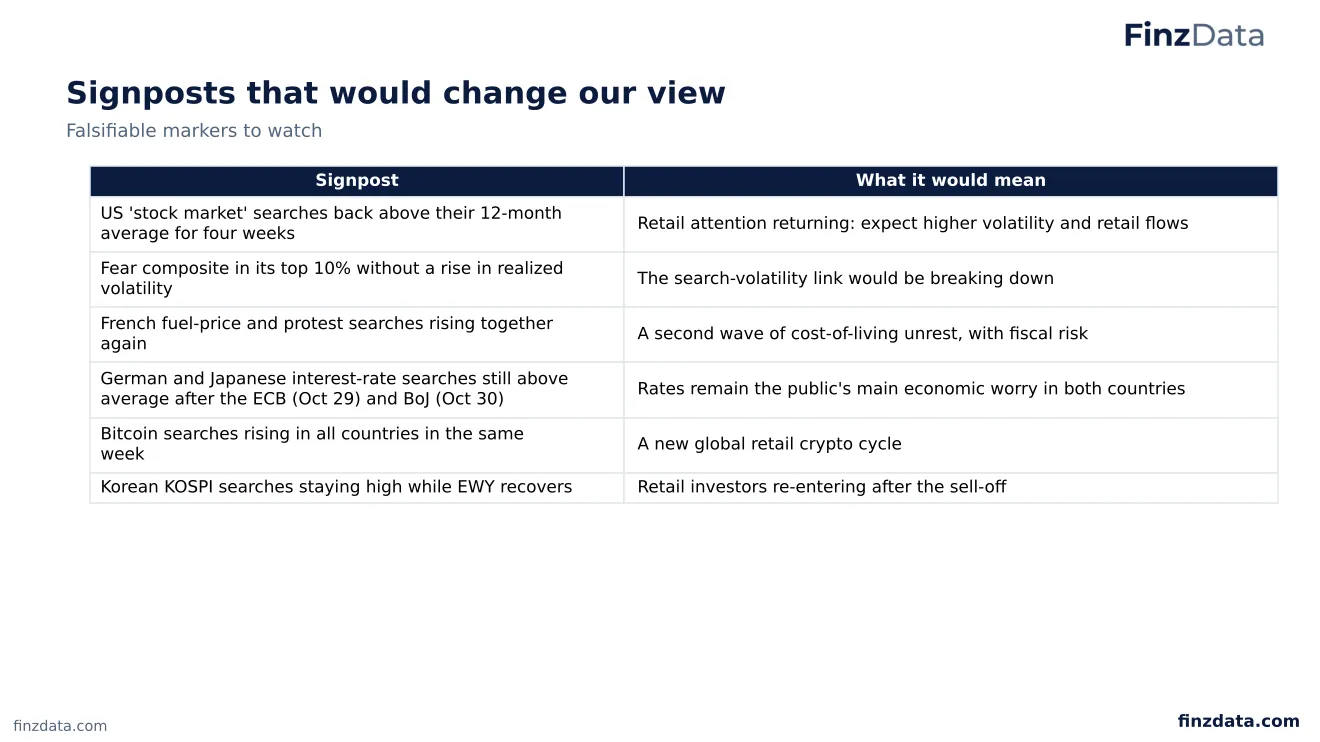
84. Signposts that would change our view
FinzData Research, October 2026.
| Signpost | What it would mean |
|---|---|
| US 'stock market' searches back above their 12-month average for four weeks | Retail attention returning: expect higher volatility and retail flows |
| Fear composite in its top 10% without a rise in realized volatility | The search-volatility link would be breaking down |
| French fuel-price and protest searches rising together again | A second wave of cost-of-living unrest, with fiscal risk |
| German and Japanese interest-rate searches still above average after the ECB (Oct 29) and BoJ (Oct 30) | Rates remain the public's main economic worry in both countries |
| Bitcoin searches rising in all countries in the same week | A new global retail crypto cycle |
| Korean KOSPI searches staying high while EWY recovers | Retail investors re-entering after the sell-off |
85. Our read
FinzData Research, October 2026.
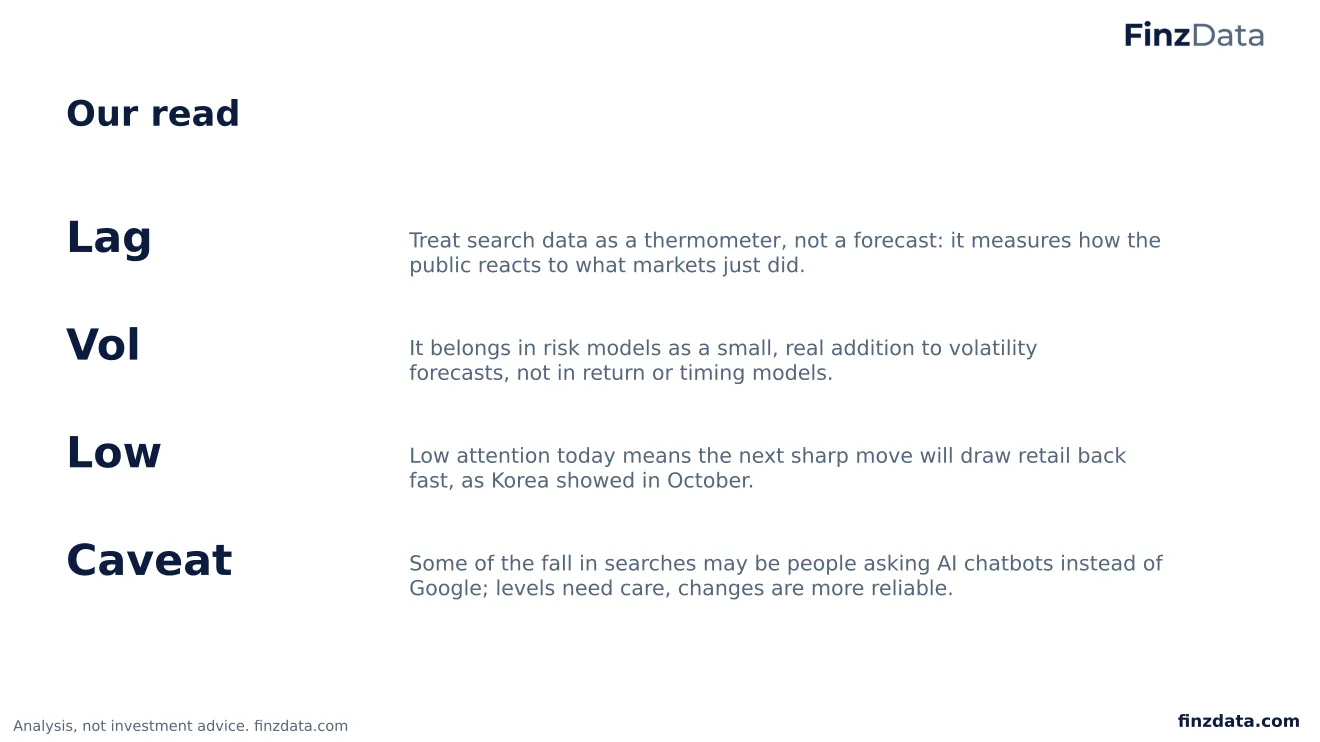
- Lag: Treat search data as a thermometer, not a forecast: it measures how the public reacts to what markets just did.
- Vol: It belongs in risk models as a small, real addition to volatility forecasts, not in return or timing models.
- Low: Low attention today means the next sharp move will draw retail back fast, as Korea showed in October.
- Caveat: Some of the fall in searches may be people asking AI chatbots instead of Google; levels need care, changes are more reliable.
86. What to watch
FinzData Research, October 2026.
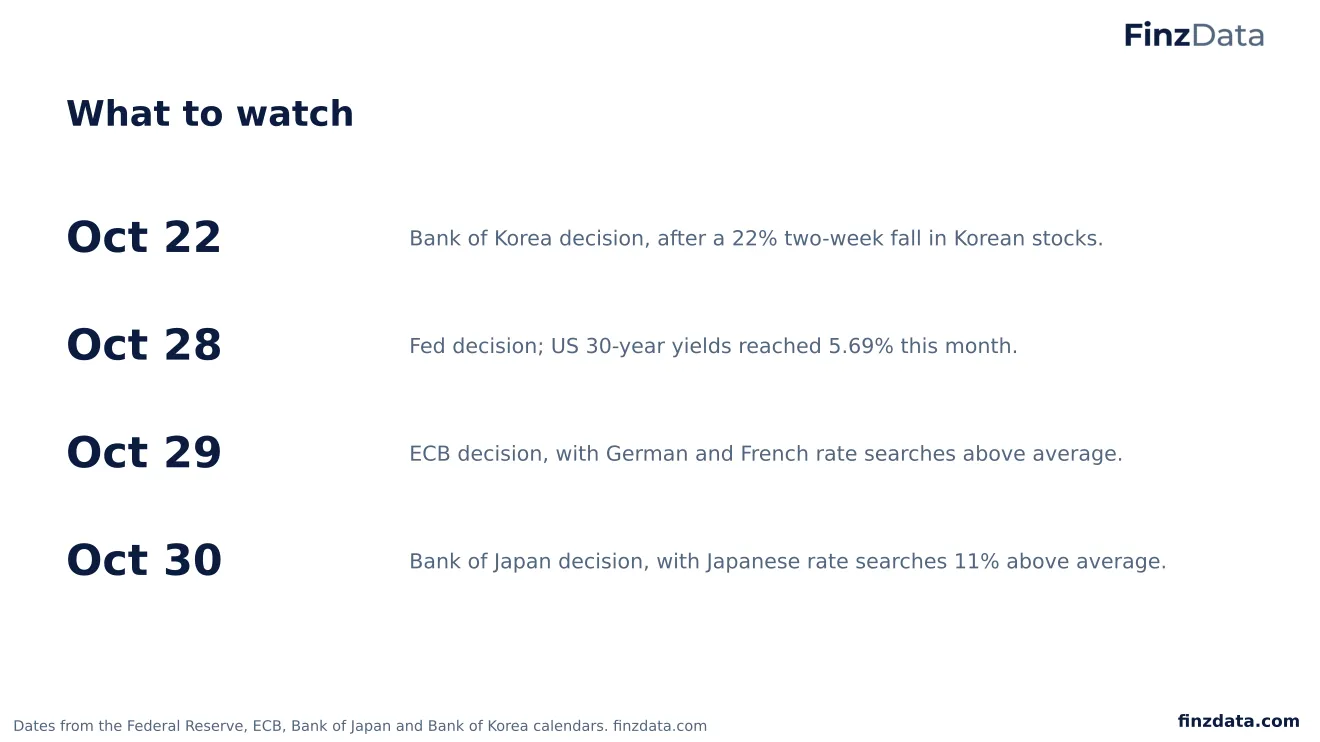
- Oct 22: Bank of Korea decision, after a 22% two-week fall in Korean stocks.
- Oct 28: Fed decision; US 30-year yields reached 5.69% this month.
- Oct 29: ECB decision, with German and French rate searches above average.
- Oct 30: Bank of Japan decision, with Japanese rate searches 11% above average.
87. The data behind this research
FinzData Research, October 2026.
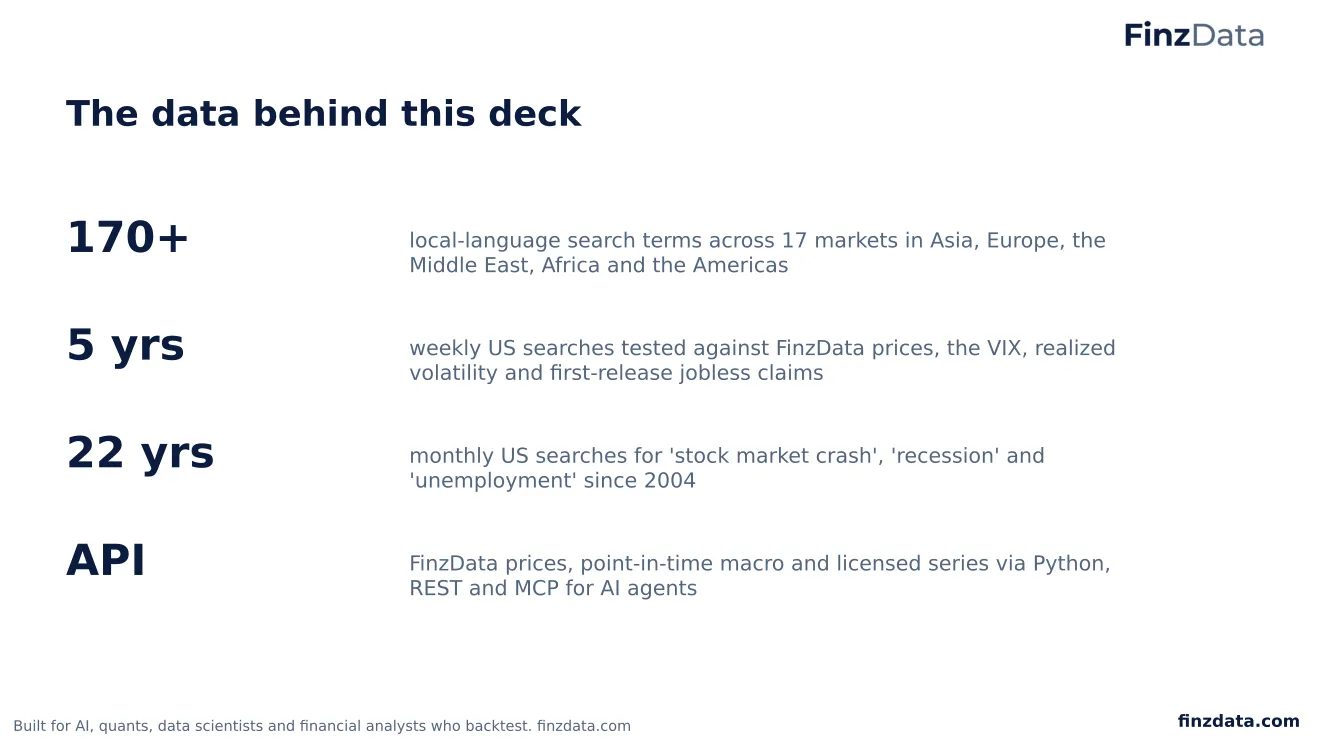
- 170+: local-language search terms across 17 markets in Asia, Europe, the Middle East, Africa and the Americas
- 5 yrs: weekly US searches tested against FinzData prices, the VIX, realized volatility and first-release jobless claims
- 22 yrs: monthly US searches for 'stock market crash', 'recession' and 'unemployment' since 2004
- API: FinzData prices, point-in-time macro and licensed series via Python, REST and MCP for AI agents
88. Sources
FinzData Research, October 2026.
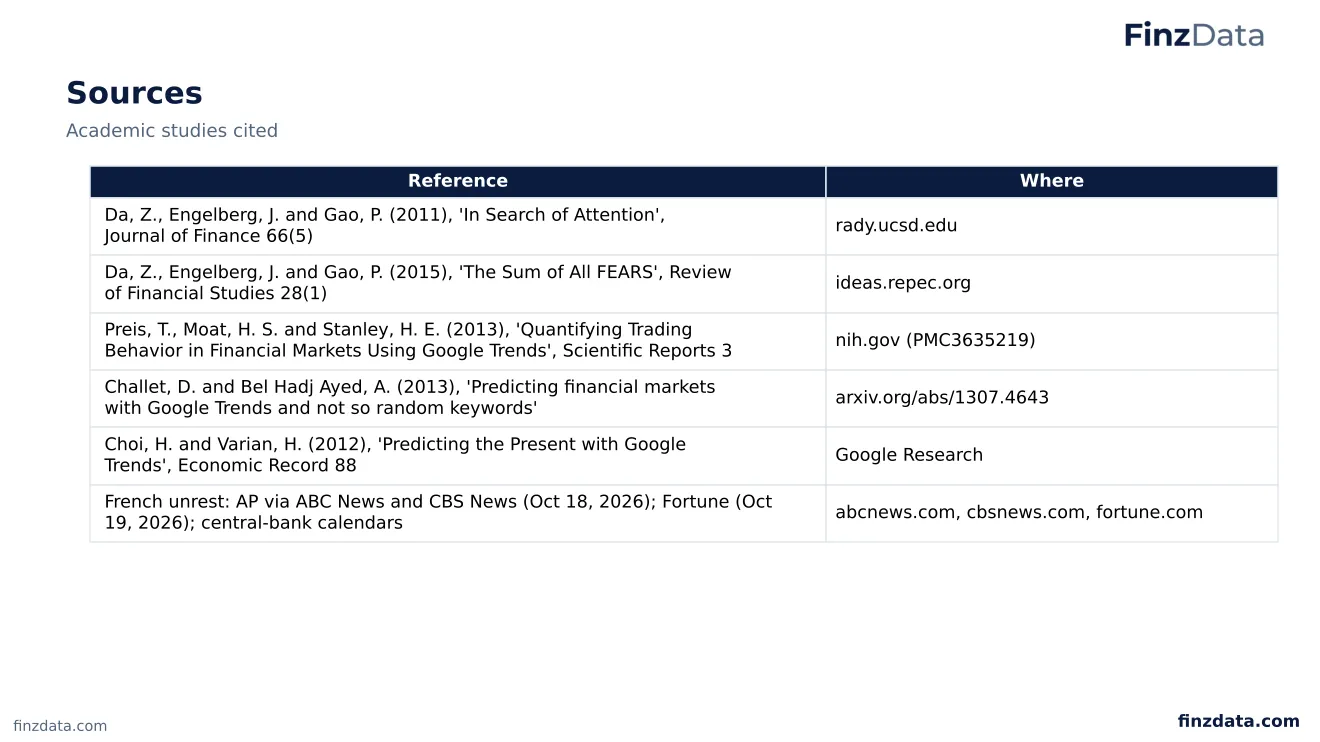
- Da, Z., Engelberg, J. and Gao, P. (2011), 'In Search of Attention', Journal of Finance 66(5) (rady.ucsd.edu)
- Da, Z., Engelberg, J. and Gao, P. (2015), 'The Sum of All FEARS', Review of Financial Studies 28(1) (ideas.repec.org)
- Preis, T., Moat, H. S. and Stanley, H. E. (2013), 'Quantifying Trading Behavior in Financial Markets Using Google Trends', Scientific Reports 3 (nih.gov (PMC3635219))
- Challet, D. and Bel Hadj Ayed, A. (2013), 'Predicting financial markets with Google Trends and not so random keywords' (arxiv.org/abs/1307.4643)
- Choi, H. and Varian, H. (2012), 'Predicting the Present with Google Trends', Economic Record 88 (Google Research)
- French unrest: AP via ABC News and CBS News (Oct 18, 2026); Fortune (Oct 19, 2026); central-bank calendars (abcnews.com, cbsnews.com, fortune.com)
Frequently asked questions
Do Google searches predict the stock market?
Not its direction. Over five years of weekly US data, no search term predicted next-week or next-month SPY returns after correcting for multiple tests. Searches do follow markets: falling weeks raise the next week's searches (Holm-adjusted p < 0.001).
Can search data forecast volatility?
Yes, in the short term. After the top 10% of weeks for fear searches, SPY's next-week realized volatility averaged 19.3% against 15.6% normally, and it was higher after spikes at every threshold we tested.
Did France's protests show up in Google searches?
Yes. Daily searches for 'manifestation' (protest) hit their 90-day peak on October 17, 2026, the day of the nationwide marches; searches for 'émeutes' (riots) appeared that week, and fuel-price searches had already surged in February to April.
Are search trends a leading indicator for jobless claims?
They help. Weekly searches for 'unemployment' added explanatory power to first-release initial claims (t = 2.4), and they are available about five days before the official release.
Download the deck (PDF, 88 slides) More research
Built for AI, quants, data scientists and financial analysts who backtest. Clean data. Real insights. Real alpha. finzdata.com. This material is for information only and is not investment advice. Data sources: Google Trends (trends.google.com); FinzData daily prices, VIX, realized volatility and first-release jobless claims; academic studies and news reports listed on the Sources slide.
Get FinzData research free, every morning
The daily brief: what moved, the macro releases that matter, positioning and liquidity, with charts. One email a day, free, unsubscribe anytime.