
FinzData Research · Published 20 October 2026
Taiwan's AI export machine: how chips and servers drive Taiwan's economy and stock market
Technology is 81% of Taiwan's exports, the United States has replaced China as its main customer, and one company is 44% of its stock market. We break down the third quarter (YTD, QoQ, MoM), what it implies for TSMC, Foxconn and Nvidia earnings, and whether the data predicts the stocks.
Get FinzData research free, every morning
The daily brief: what moved, the macro releases that matter, positioning and liquidity, with charts. One email a day, free, unsubscribe anytime.
Contents
- September 2026: Taiwan's biggest export month ever
- Technology is now four-fifths of Taiwan's exports
- Servers overtook chips as Taiwan's biggest export
- America replaced China as Taiwan's main customer
- Taiwan's boom is volume, not just price
- Q3 2026 scorecard: exports by product and destination
- Month over month: servers surged, chips paused
- Growth is still enormous, but it peaked in Q4 2025
- Over the past year, prices did more of the work
- What Q3 exports say about earnings
- Implications for earnings
- One company is 44% of Taiwan's stock market
- Tech exports and Taiwanese stocks move together
- And, like Korea's, they do not predict returns
- Korea sells the memory, Taiwan sells the logic and the servers
- The data behind this deck
- Frequently asked questions
1. Taiwan's AI Export Machine

FinzData Research, October 2026.
Taiwan builds most of the world's advanced logic chips and most of its AI servers. This paper measures how much of Taiwan's economy and stock market now rides on that, using the Ministry of Finance's customs statistics since 2001 (by product, by destination, and by price and volume) and daily prices for EWT, TSM, SOXX, SOXL and NVDA, all from the FinzData store. It is the companion to our Korea paper.
2. September 2026: Taiwan's biggest export month ever
Ministry of Finance trade statistics, September 2026.
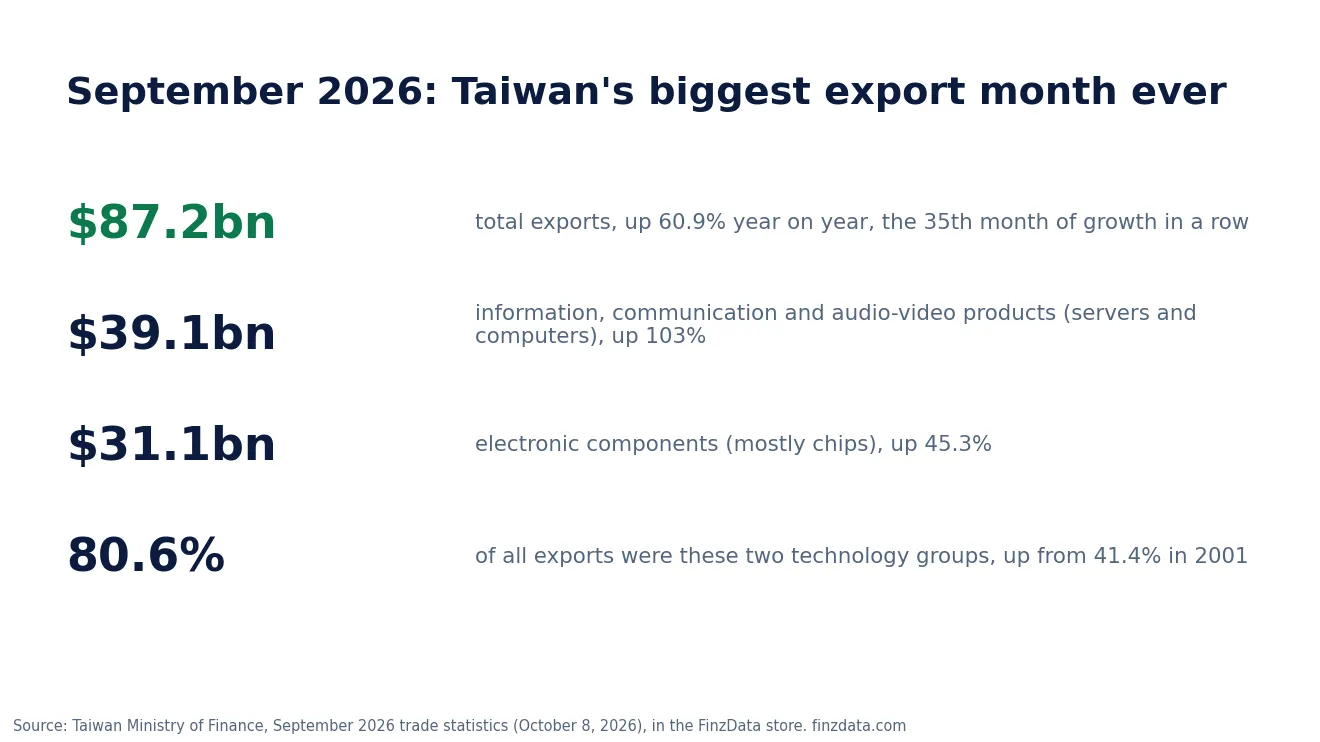
Taiwan exported $87.22 billion in September 2026, up 60.9% on a year earlier, a monthly record and the 35th straight month of growth. Information, communication and audio-video products (servers and computers) were $39.13 billion, roughly double a year earlier, and electronic components (chips) $31.13 billion, up 45.3%. January to September exports reached $661.5 billion, against $452.6 billion in the same months of 2025.
For a sense of scale: Taiwan exported a record $640.75 billion in 2025, about 70% of its GDP (IMF estimate, $920 billion). Few economies of its size depend this much on selling abroad.
3. Technology is now four-fifths of Taiwan's exports
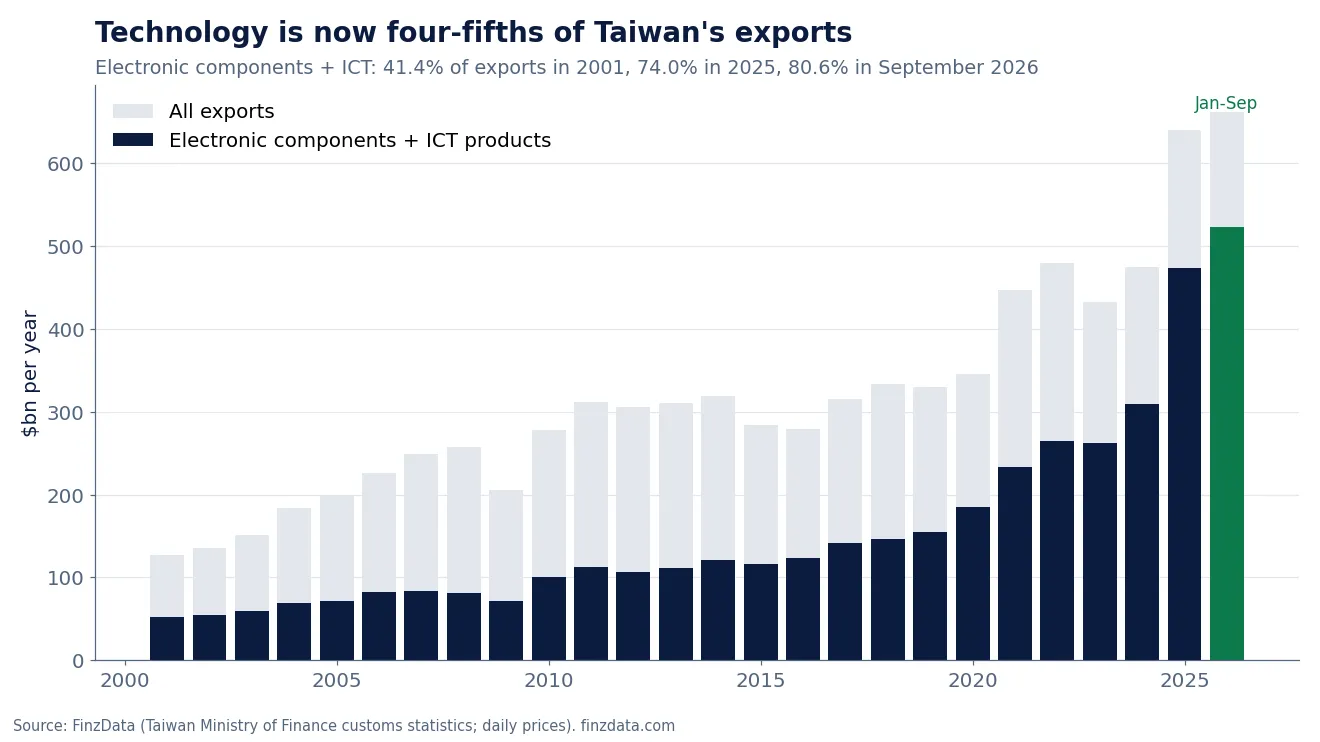
Annual exports, with electronic components and ICT products highlighted; 2026 is January to September.
Electronic components and ICT products were 41.4% of Taiwan's exports in 2001, 74.0% in 2025 and 80.6% in September 2026. In the first nine months of 2026 they totalled $522.5 billion, up from $327.7 billion a year earlier.
4. Servers overtook chips as Taiwan's biggest export
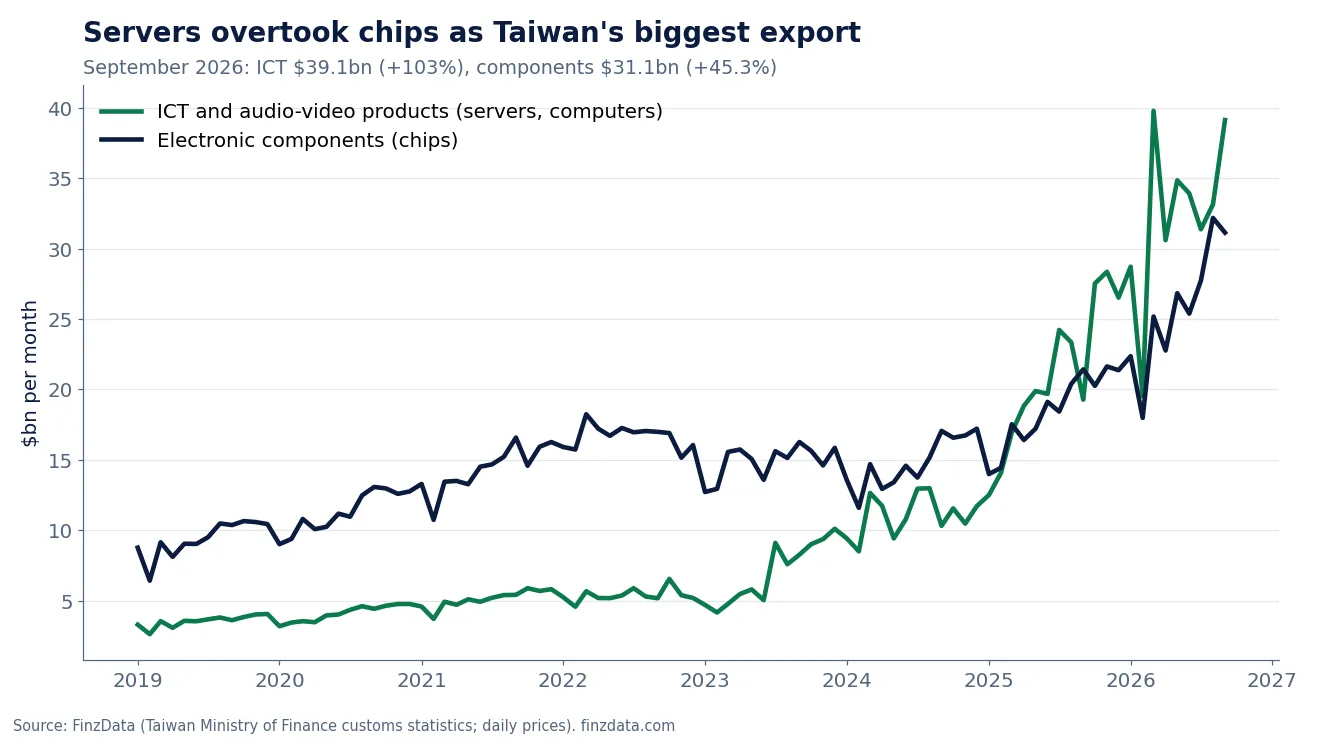
Monthly exports since 2019: ICT and audio-video products vs electronic components.
For two decades chips led Taiwan's exports. In April 2025 ICT products, driven by AI servers assembled for US data centres, overtook electronic components and have stayed ahead. In September 2026 ICT was $39.13 billion (+103%) against $31.13 billion of components (+45.3%).
5. America replaced China as Taiwan's main customer
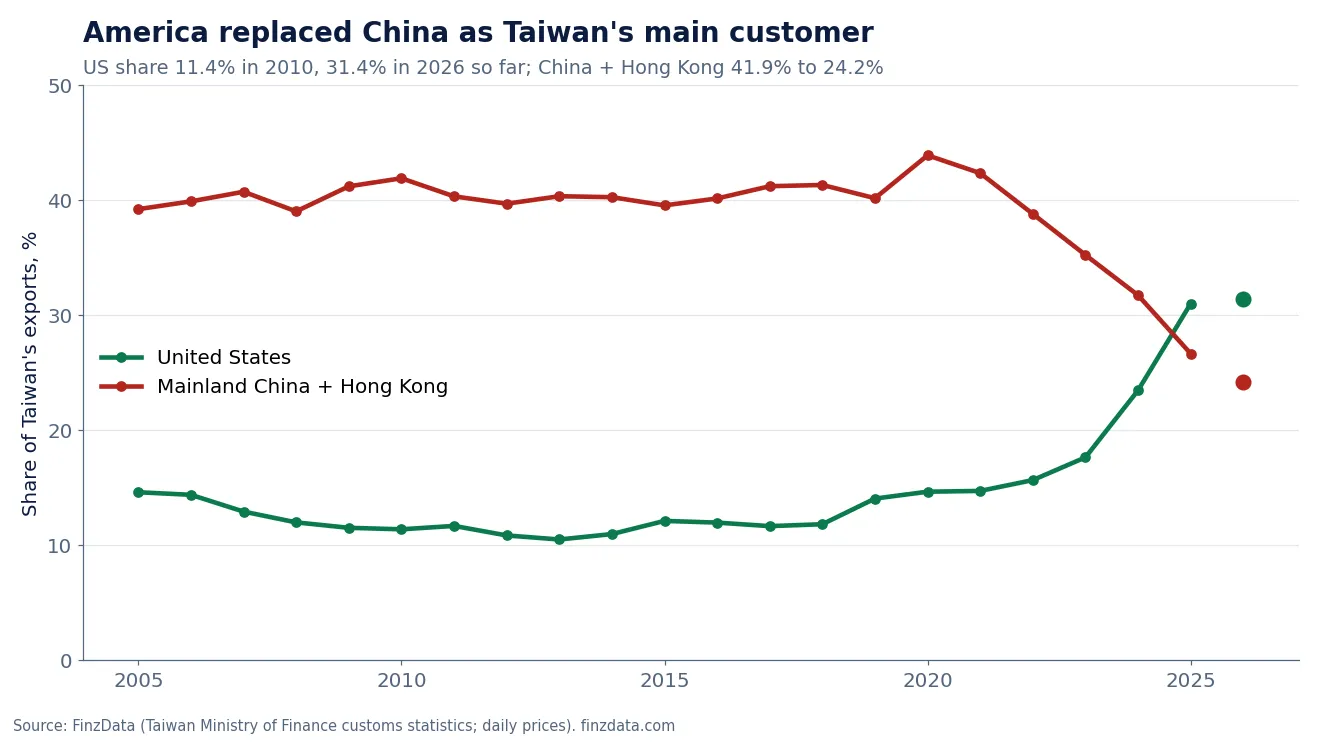
Share of Taiwan's exports going to the United States and to mainland China plus Hong Kong.
In 2010 mainland China and Hong Kong took 41.9% of Taiwan's exports and the United States 11.4%. By 2025 the US share was 31.0% and China plus Hong Kong 26.6%; so far in 2026 it is 31.4% against 24.2%. September exports to the US were $27.46 billion, up 106.2%, while exports to mainland China grew 32.0%. The AI build-out moved Taiwan's centre of gravity from Chinese factories to American data centres.
6. Taiwan's boom is volume, not just price
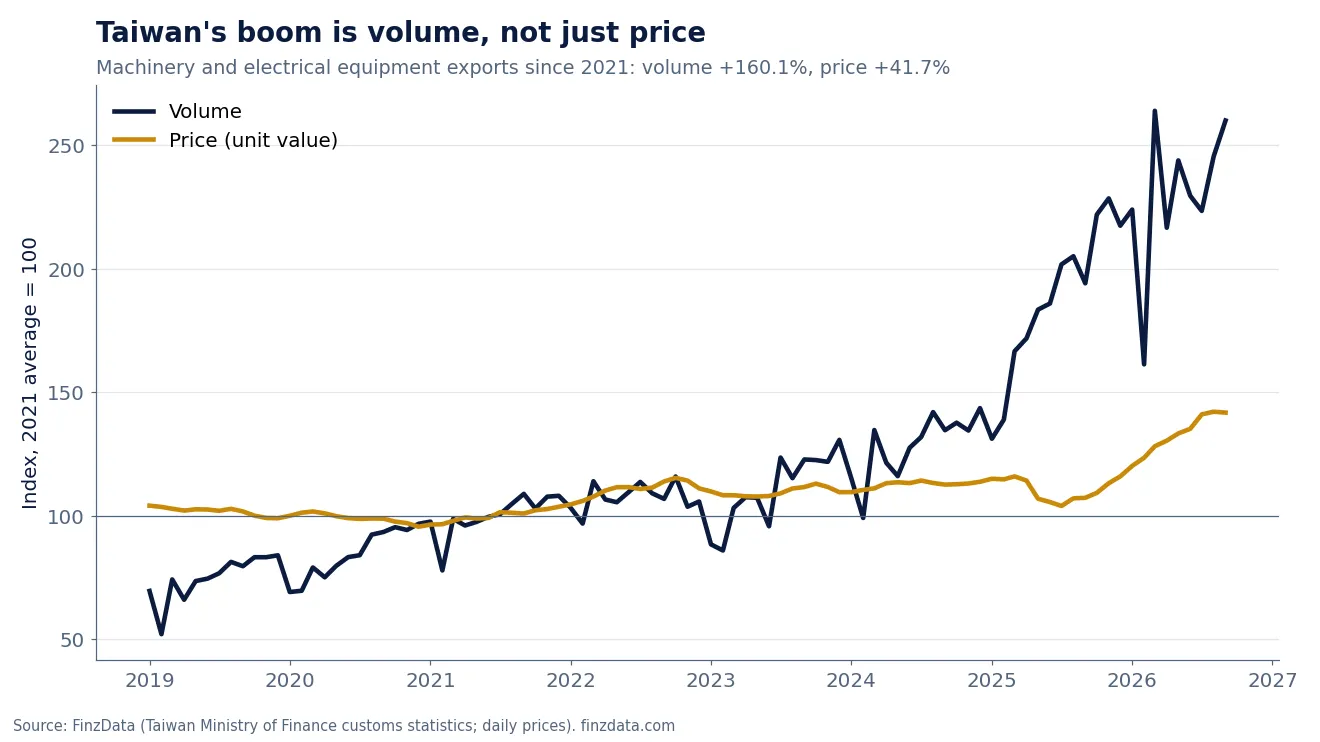
Machinery and electrical equipment exports (HS section XVI): volume and unit-value indices, 2021 average = 100.
The Ministry of Finance splits export values into price (unit value) and volume. For machinery and electrical equipment, which is 86% of Taiwan's exports, volume in September 2026 was 160.1% above its 2021 average while prices were up 41.7%. Taiwan is shipping far more units, not just charging more for them. That is the main difference from Korea, where rising memory prices are a large part of the 2026 surge, and it makes Taiwan's boom less exposed to a price reversal. The past year is the exception: prices rose faster than volumes (see the Q3 section).
7. Q3 2026 scorecard: exports by product and destination
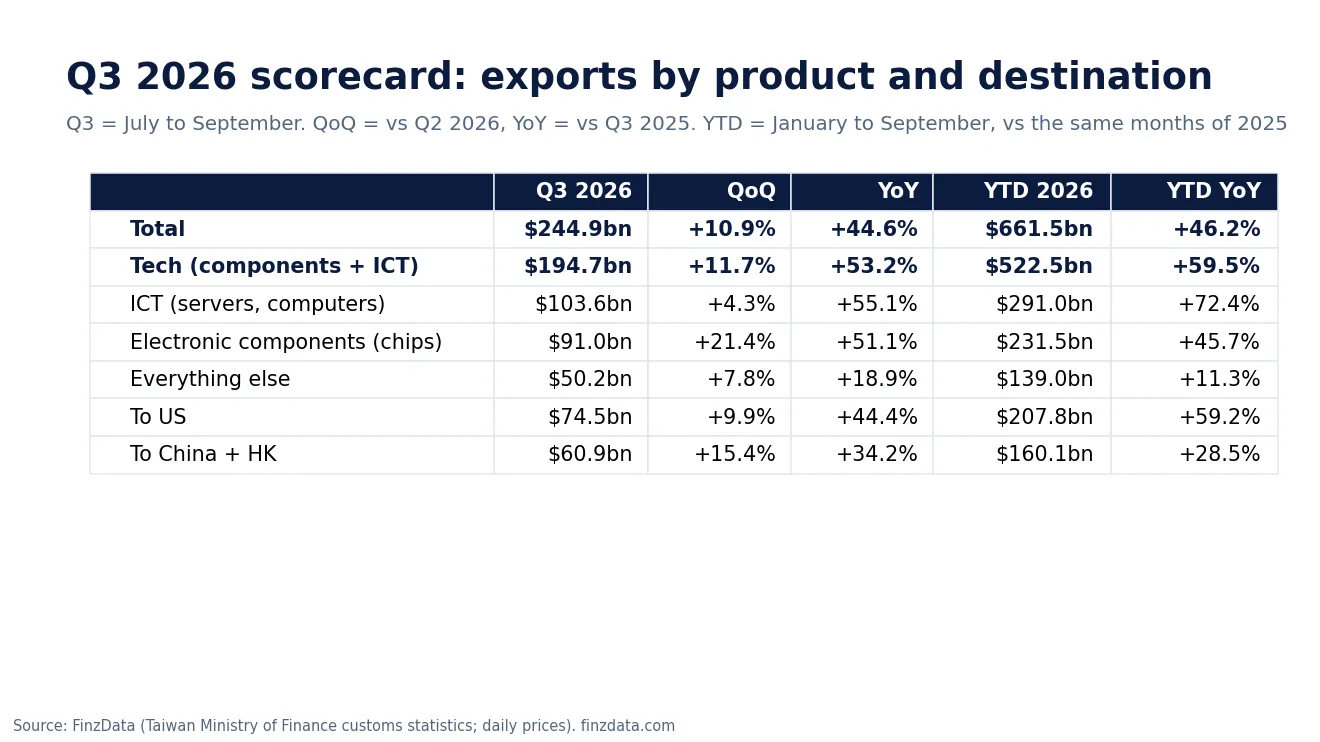
Q3 2026 exports against Q2 2026 (QoQ) and Q3 2025 (YoY); January-September against the same months of 2025 (YTD).
Taiwan exported $244.9 billion in the third quarter of 2026, up 10.9% on the second quarter and 44.6% on a year earlier. Technology (electronic components plus ICT products) was $194.7 billion, +11.7% QoQ and +53.2% YoY.
Within that, the quarter's sequential growth came from chips: electronic components rose 21.4% on Q2 while ICT products (servers and computers) rose 4.3%. Over nine months the picture is reversed: ICT is up 72.4% year to date against 45.7% for components. Everything outside technology grew 18.9% YoY in Q3, a healthy rate that would be a boom in most economies.
By destination, exports to the US were $74.5 billion in Q3 (+44.4% YoY, +59.2% YTD) and to mainland China and Hong Kong $60.9 billion (+34.2% YoY, +28.5% YTD).
8. Month over month: servers surged, chips paused
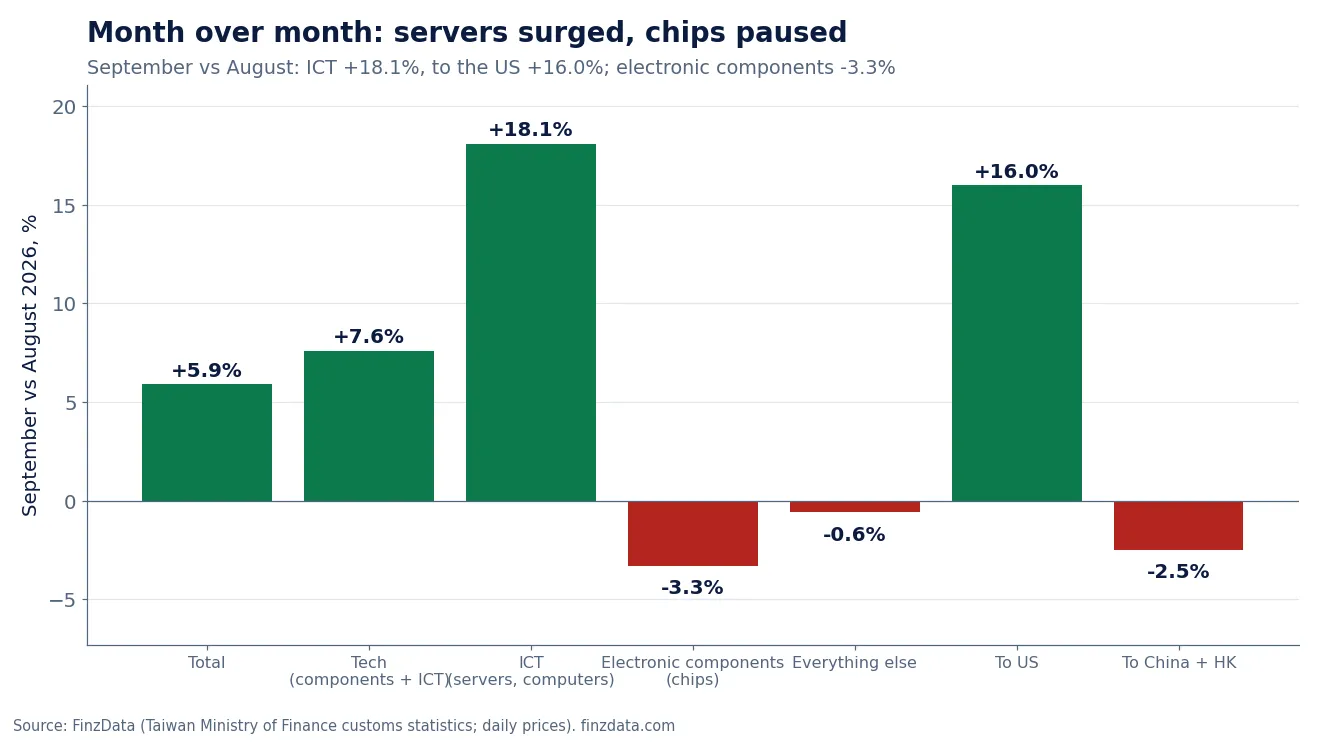
September 2026 exports against August 2026, by product and destination.
September total exports were $87.22 billion, +5.9% on August. ICT products jumped +18.1% in one month and exports to the US +16.0%, while electronic components slipped -3.3% and exports to China and Hong Kong -2.5%. Monthly moves are noisy (working days, shipment timing), so one month is a hint rather than a trend, but the end of the quarter tilted toward servers bound for American data centres.
9. Growth is still enormous, but it peaked in Q4 2025
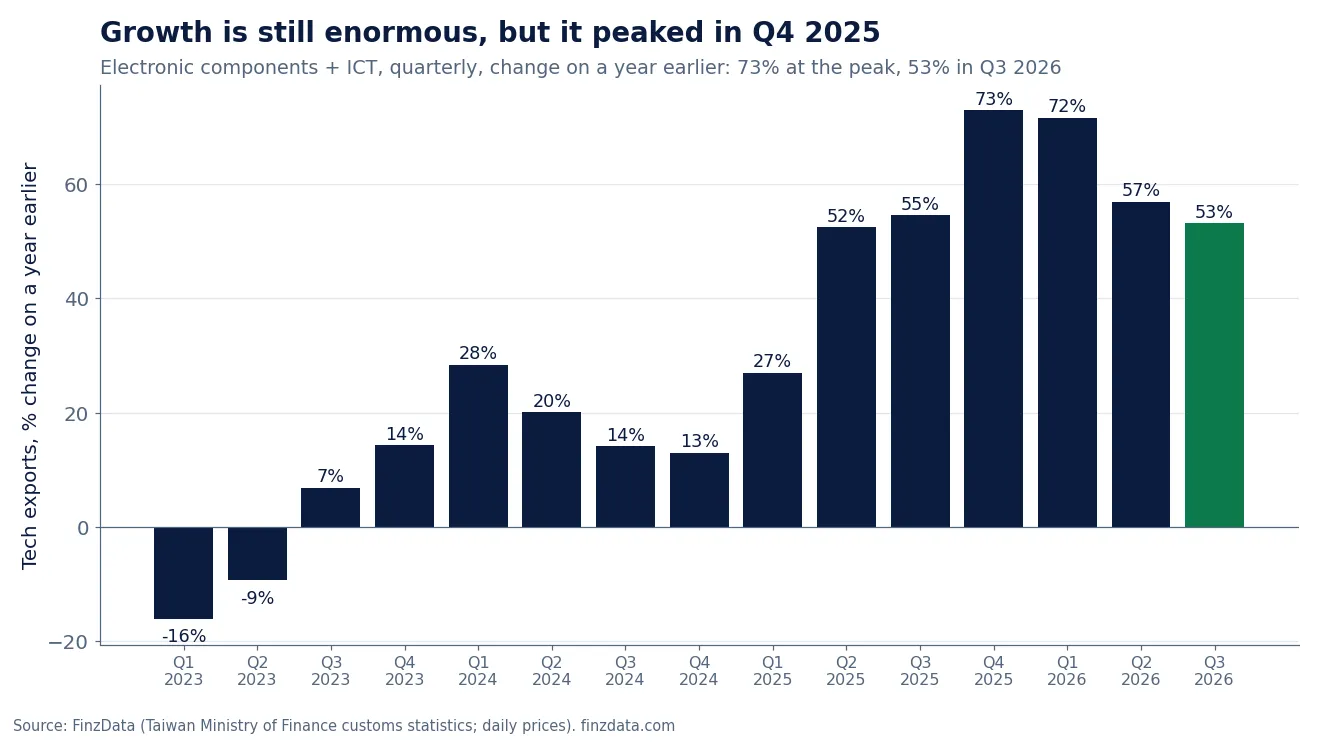
Electronic components + ICT exports, quarterly, change on a year earlier.
Technology export growth went from -16% in Q1 2023 to a peak of 72.9% in Q4 2025, then 71.6% in Q1 2026, 56.9% in Q2 and 53.2% in Q3. Part of the slowdown is arithmetic: each quarter is now compared with a year that was already booming. Growth above 50% on that base is still extraordinary, but the direction matters for earnings surprises, which come from the change in growth, not its level.
10. Over the past year, prices did more of the work
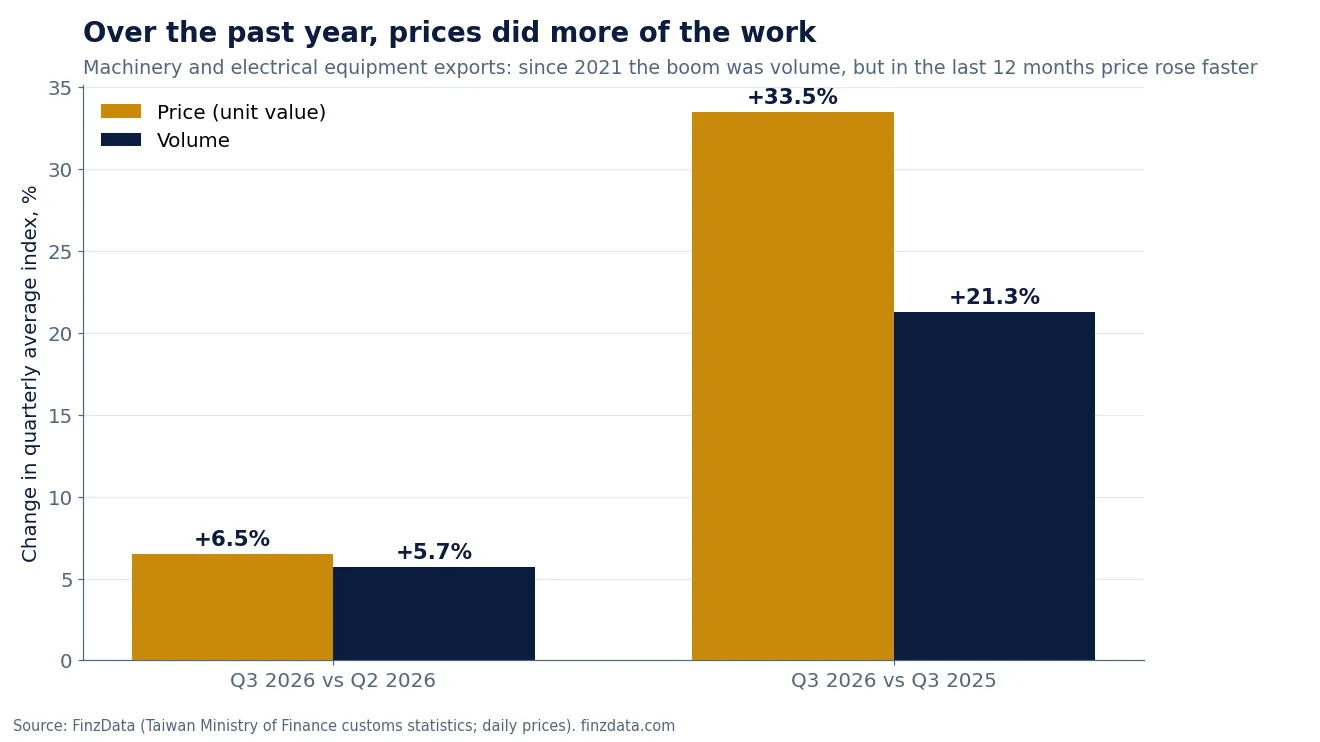
Machinery and electrical equipment exports: quarterly average price and volume indices.
Since 2021 Taiwan's boom has been mostly volume. The last year is different: comparing Q3 2026 with Q3 2025, the unit-value (price) index for machinery and electrical equipment rose 33.5% while volume rose 21.3%. Quarter on quarter both rose about equally (price +6.5%, volume +5.7%). Higher prices reflect a richer mix (advanced-node chips, AI servers that cost far more per unit) as well as pricing power. For earnings that is good news while it lasts, and the thing to watch: if unit values stop rising, revenue growth falls back to volume growth.
11. What Q3 exports say about earnings
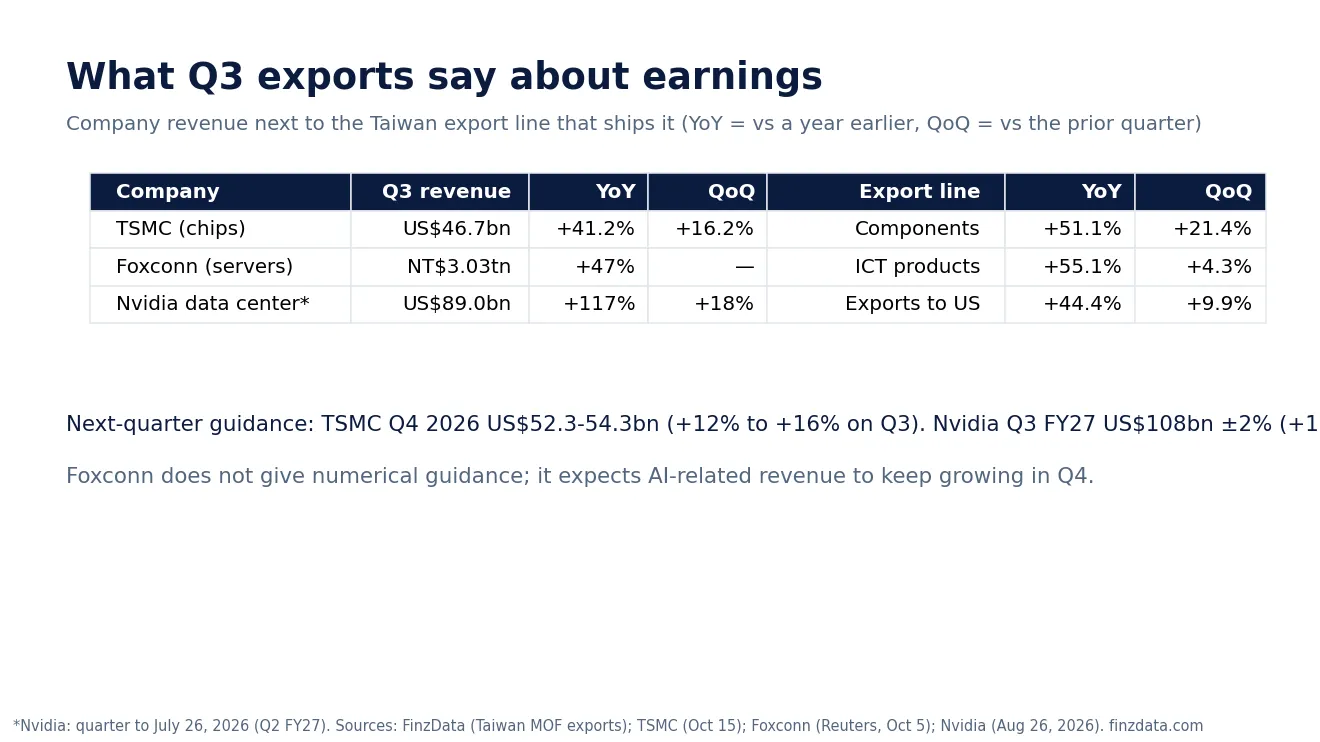
Company revenue next to the Taiwan export line that ships it.
Taiwan's export lines track the companies that ship them. TSMC's Q3 2026 revenue was US$46.72 billion, up 41.2% YoY and 16.2% QoQ in dollars, with a 66.4% gross margin and record net income of NT$763.06 billion (+68.7%); electronic components exports rose 51.1% YoY and 21.4% QoQ. Foxconn's Q3 revenue was a record NT$3.03 trillion, up 47%, with September above NT$1 trillion for the first time; ICT exports rose 55.1% YoY. Nvidia's data center revenue was US$89.0 billion in the quarter to July 26, up 117%, and it guided US$108 billion (±2%) for the following quarter, assuming no data-center compute revenue from China.
The export data and these results come out within weeks of each other, so exports work best as a cross-check: they show whether reported growth is broad (many shippers) or narrow.
12. Implications for earnings
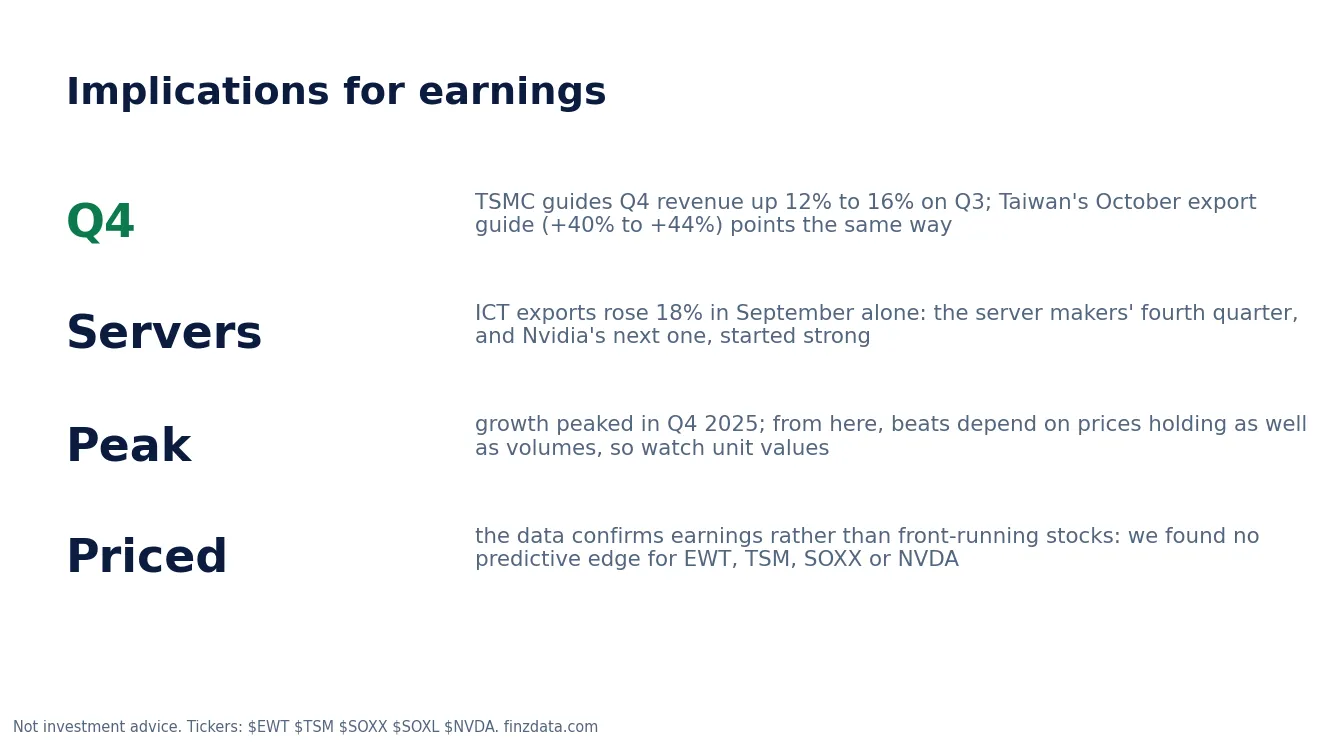
What the Q3 export data implies for the next reporting season.
Q4 starts strong. TSMC guided Q4 2026 revenue to US$52.3-54.3 billion, 12% to 16% above Q3, and the Ministry of Finance expects October exports of US$85.2-87.7 billion, up 40% to 44%. Servers lead. ICT exports rose 18% in September alone, which supports the server makers' fourth quarter and Nvidia's next report. Growth has peaked. From here, earnings beats depend on prices holding as well as volumes, so watch the unit-value index each month. It is already in the price. Our test found no predictive edge from export data for EWT, TSM, SOXX or NVDA once the figures are published; use it to judge the quality of reported growth, not to time trades.
13. One company is 44% of Taiwan's stock market
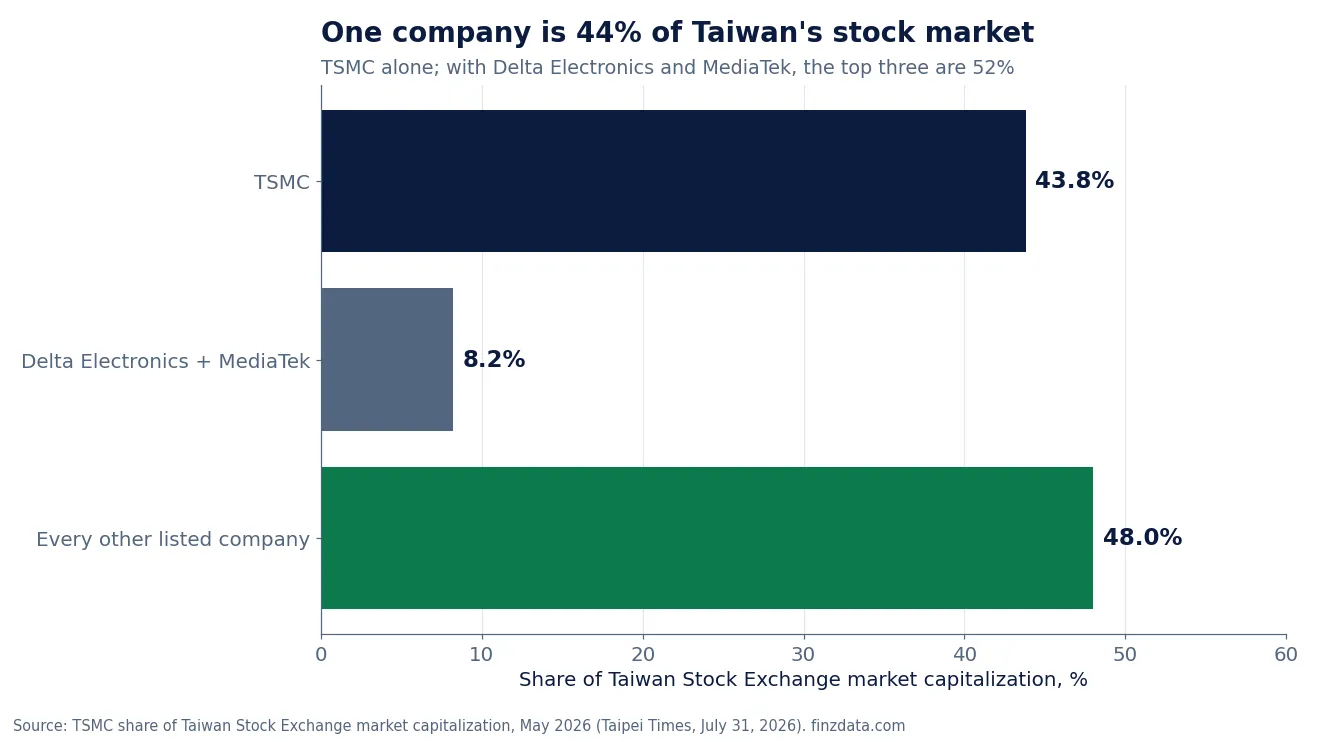
Share of Taiwan Stock Exchange market capitalization, May 2026.
TSMC alone was 43.8% of the Taiwan Stock Exchange's market capitalization in May 2026, and with Delta Electronics and MediaTek the top three were 52% (Taipei Times, July 31, 2026). Taiwan's market reached $5.22 trillion in late June. Like Korea, buying Taiwan means buying a concentrated bet on AI hardware.
14. Tech exports and Taiwanese stocks move together
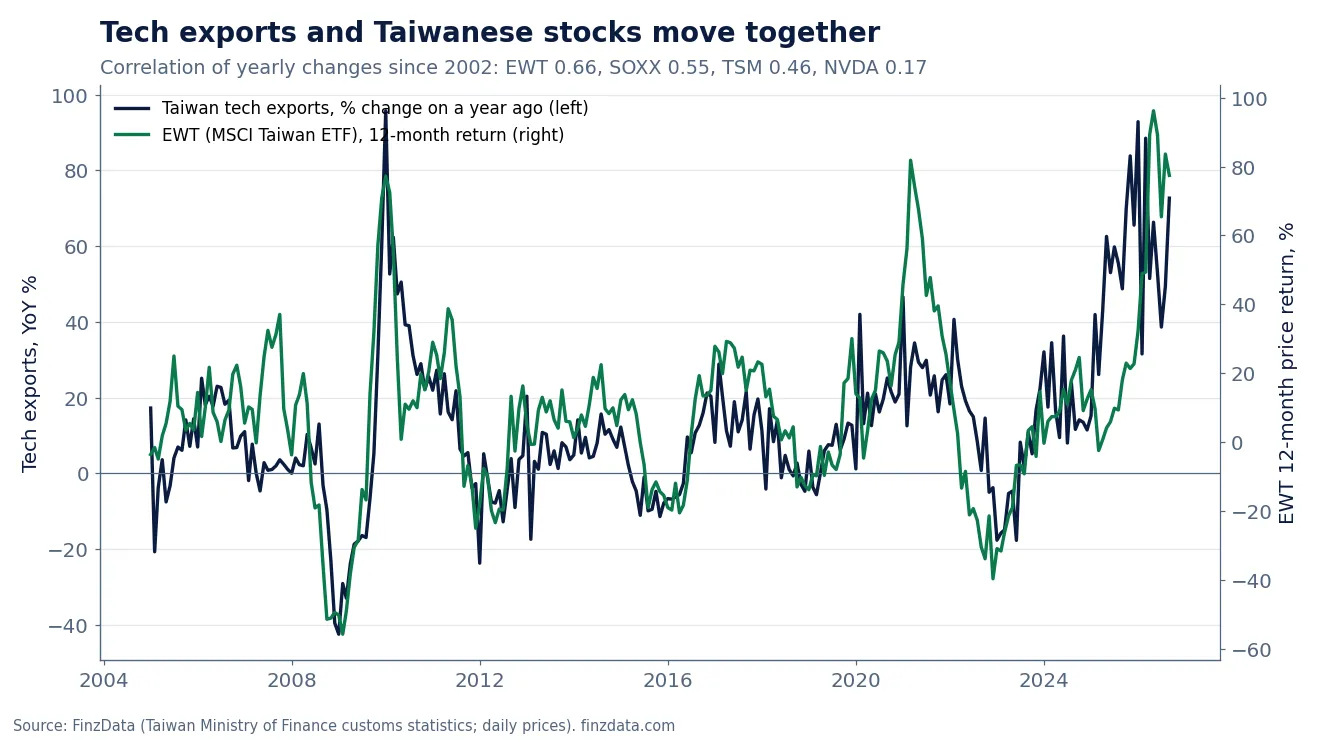
Taiwan tech exports, change on a year earlier, against EWT's 12-month price return, monthly.
Since 2002 the yearly change in Taiwan's technology exports has a correlation of 0.66 with EWT's 12-month return over 297 months, 0.55 with SOXX, 0.46 with TSM and 0.17 with NVDA.
15. And, like Korea's, they do not predict returns
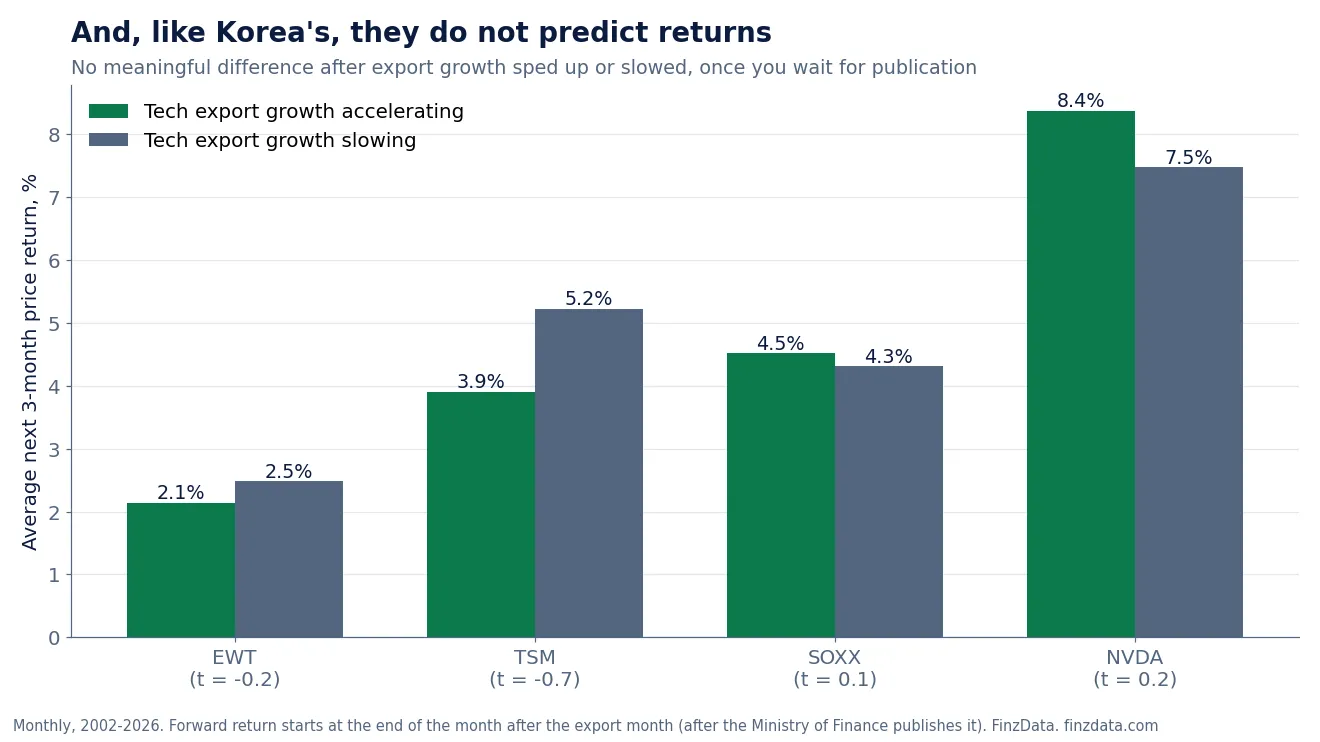
Average next 3-month return after tech export growth accelerated or slowed, 2002-2026, measured after publication.
We ran the same test as for Korea: does acceleration in export growth, once published, predict the next three months? It does not. EWT averaged 2.14% after acceleration and 2.48% after slowing (t = -0.23); TSM 3.9% vs 5.22%; SOXX 4.51% vs 4.31%; NVDA 8.36% vs 7.47%. None is close to significant, even before correcting for overlapping windows. The export data describes the AI cycle very well; it does not time it.
16. Korea sells the memory, Taiwan sells the logic and the servers
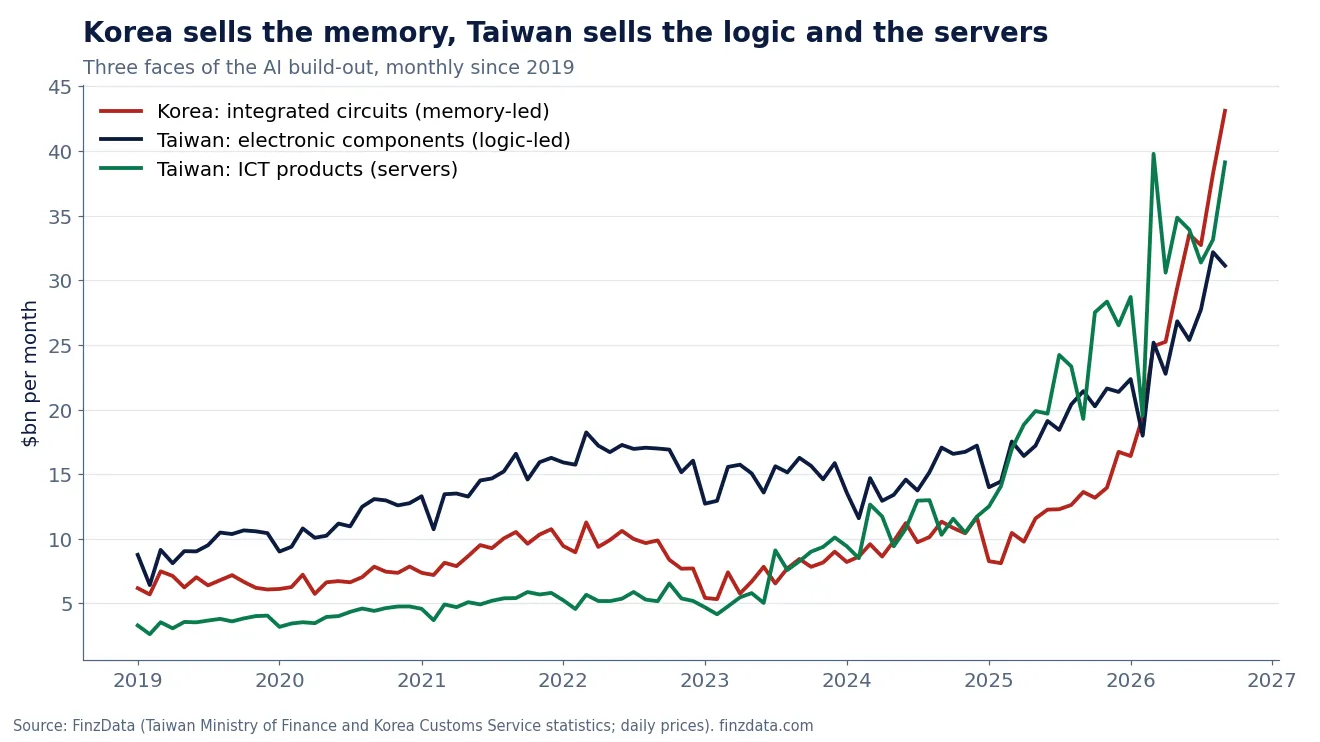
Korea integrated circuits vs Taiwan electronic components and ICT products, monthly since 2019.
Put the two papers together and the AI supply chain shows up in trade data: Korea's integrated-circuit exports (memory-led, price-driven), Taiwan's electronic components (logic-led) and Taiwan's ICT products (servers). All three have broken records in 2026. Watching them side by side shows which link of the chain is driving the cycle at any time.
17. The data behind this deck
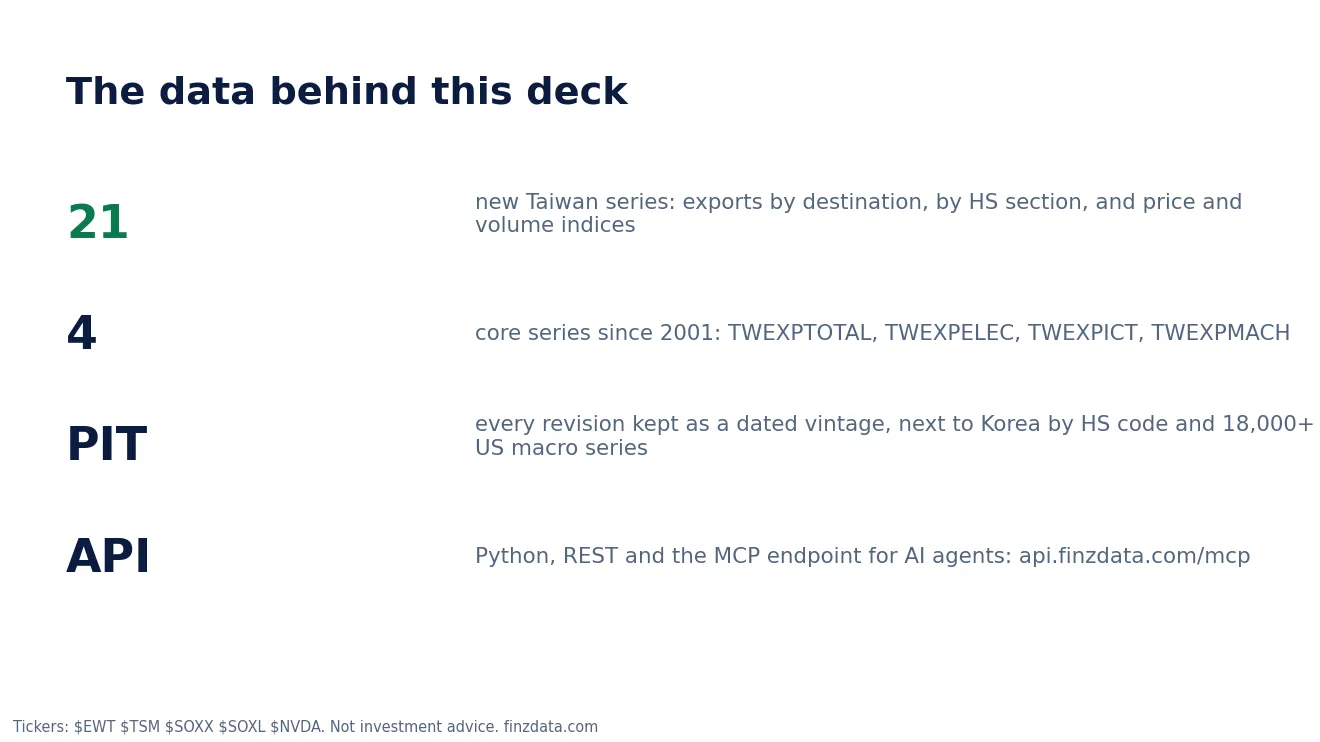
Every chart in this paper comes from the FinzData store.
New in FinzData: 21 Taiwan series from the Ministry of Finance. By destination: TWEXPUS, TWEXPCN, TWEXPHK, TWEXPJP, TWEXPKR, TWEXPSG, TWEXPVN, TWEXPMY, TWEXPMX, TWEXPEUR, TWEXPASIA. By HS section: TWEXPHS16 (machinery and electrical equipment), TWEXPHS18, TWEXPHS15, TWEXPHS6, TWEXPHS7, TWEXPHS17. Price and volume: TWEXPUVI, TWEXPUVI16, TWEXPVOL, TWEXPVOL16. They join TWEXPTOTAL, TWEXPELEC, TWEXPICT and TWEXPMACH, all monthly since 2001 (indices since 2011), with every revision kept as a dated vintage, through Python, REST and MCP.
Frequently asked questions
How dependent is Taiwan on exports?
Taiwan exported a record $640.75 billion in 2025, about 70% of GDP, and electronic components plus ICT products were 74.0% of those exports.
Is the US or China Taiwan's biggest export market?
The US: 31.4% of Taiwan's exports in 2026 so far, against 24.2% for mainland China and Hong Kong combined. In 2010 it was 11.4% vs 41.9%.
Is Taiwan's export boom about prices or volumes?
Mostly volume: machinery and electrical equipment export volume was 160.1% above its 2021 average in September 2026, prices 41.7%.
Where can I get Taiwan's exports by destination and product?
FinzData publishes 25 Taiwan Ministry of Finance export series monthly since 2001, by destination, by product and HS section, plus price and volume indices, with every revision kept, through Python, REST and MCP.
Download the deck (PDF, 17 slides) More research
Built for AI, quants, data scientists and financial analysts who backtest. Clean data. Real insights. Real alpha. finzdata.com. This material is for information only and is not investment advice. Data sources: FinzData store: Taiwan Ministry of Finance customs statistics (exports by main commodity, destination and HS section; export unit-value and volume indices), 2001-2026; daily prices for EWT, TSM, SOXX, SOXL, NVDA through 2026-10-16; Korea Customs Service exports by HS code. Ministry of Finance September 2026 release (Focus Taiwan, October 8, 2026). TSMC weight: Taipei Times, July 31, 2026. GDP: IMF estimate via Wikipedia, Economy of Taiwan.
Get FinzData research free, every morning
The daily brief: what moved, the macro releases that matter, positioning and liquidity, with charts. One email a day, free, unsubscribe anytime.
Topics and related searches
Semiconductors and AI supply chain Exports and global trade Asian economies and markets AI infrastructure and data-center capex Equity strategy and factors
People also search
- will taiwan exports continue growing in 2027
- why did taiwan exports hit record in september 2026
- how much of taiwan gdp is exports
- is taiwan export boom driven by volume or price
- does the us now buy more than china from taiwan
- when did servers overtake chips as taiwan top export
- where can i download taiwan ministry of finance export data
- what was taiwan export value in september 2026
- which taiwan stocks benefit from ai export growth
- are taiwan exports still growing in q3 2026
- taiwan exports to us vs china 2026
- taiwan semiconductor export data by month