
FinzData Weekly: Liquidity, Capital Flows & Positioning, October 3, 2026
Liquidity, capital flows and positioning for the week to October 3, 2026, built from the FinzData database. Data, not investment advice.
This week in five lines
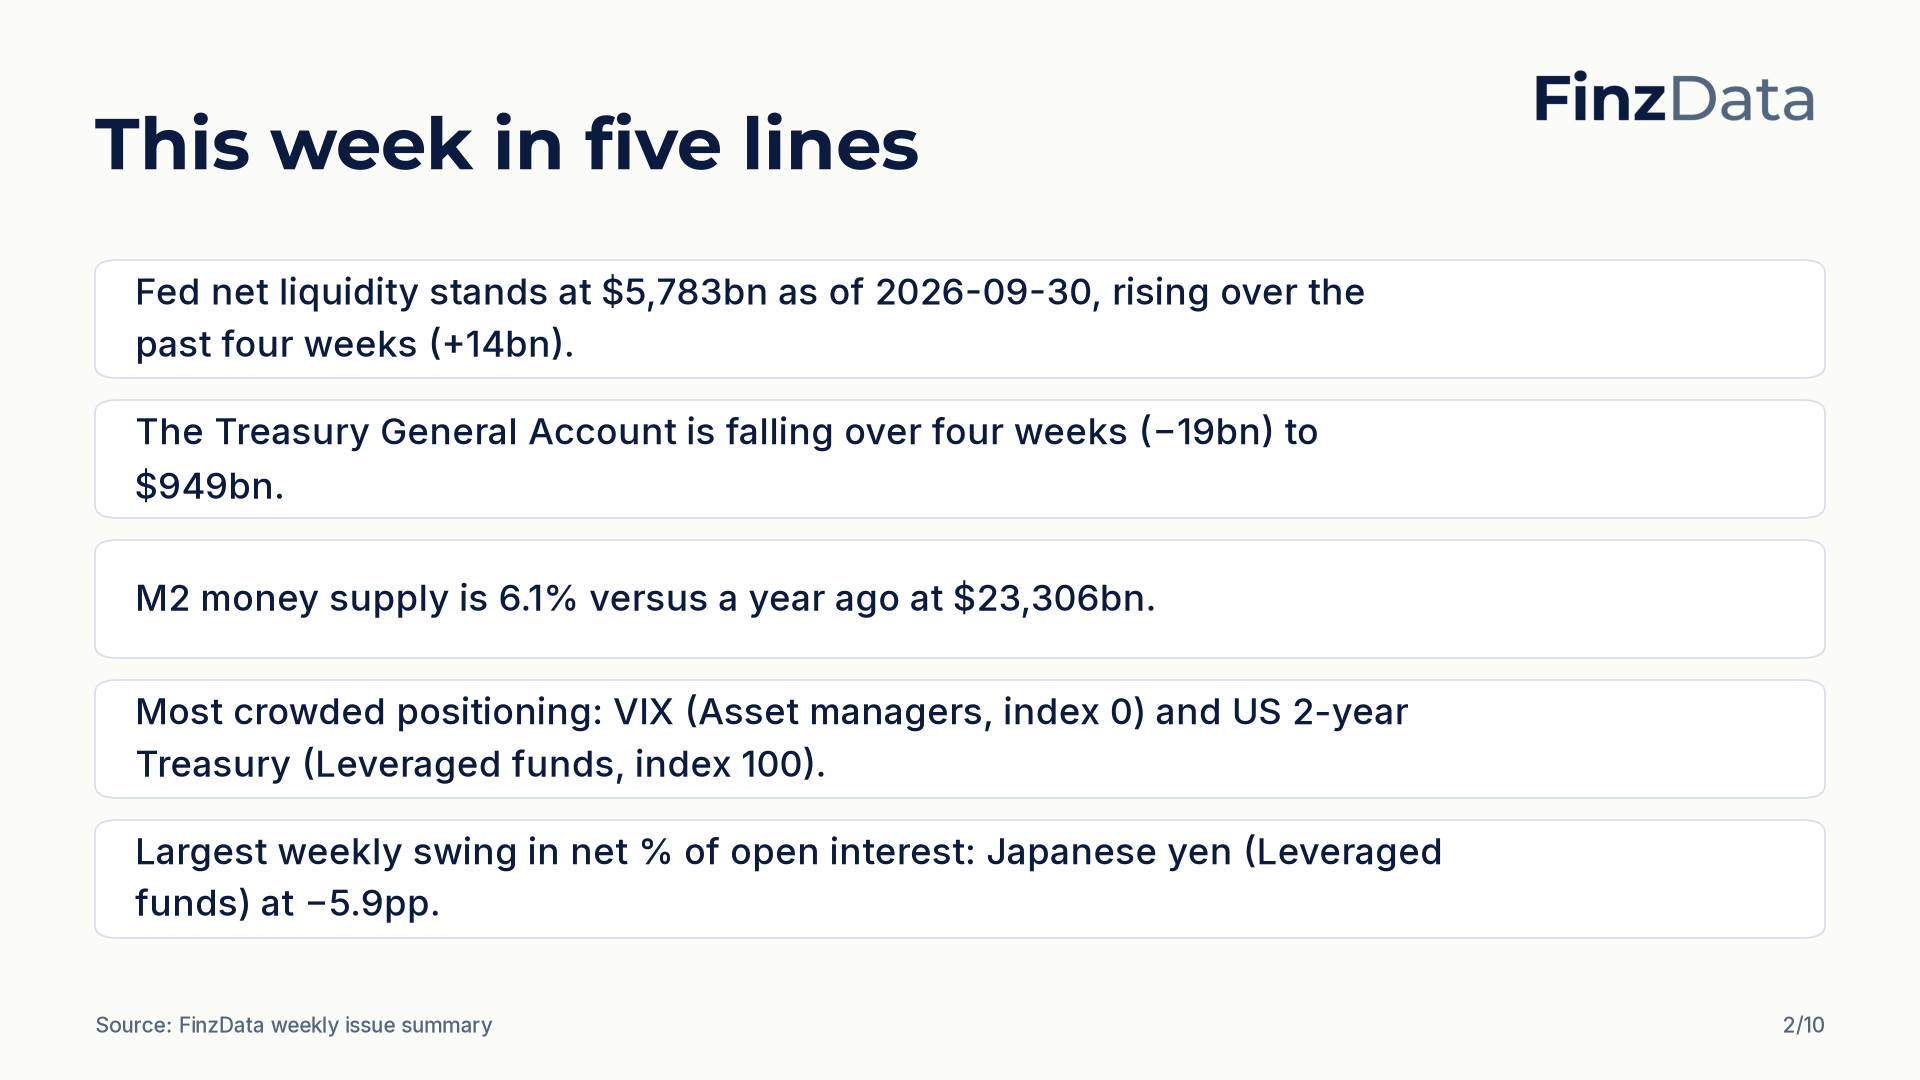
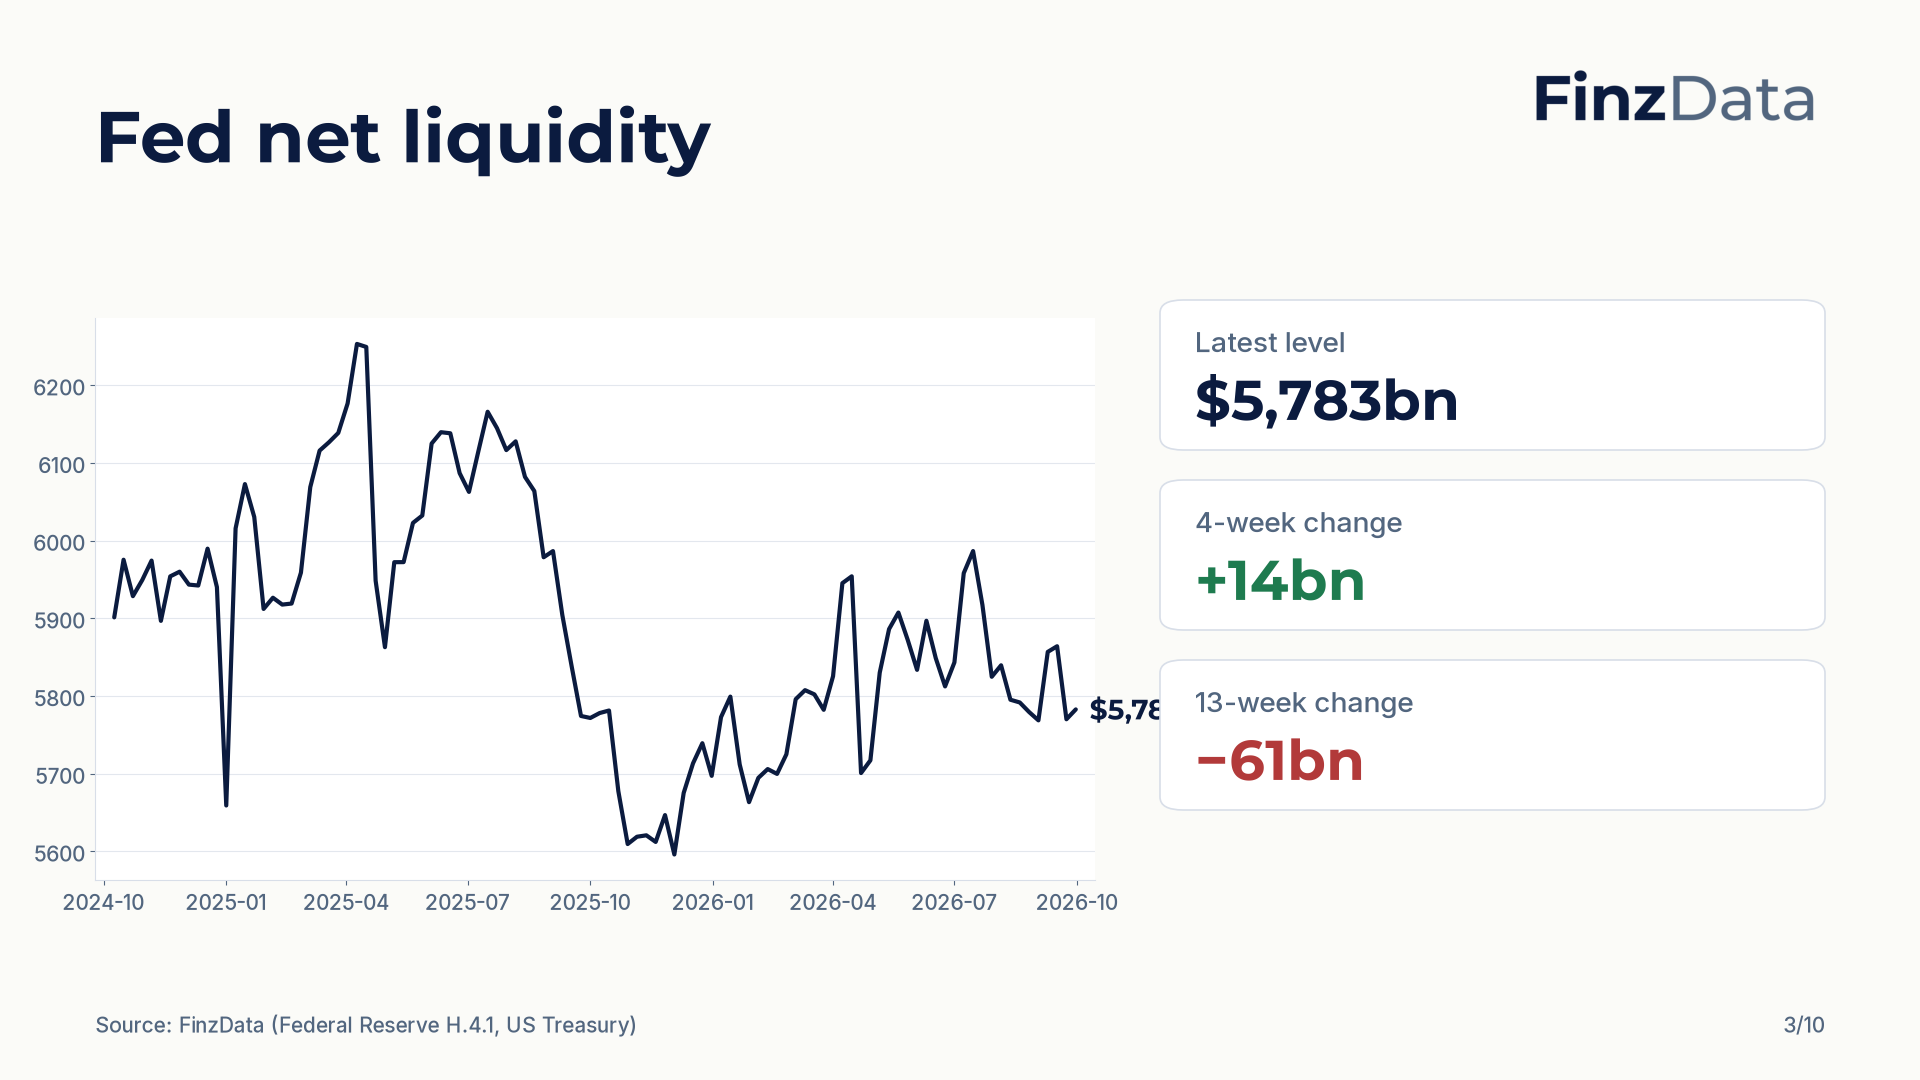
- Fed net liquidity stands at $5,783bn as of 2026-09-30, rising over the past four weeks (+14bn).
- The Treasury General Account is falling over four weeks (−19bn) to $949bn.
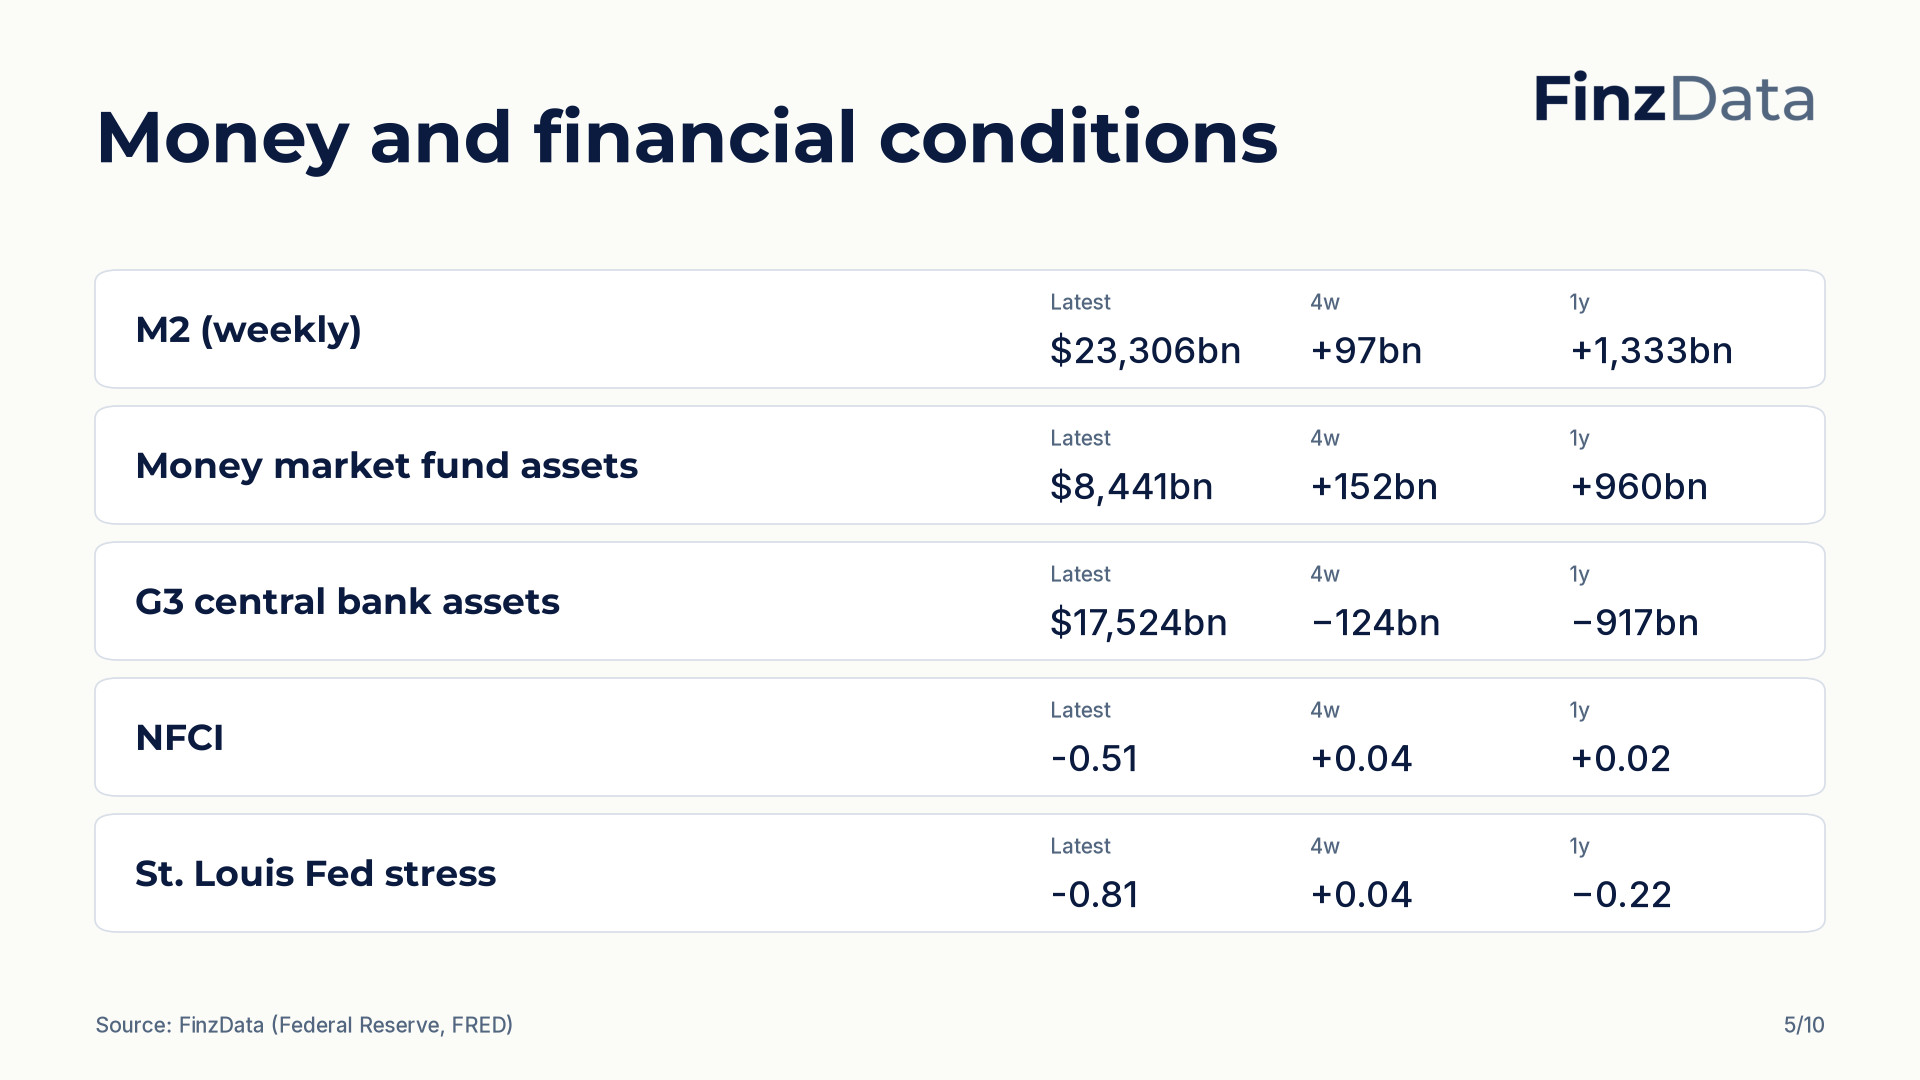
- M2 money supply is 6.1% versus a year ago at $23,306bn.
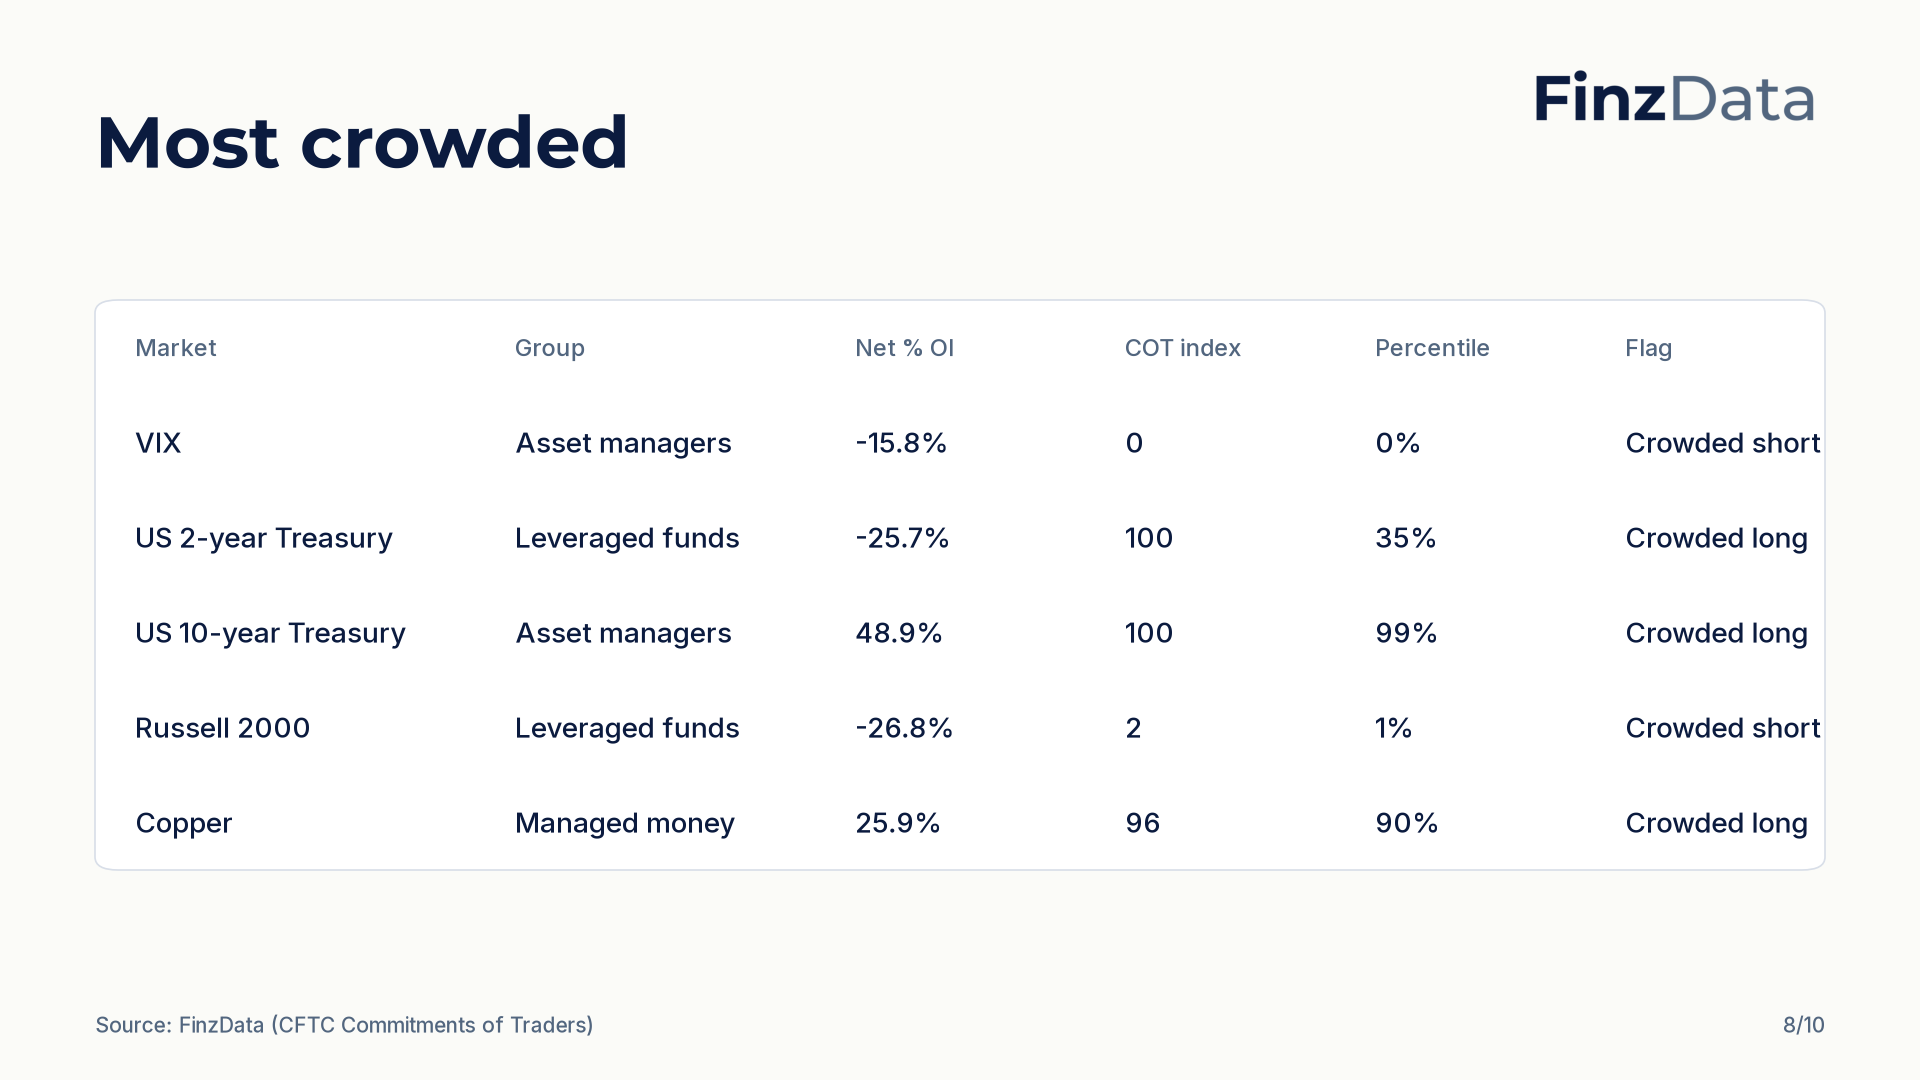
- Most crowded positioning: VIX (Asset managers, index 0) and US 2-year Treasury (Leveraged funds, index 100).
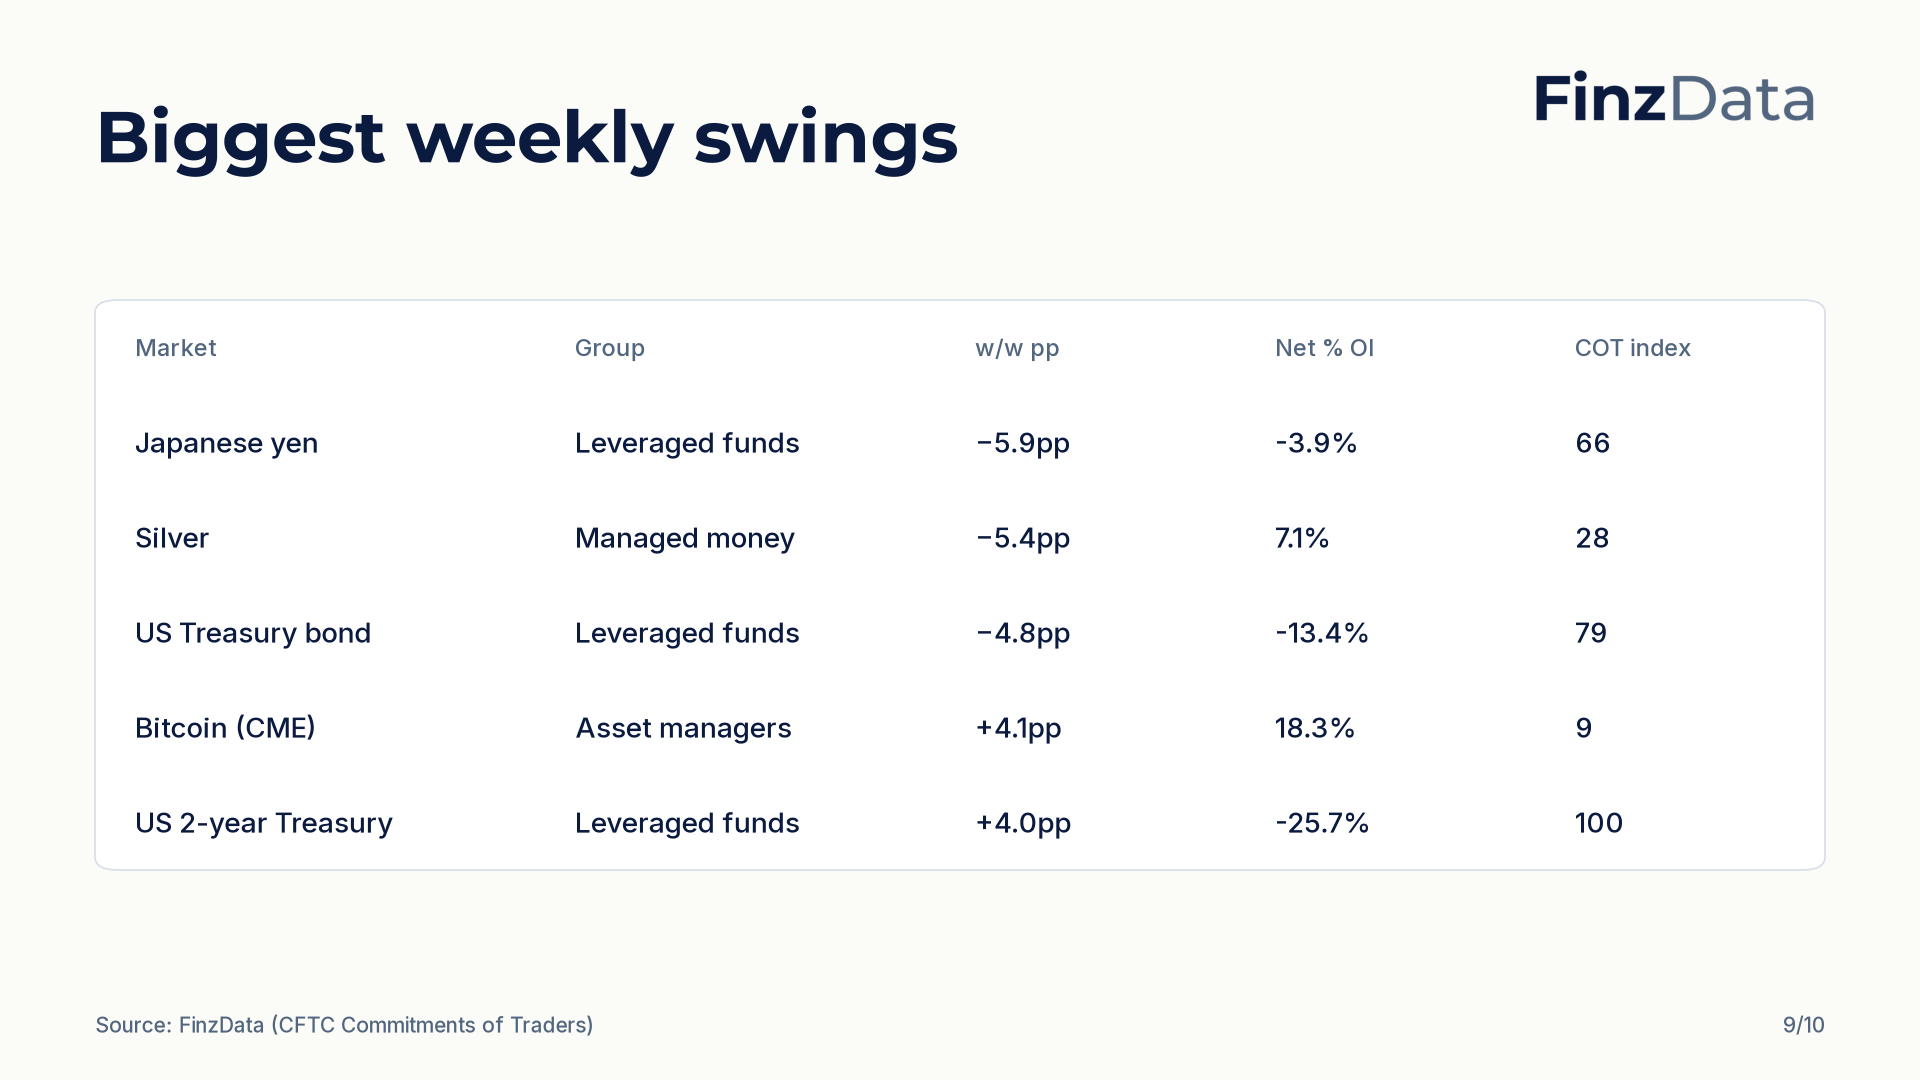
- Largest weekly swing in net % of open interest: Japanese yen (Leveraged funds) at −5.9pp.
Liquidity
| Series | Latest | As of | 1w | 4w | 13w | 1y |
|---|---|---|---|---|---|---|
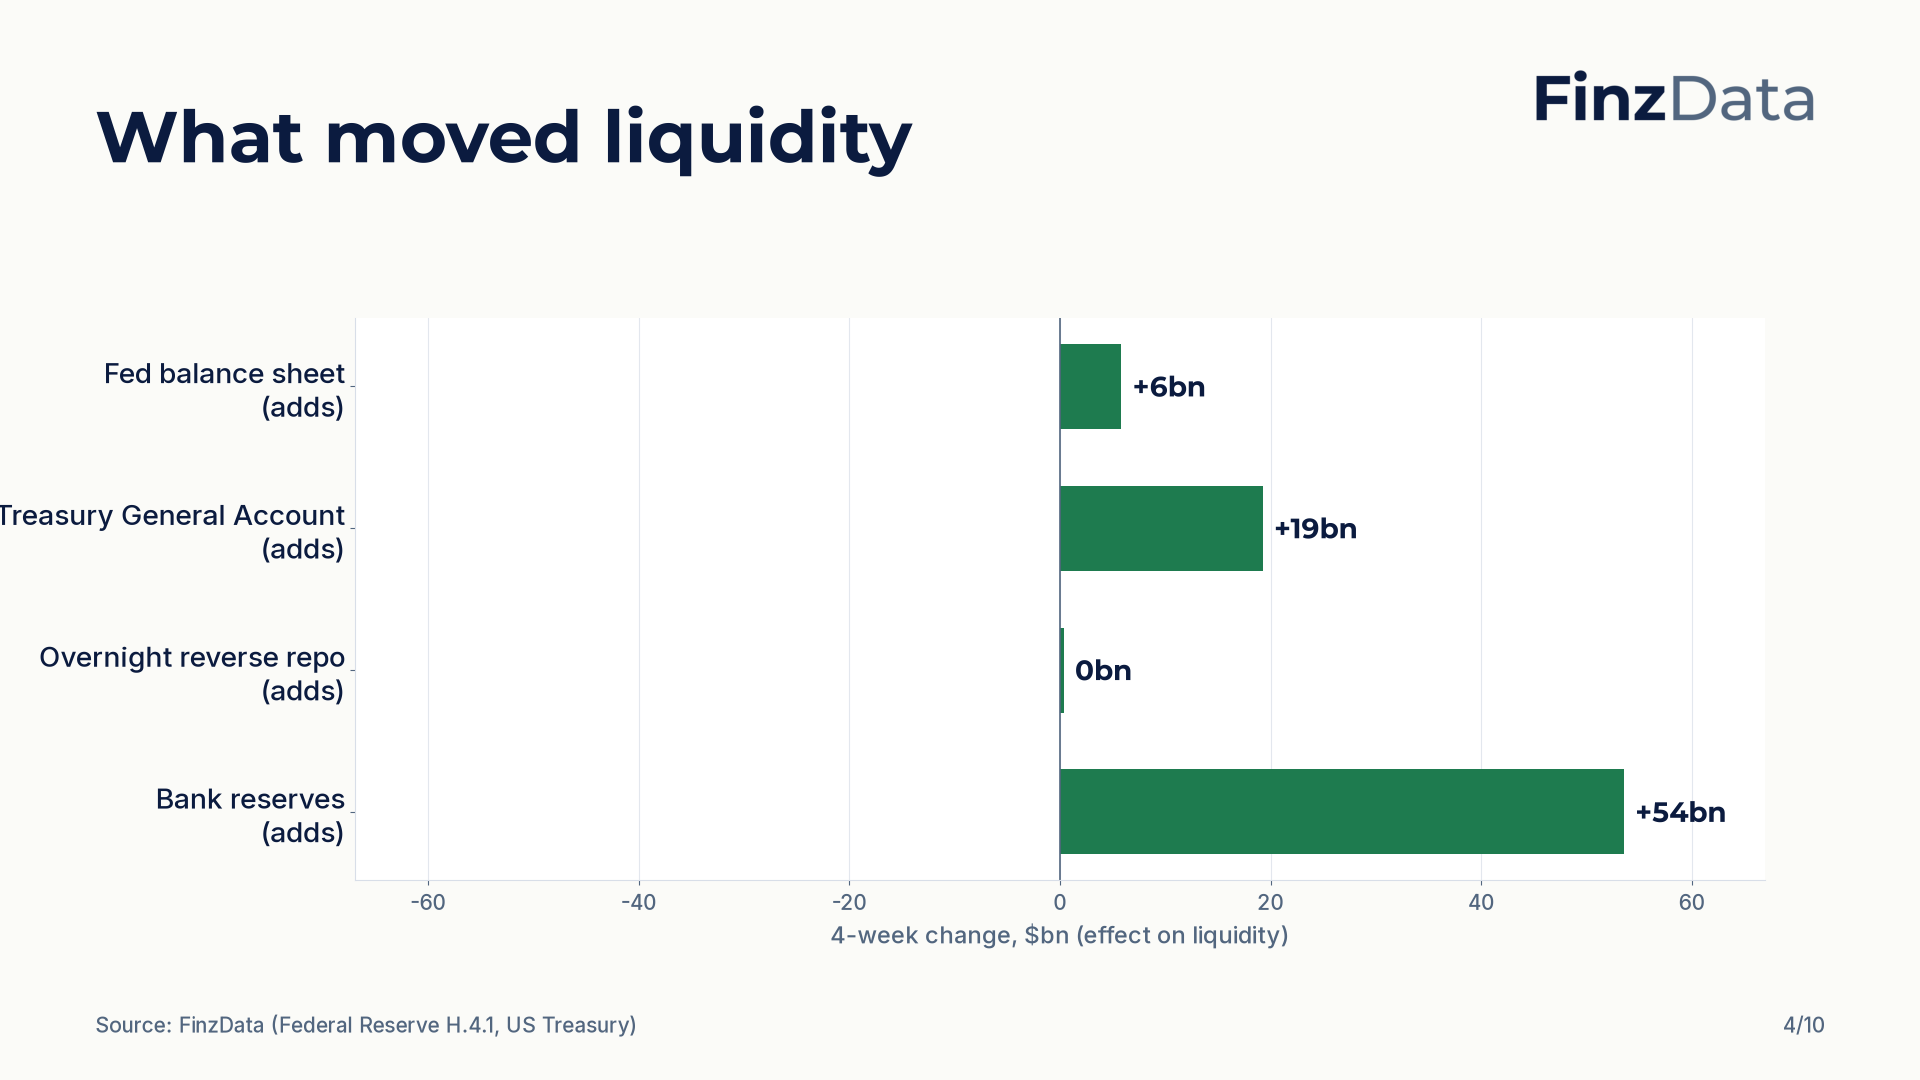
| Fed net liquidity (assets − TGA − reverse repo) | $5,783bn | 2026-09-30 | +13bn | +14bn | −61bn | +8bn |
| Fed balance sheet | $6,743bn | 2026-09-30 | −5bn | +6bn | +18bn | +135bn |
| Treasury General Account | $949bn | 2026-09-30 | −28bn | −19bn | +68bn | +144bn |
| Overnight reverse repo | $0bn | 2026-10-01 | 0bn | 0bn | −2bn | −10bn |
| Bank reserves | $2,948bn | 2026-09-30 | +18bn | +54bn | −19bn | −54bn |
| M2 money supply (weekly) | $23,306bn | 2026-08-31 | +38bn | +97bn | +283bn | +1,333bn |
| Money market fund assets | $8,441bn | 2026-04-01 | +152bn | +152bn | +251bn | +960bn |
| G3 central bank assets (USD) | $17,524bn | 2026-09-01 | −124bn | −124bn | −235bn | −917bn |
| Chicago Fed financial conditions (NFCI) | -0.51 | 2026-09-25 | +0.01 | +0.04 | +0.00 | +0.02 |
| St. Louis Fed financial stress | -0.81 | 2026-09-25 | −0.11 | +0.04 | −0.17 | −0.22 |
Fed net liquidity stands at $5,783bn as of 2026-09-30, rising over the past four weeks (+14bn). The Treasury General Account is falling over four weeks (−19bn) to $949bn, while M2 money supply is 6.1% versus a year ago at $23,306bn.
Capital flows (TIC)
| Series | Latest month | Value | Prior month | 12-month total / change |
|---|---|---|---|---|
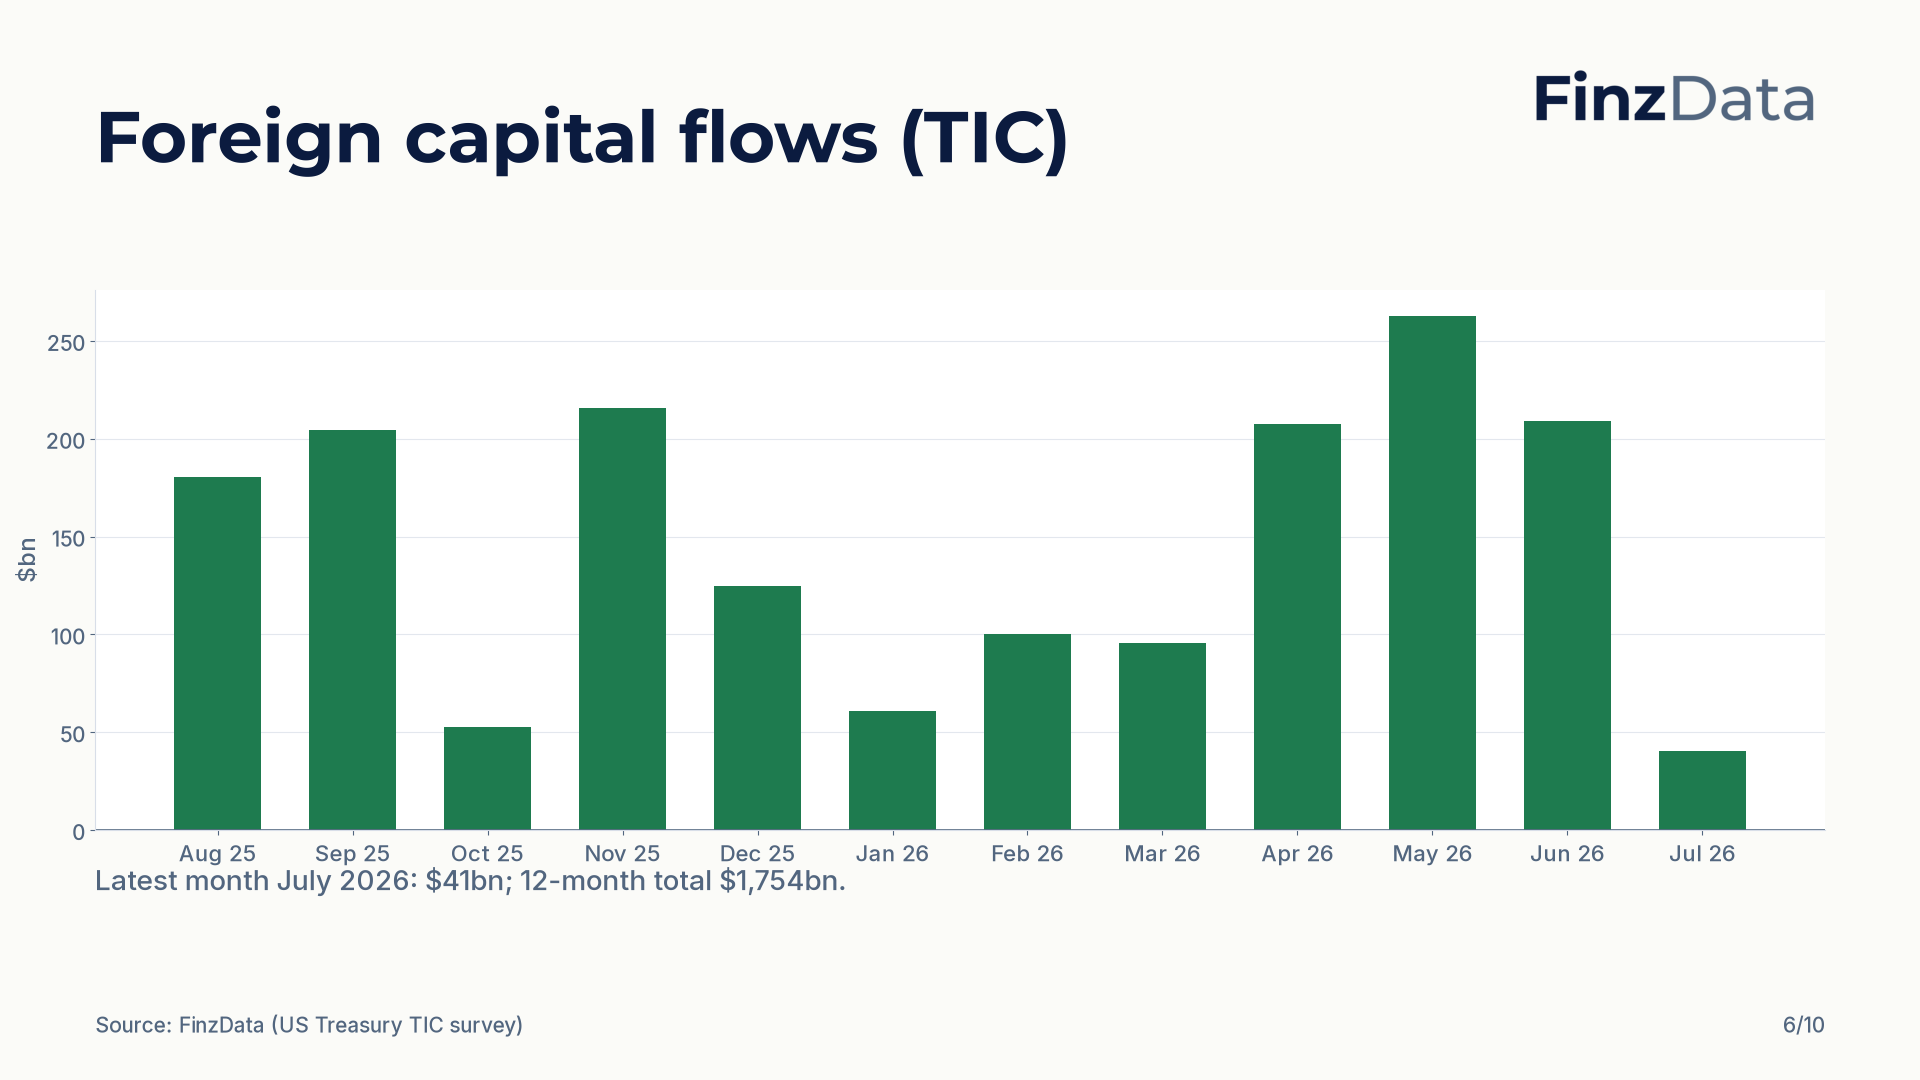
| Net foreign purchases of US long-term securities | 2026-07-01 | $41bn | $209bn | +1,754bn (12m total) |
| Net foreign purchases of US Treasuries | 2026-07-01 | −$4bn | $6bn | +247bn (12m total) |
| Foreign official net purchases of Treasuries | 2026-07-01 | $26bn | −$10bn | −17bn (12m total) |
| Foreign holdings of US Treasuries | 2026-07-01 | $38,821bn | $39,195bn | +4,862bn (12m change) |
Net foreign purchases of US long-term securities were $40.616bn in July 2026, down from $208.899bn in the prior month. Net foreign purchases of US Treasuries were -$3.56bn, while foreign official net purchases of Treasuries were $25.537bn.
Positioning (CFTC Commitments of Traders)
TFF report (financial futures)
| Market | Group | Net contracts | Net % OI | w/w pp | COT index | Percentile | Flag |
|---|---|---|---|---|---|---|---|
| S&P 500 | Asset managers | 906,259 | 47.4% | −1.8pp | 60 | 95% | |
| S&P 500 | Leveraged funds | -374,007 | -19.6% | +0.1pp | 44 | 6% | |
| Nasdaq-100 | Asset managers | 70,801 | 24.9% | +0.4pp | 56 | 67% | |
| Nasdaq-100 | Leveraged funds | -33,782 | -11.9% | +0.1pp | 57 | 24% | |
| Russell 2000 | Asset managers | 39,768 | 9.3% | +1.3pp | 31 | 62% | |
| Russell 2000 | Leveraged funds | -114,554 | -26.8% | −0.7pp | 2 | 1% | Crowded short |
| VIX | Asset managers | -66,500 | -15.8% | −2.4pp | 0 | 0% | Crowded short |
| VIX | Leveraged funds | -7,467 | -1.8% | +1.9pp | 85 | 90% | |
| US 2-year Treasury | Asset managers | 1,638,478 | 36.2% | −2.8pp | 35 | 84% | |
| US 2-year Treasury | Leveraged funds | -1,165,980 | -25.7% | +4.0pp | 100 | 35% | Crowded long |
| US 10-year Treasury | Asset managers | 2,776,531 | 48.9% | +2.1pp | 100 | 99% | Crowded long |
| US 10-year Treasury | Leveraged funds | -2,036,432 | -35.9% | −0.2pp | 34 | 10% | |
| US Treasury bond | Asset managers | 436,956 | 23.3% | +1.3pp | 23 | 45% | |
| US Treasury bond | Leveraged funds | -251,395 | -13.4% | −4.8pp | 79 | 46% | |
| SOFR 3-month | Asset managers | -574,587 | -4.6% | +1.0pp | 20 | 17% | |
| SOFR 3-month | Leveraged funds | -2,410,343 | -19.4% | +0.6pp | 12 | 4% | |
| Euro | Asset managers | 220,603 | 25.8% | −0.5pp | 27 | 53% | |
| Euro | Leveraged funds | -39,265 | -4.6% | −1.3pp | 21 | 50% | |
| Japanese yen | Asset managers | 51,634 | 14.3% | +3.3pp | 67 | 71% | |
| Japanese yen | Leveraged funds | -14,161 | -3.9% | −5.9pp | 66 | 67% | |
| British pound | Asset managers | -128,544 | -51.1% | −3.8pp | 15 | 0% | |
| British pound | Leveraged funds | 4,606 | 1.8% | −3.6pp | 18 | 40% | |
| Bitcoin (CME) | Asset managers | 3,586 | 18.3% | +4.1pp | 9 | 46% | Crowded short |
| Bitcoin (CME) | Leveraged funds | -6,856 | -35.0% | +0.7pp | 91 | 58% | Crowded long |
Disaggregated report (commodities)
| Market | Group | Net contracts | Net % OI | w/w pp | COT index | Percentile | Flag |
|---|---|---|---|---|---|---|---|
| WTI crude | Managed money | 79,592 | 4.2% | −1.3pp | 40 | 8% | |
| WTI crude | Producers/merchants | 319,539 | 17.0% | +0.6pp | 79 | 98% | |
| Natural gas (NYMEX) | Managed money | -132,799 | -7.5% | −3.9pp | 10 | 27% | |
| Natural gas (NYMEX) | Producers/merchants | -14,084 | -0.8% | +0.5pp | 73 | 80% | |
| Gold | Managed money | 120,318 | 29.6% | −1.3pp | 60 | 69% | |
| Gold | Producers/merchants | -21,263 | -5.2% | +1.3pp | 84 | 92% | |
| Silver | Managed money | 7,614 | 7.1% | −5.4pp | 28 | 28% | |
| Silver | Producers/merchants | -16,512 | -15.4% | +2.0pp | 87 | 84% | |
| Copper | Managed money | 78,058 | 25.9% | −1.4pp | 96 | 90% | Crowded long |
| Copper | Producers/merchants | -104,340 | -34.6% | +2.7pp | 10 | 20% | Crowded short |
| Corn | Managed money | 381,220 | 20.5% | −1.3pp | 96 | 88% | Crowded long |
| Corn | Producers/merchants | -732,985 | -39.5% | +2.2pp | 8 | 11% | Crowded short |
| Soybeans | Managed money | 246,558 | 22.6% | −1.2pp | 96 | 87% | Crowded long |
| Soybeans | Producers/merchants | -291,145 | -26.7% | +2.2pp | 13 | 45% |
Crowding and weekly swings
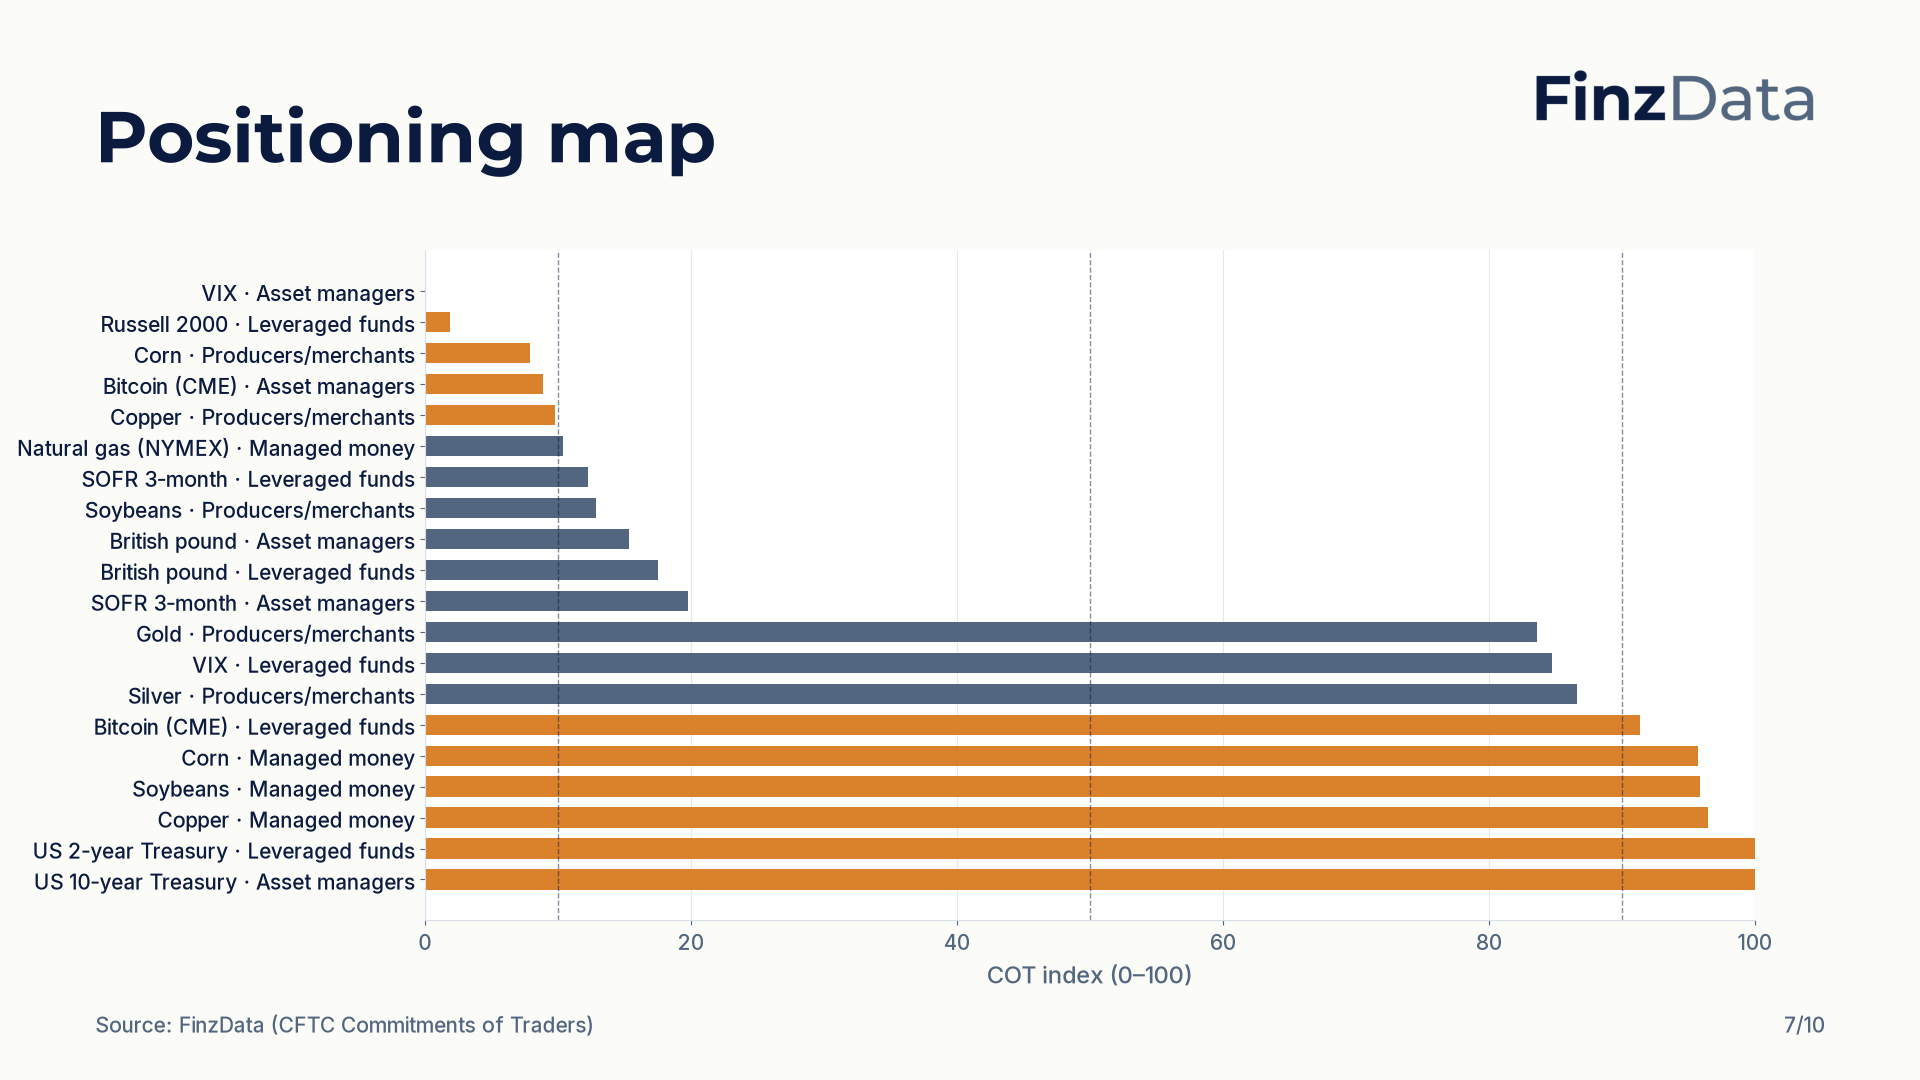
Most crowded (by |COT index − 50|)
- VIX (Asset managers): COT index 0, flag: Crowded short.
- US 2-year Treasury (Leveraged funds): COT index 100, flag: Crowded long.
- US 10-year Treasury (Asset managers): COT index 100, flag: Crowded long.
- Russell 2000 (Leveraged funds): COT index 2, flag: Crowded short.
- Copper (Managed money): COT index 96, flag: Crowded long.
Largest weekly swings (by |w/w pp|)
- Japanese yen (Leveraged funds): −5.9pp to -3.9% of open interest.
- Silver (Managed money): −5.4pp to 7.1% of open interest.
- US Treasury bond (Leveraged funds): −4.8pp to -13.4% of open interest.
- Bitcoin (CME) (Asset managers): +4.1pp to 18.3% of open interest.
- US 2-year Treasury (Leveraged funds): +4.0pp to -25.7% of open interest.
Most crowded positioning: VIX (Asset managers, index 0) and US 2-year Treasury (Leveraged funds, index 100). Largest weekly swing in net % of open interest: Japanese yen (Leveraged funds) at −5.9pp.
Method and sources
All figures are point-in-time for the issue date. COT positioning uses rows dated on or before issue date minus four days (Tuesday positions published the following Friday). Liquidity and TIC series use rows dated on or before issue date minus two days. This lets us rebuild past issues exactly as they would have appeared at the time.
- Liquidity and flows: latest observation, plus the change versus the last observation on or before 7, 28, 91 and 365 calendar days earlier. Monthly TIC flows also show the prior month and a trailing-12-month sum; foreign holdings show the level and the 12-month change.
- Positioning: net = long − short contracts per trader group; net % of open interest = 100 × net ÷ total open interest; w/w change in net contracts and in net % of open interest (percentage points); COT index = 100 × (net − min) ÷ (max − min) over the last 156 weekly rows (50 when max equals min); percentile of net % of open interest versus all history since 2010. "Crowded long" when the COT index is 90 or above, "Crowded short" when 10 or below.
- Sources: Federal Reserve H.4.1, US Treasury, FRED, CFTC Commitments of Traders, and the US Treasury TIC survey, all stored in the FinzData database.
Explore the underlying series: COT positioning, datasets, explore, and the RSS feed.
Pull the same data
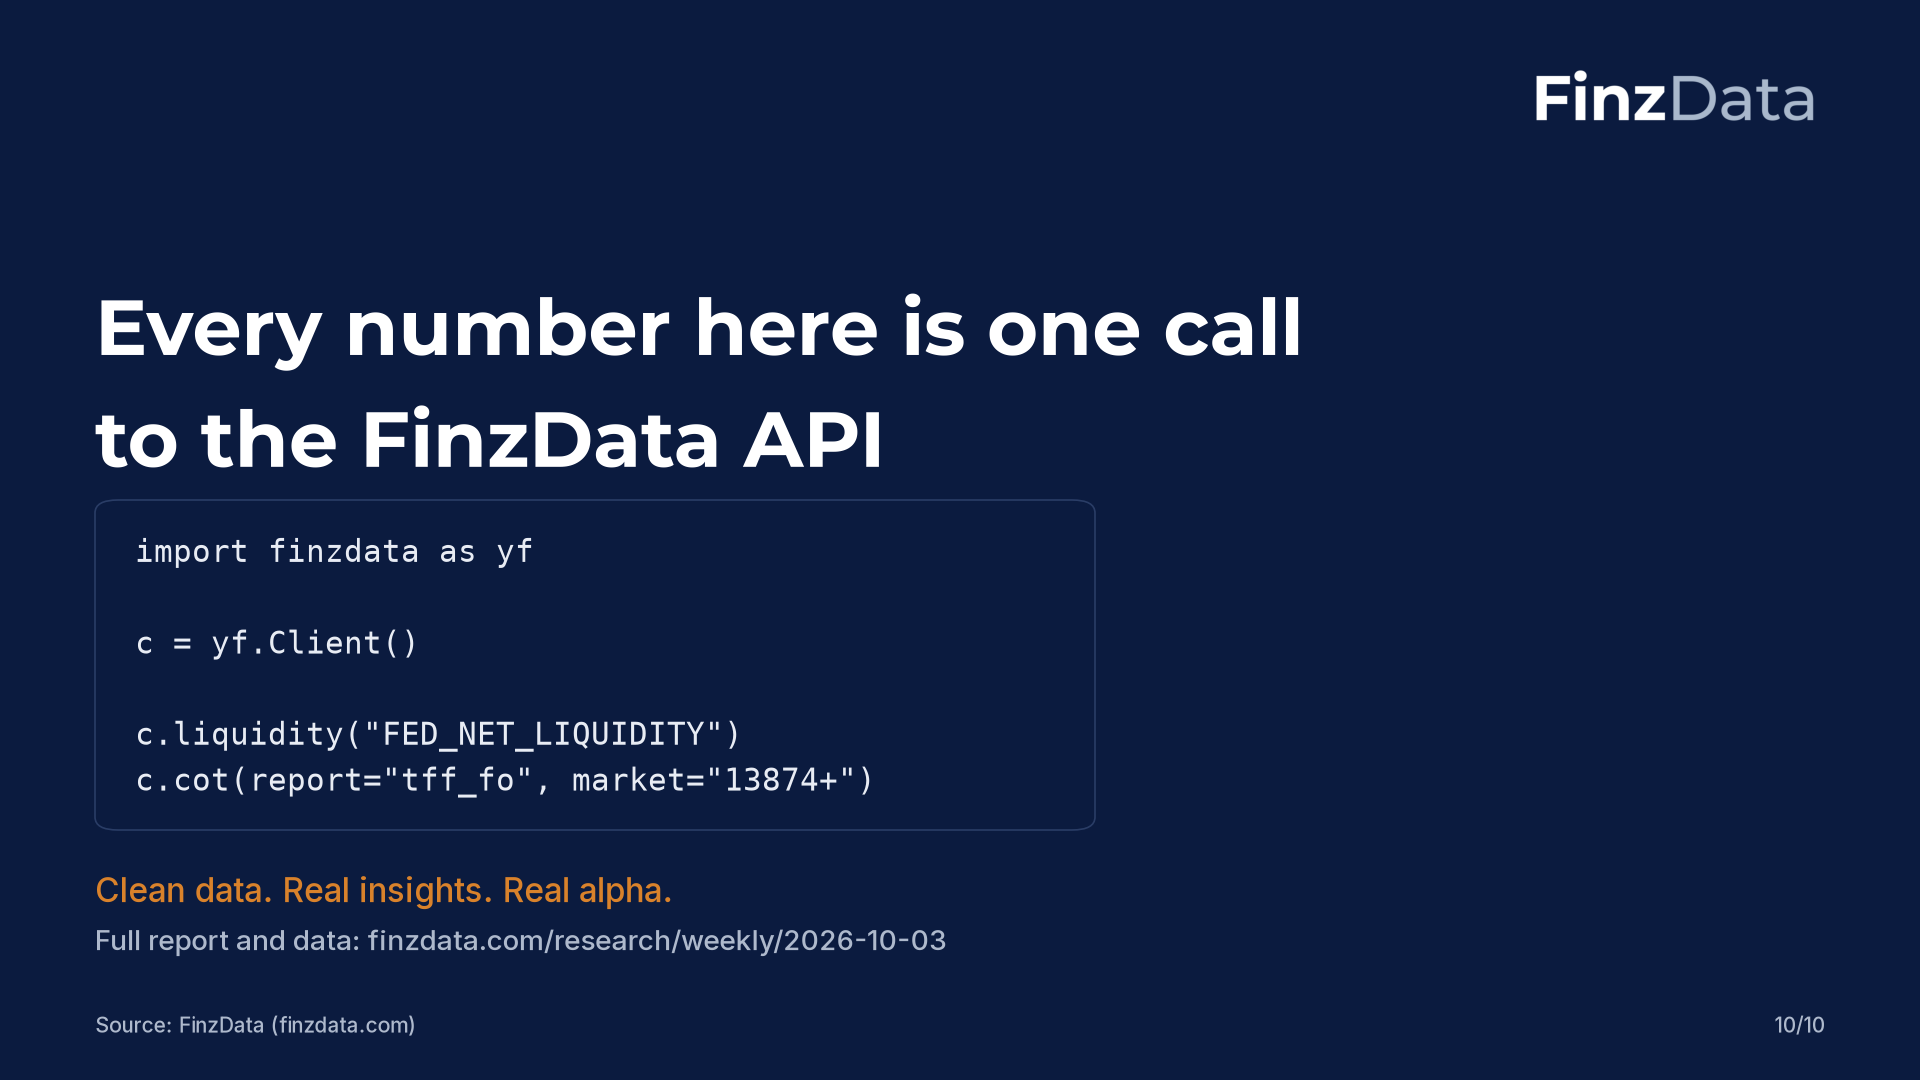
import finzdata as yf

c = yf.Client()

# Net liquidity: Fed assets minus TGA minus reverse repo
liq = c.liquidity("FED_NET_LIQUIDITY")

# COT positioning: S&P 500 futures, TFF report
cot = c.cot(report="tff_fo", market="13874+")

# Treasury International Capital flows
tic = c.tic()
Built for AI, quants, data scientists and financial analysts who backtest. Clean data. Real insights. Real alpha. finzdata.com. This material is for information only and is not investment advice.