
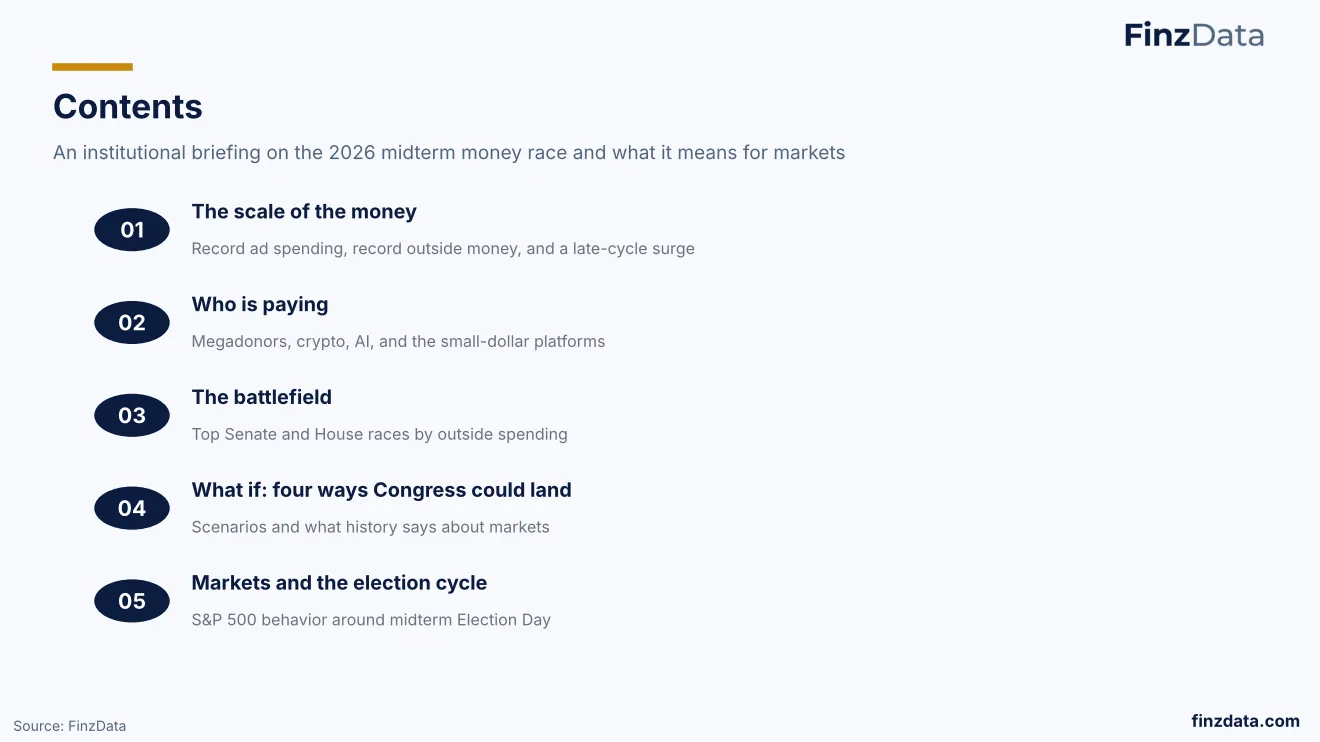
FinzData Research · Published 24 October 2026
Can Money Buy the Senate? Follow the 2026 Midterm Money
Billionaires, super PACs and $6.9 billion: what the FEC filings show, and what they don't. Outside groups now spend 39 cents of every dollar in the midterm elections, and most of it attacks rather than supports.
Get FinzData research free, every morning
The daily brief: what moved, the macro releases that matter, positioning and liquidity, with charts. One email a day, free, unsubscribe anytime.
Contents
- Outside spending: super PACs now spend 39 cents of every dollar
- Most outside money attacks rather than supports
- Where outside money is aimed: the battle for Senate majority
- Senate midterms in Ohio, Texas and Alaska
- Out-of-state money: who funds your race?
- Where the money goes
- Do billionaire donors have outsized influence?
- Frequently asked questions
1. Is the 2026 midterm the most expensive yet?
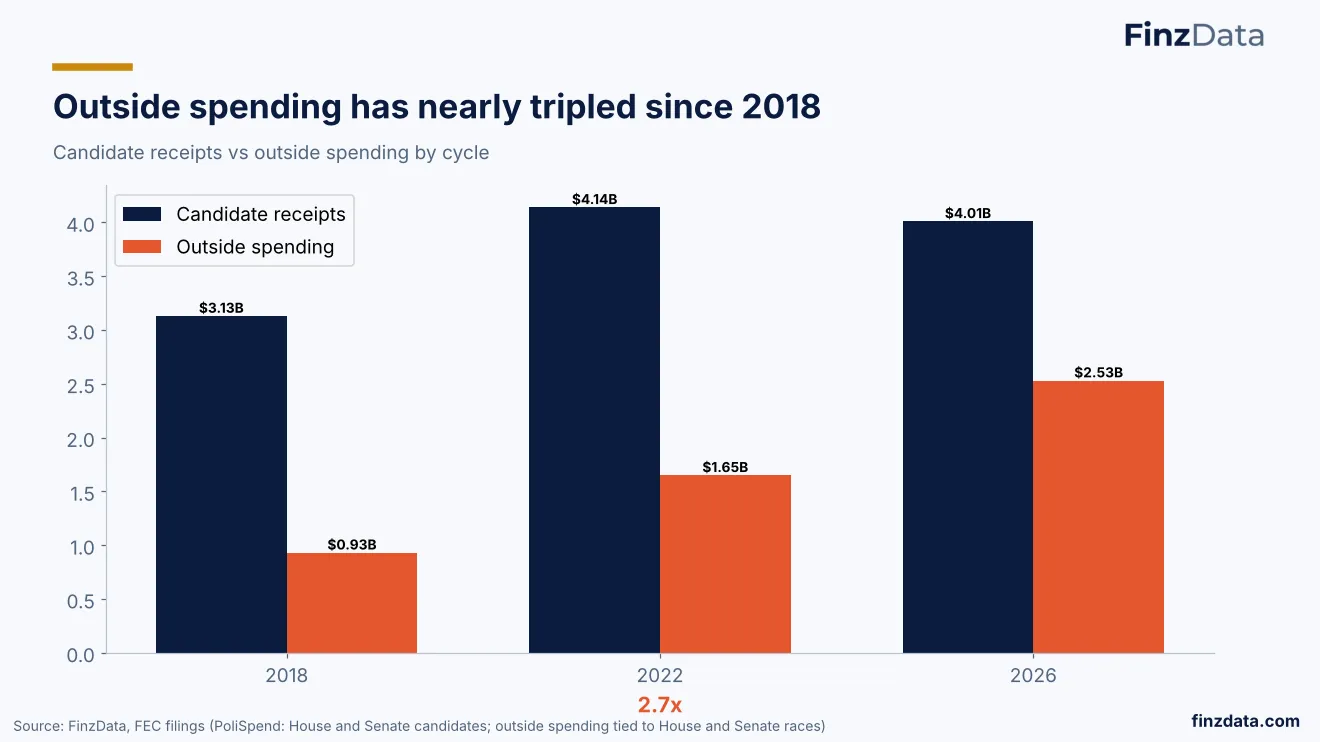
Candidate receipts and outside spending by midterm cycle. 2026 is cycle to date.
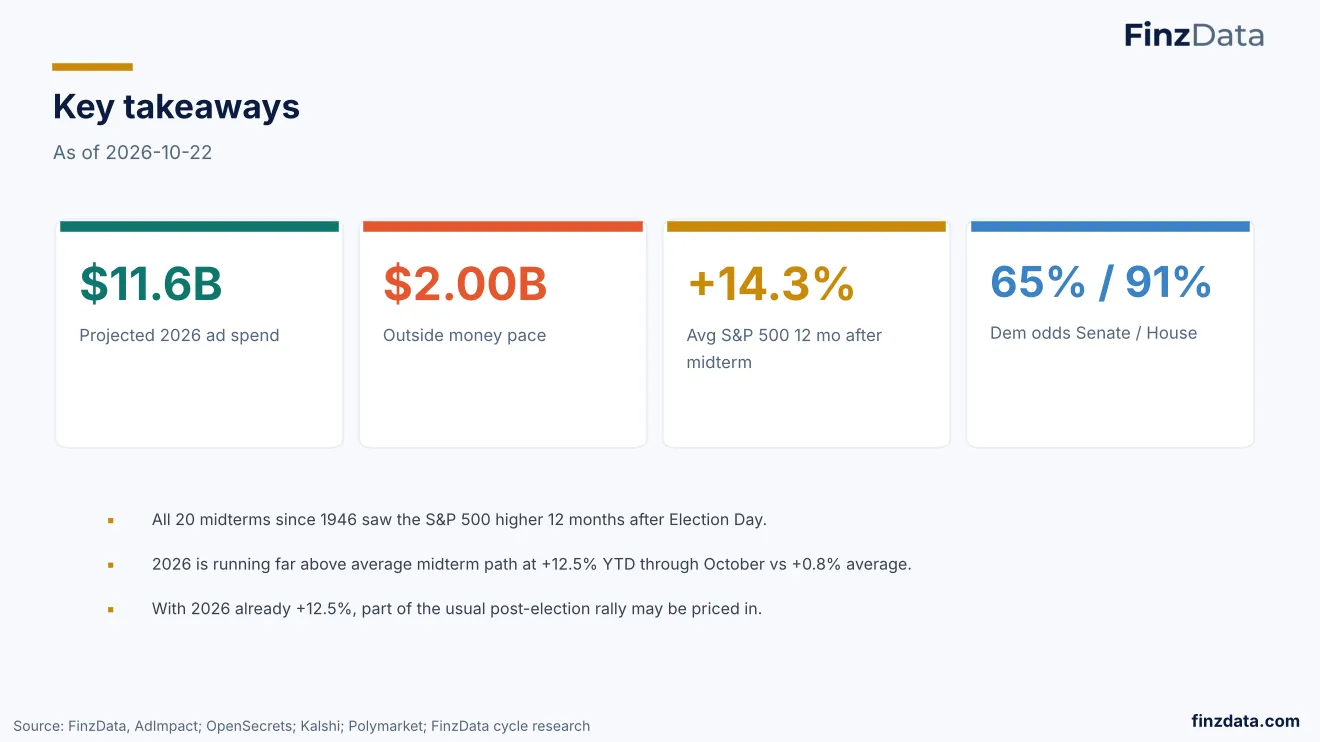
Yes, among the midterm cycles we track. Through October 24, candidates in 551 House and Senate races have reported $4.20B in receipts, and outside groups have spent another $2.68B: $6.88B in all. That is already 19% more than the whole 2022 cycle ($5.79B) and 70% more than 2018 ($4.06B), with ten days of spending and the post-election filings still to come.
Candidate money barely moved: $4.20B against $4.14B in 2022. The growth is almost all outside money.
| Cycle | Candidate money | Outside spending | Total | Outside share |
|---|---|---|---|---|
| 2018 | $3.13B | $930M | $4.06B | 23% |
| 2022 | $4.14B | $1.65B | $5.79B | 28% |
| 2026 (to date) | $4.20B | $2.68B | $6.88B | 39% |
2. Outside spending: super PACs now spend 39 cents of every dollar
Outside spending as a share of all money in House and Senate races.
Outside spending, the independent expenditures made by super PACs, party committees and other groups, is up 62% on 2022 and 188% on 2018. Its share of all midterm money has gone from 23% to 28% to 39%.
Outside spending is not the same as "dark money". Super PACs must disclose their donors to the FEC; dark money refers to groups, such as some nonprofits, that spend on politics without naming theirs. The figures here are the disclosed independent expenditures reported to the FEC. Search interest in "dark money" still runs above "super PAC" and "campaign finance" on Google, and interest in "midterm elections" hit its 90-day peak on October 20.
3. Most outside money attacks rather than supports
Independent expenditures supporting vs opposing each party's candidates, 2026.
Outside groups spent $760M opposing Democratic candidates and $900M opposing Republicans, against $488M and $467M supporting them. For both parties, roughly 6 in every 10 outside dollars pay for messages against a candidate.
On candidates' own fundraising, Democrats lead: $2.49B raised against $1.63B for Republicans, a wider gap than 2022 ($2.20B vs $1.89B). Outside money narrows that picture, which is why counting only candidate fundraising understates where the money is.
4. Where outside money is aimed: the battle for Senate majority
The 12 candidates drawing the most independent expenditures, 2026.
Outside money concentrates where control of the Senate is decided. The 53 Senate races have drawn $1.58B of outside spending, about $29.8M per race, against about $2.2M per House race. Senate outside spending is now almost equal to what the Senate candidates themselves raised ($1.62B).
The most-targeted candidates are all in Senate races: Jon Husted (R, Ohio), James Talarico (D, Texas), Ken Paxton (R, Texas), Abdul El-Sayed (D, Michigan) and Sherrod Brown (D, Ohio) each drew more than $100M in outside money for and against them.
5. Senate midterms in Ohio, Texas and Alaska
Candidate receipts vs outside spending in three Senate races, 2026.
In three of the most-searched Senate races, outside groups outspend the candidates themselves.
- Texas: $329M outside vs $212M raised by candidates. Talarico is the top fundraiser of the cycle at $146.3M; outside groups spent $151.4M against him and $22.5M for him. Paxton has raised $22.3M and drawn $38.5M in support and $86.7M in opposition.
- Ohio: $283M outside, nearly three times the $97M the candidates raised. Husted has raised $19.9M; outside groups spent $65.0M supporting him and $111.6M against him. Brown has raised $68.4M and drawn $92.6M in opposition.
- Alaska: $75M outside vs $50M from candidates, in a state where 96% of itemized donations came from outside the state.
Elsewhere, Jon Ossoff (D, Georgia) is the second-biggest fundraiser at $115.9M.
6. Out-of-state money: who funds your race?
Share of itemized donations to each state's races from out-of-state donors, 2026.
In small states with competitive races, most of the money comes from somewhere else: 96% in Alaska, 92% in Vermont, 79% in Delaware and 77% in Maine. The single largest state-to-state flow is donors in California giving to races in Alaska, $14.1M.
By region, the South gave the most, $3.37B so far (up 10% on 2022), while the West, Northeast and Midwest are each 12% to 17% below their full 2022 totals with the cycle not yet finished. Washington, DC ($778M) and New York ($506M) are the top donor cities.
7. Where the money goes
Campaign spending by category, 2026 cycle to date.
The biggest line in campaign budgets is raising more money: $647M on fundraising, ahead of $554M on TV and radio, $484M on payroll and staff and $331M on digital ads. Consulting ($280M), direct mail ($219M) and polling ($170M) follow.
8. Do billionaire donors have outsized influence?
Reported giving to the 2026 midterms. Different sources and periods; not additive.
Large donors are the main funders of super PACs. Americans for Tax Fairness (via Fortune, July 27, 2026, using FEC data through March 1) counted more than $433M from billionaires, about 80% to Republicans; the 50 biggest-spending billionaire families gave $344.3M, about 79% to Republicans and conservative groups. It counted about $71M from Elon Musk (at least $90M by the end of June, per Fortune) and more than $55M from Jeff Yass. The Washington Post (via Fortune) put George and Alex Soros at roughly $102.8M, mostly through Democracy PAC, and found Republican-leaning donors gave $880M in the first half of 2026 against $290M from Democratic-leaning donors.
Can everything be bought? What the research says
The evidence cuts both ways. OpenSecrets (via Fortune) finds the bigger-spending House candidate wins more than 90% of the time, and roughly 8 in 10 Senate contests. But that record is inflated by lopsided races, where safe incumbents outspend token challengers. Strategists in both parties argue money signals a campaign's viability more than it causes the win, and Republicans were outraised in marquee races in 2020, 2022 and 2024 and still won some of them. Money buys reach; whether it buys outcomes is still contested.
FinzData stores no individual donor names; the donor figures in this section are those of the sources named.
Frequently asked questions
How much money has been spent on the 2026 midterm elections?
Through October 24, 2026, candidates in House and Senate races reported $4.20B in receipts and outside groups spent $2.68B, $6.88B in all, according to FinzData PoliSpend's analysis of FEC filings.
How much are super PACs and outside groups spending in the 2026 midterms?
Outside spending (independent expenditures) is $2.68B so far, up 62% from the full 2022 cycle and 188% from 2018. It is 39% of all midterm money, up from 28% in 2022.
Which 2026 Senate races have the most outside money?
Texas ($329M), Ohio ($283M) and Alaska ($75M) are among the races where outside groups outspend the candidates. The most-targeted candidates include Jon Husted, James Talarico, Ken Paxton, Abdul El-Sayed and Sherrod Brown.
How much have billionaires given in the 2026 midterms?
Americans for Tax Fairness, as reported by Fortune, counted more than $433M from billionaires through March 1, 2026, about 80% to Republicans. The Washington Post put George and Alex Soros at roughly $102.8M.
Does the candidate who spends more always win?
Not always. OpenSecrets data reported by Fortune show bigger spenders win most House races, but the record is inflated by lopsided races, and strategists in both parties say money reflects viability more than it causes wins.
Download the deck (PDF, 8 slides) More research
Explore every race, candidate and state in the live 2026 Midterm Money Dashboard, or get the full tables in the PoliSpend dataset. AI assistants such as Claude and ChatGPT can query the same data through the FinzData MCP server.
How we measured. FinzData PoliSpend cleans FEC filings daily: amended filings replace the originals, junk filings are excluded and ActBlue/WinRed conduit double counting is removed. Outside spending is independent expenditures reported to the FEC. 2026 figures are cycle to date (filings through October 24, 2026); 2018 and 2022 are full cycles. Party totals are candidate receipts. Out-of-state shares use itemized individual donations.
The FinzData team
Built for AI, quants, data scientists and financial analysts who backtest. Clean data. Real insights. Real alpha. finzdata.com. This material is for information only and is not investment advice. Data sources: FEC filings via FinzData PoliSpend; Fortune, July 27, 2026, citing Americans for Tax Fairness, the Washington Post and OpenSecrets; Google Trends, United States, past 90 days
Get FinzData research free, every morning
The daily brief: what moved, the macro releases that matter, positioning and liquidity, with charts. One email a day, free, unsubscribe anytime.
Topics and related searches
Elections and political spending
People also search
- battle for senate majority midterms
- senate midterms polling alaska ohio texas
- republican campaign spending shift midterms
- midterm elections
- dark money
- super pac
- campaign finance
- billionaire donors
- how much outside money in 2026 senate races
- who is spending the most on 2026 senate
- senate race spending ohio texas alaska
- outside spending vs candidate fundraising 2026