
FinzData Research · Published 20 October 2026
Korea's chip machine: how electronics exports drive Korea's economy and stock market
Integrated circuits are now 7.6% of South Korea's GDP and two memory makers are half of its stock market. We measured how closely Korean and US chip stocks follow Korea's exports, and whether the data predicts them.
Get FinzData research free, every morning
The daily brief: what moved, the macro releases that matter, positioning and liquidity, with charts. One email a day, free, unsubscribe anytime.
Contents
- September 2026: Korea's biggest export month ever
- Integrated-circuit exports, 2000 to 2026
- Integrated circuits alone are 7.6% of Korea's economy
- Monthly electronics exports: the AI memory boom
- Korea and Taiwan: the two export engines of the AI build-out
- Two chipmakers are half of Korea's stock market
- Chip exports and Korean stocks move together
- But the export data does not reliably predict returns
- What to watch each month
- The data behind this deck
- Frequently asked questions
1. Korea's Chip Machine
FinzData Research, October 2026.
South Korea is the world's clearest example of an economy and a stock market built on one export: memory chips. This paper measures how far that reliance goes, using the Korea Customs Service's exports by product code (HS code) since 2000, Taiwan's Ministry of Finance exports since 2001, and daily prices for EWY, SOXX, SOXL and NVDA, all from the FinzData store.
2. September 2026: Korea's biggest export month ever
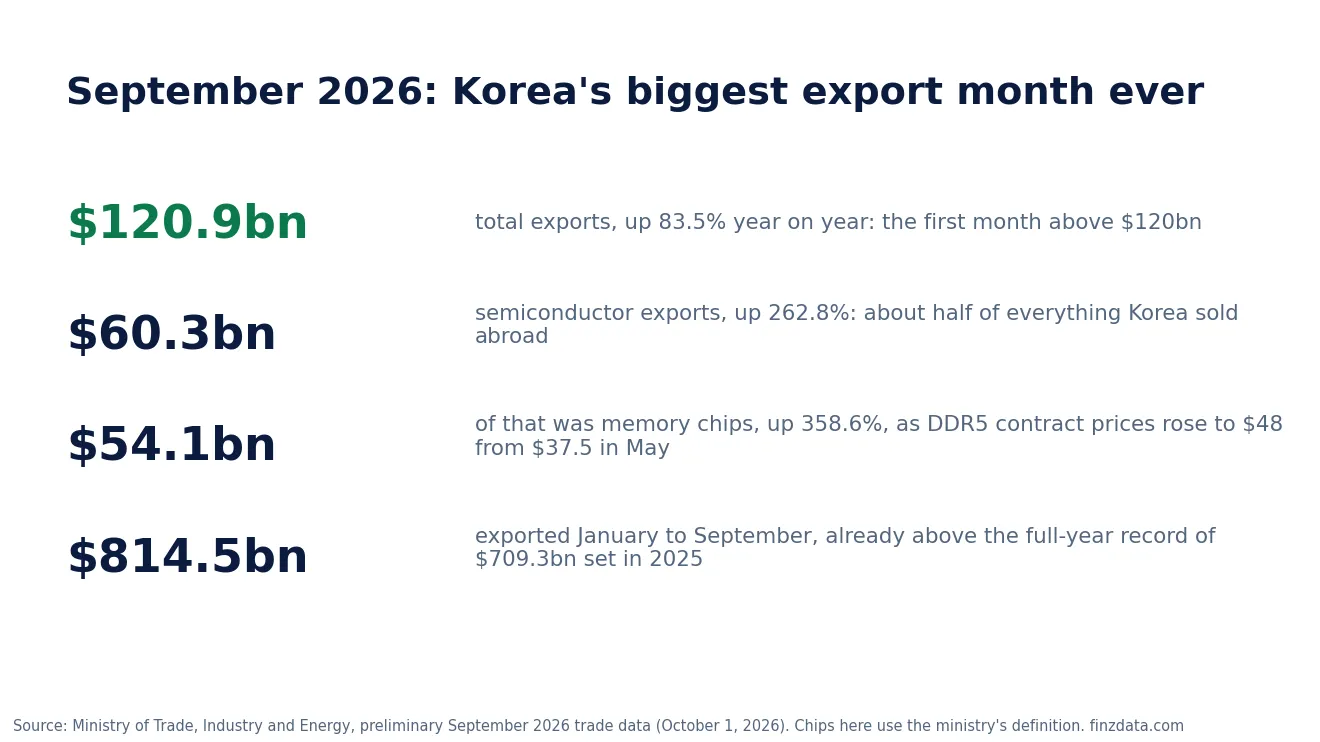
Preliminary trade data from the Ministry of Trade, Industry and Energy, October 1, 2026.
Korea exported $120.94 billion of goods in September 2026, up 83.5% on a year earlier and the first month above $120 billion. Semiconductors were $60.3 billion of it, up 262.8%: about half of everything the country sold abroad. Memory alone was $54.07 billion, up 358.6%, as contract prices rose (DDR5 16Gb to $48 in September from $37.5 in May). Exports excluding chips grew 23%.
January to September exports reached $814.5 billion, already above the full-year record of $709.3 billion set in 2025. Exports to the US ($24.33 billion, +137.0%) and China ($26.01 billion, +122.7%) both more than doubled.
The ministry's chip figure uses its own product grouping. The rest of this paper uses the narrower customs code for integrated circuits, HS 8542 ($43.1 billion in September), so the two numbers differ.
3. Integrated-circuit exports, 2000 to 2026
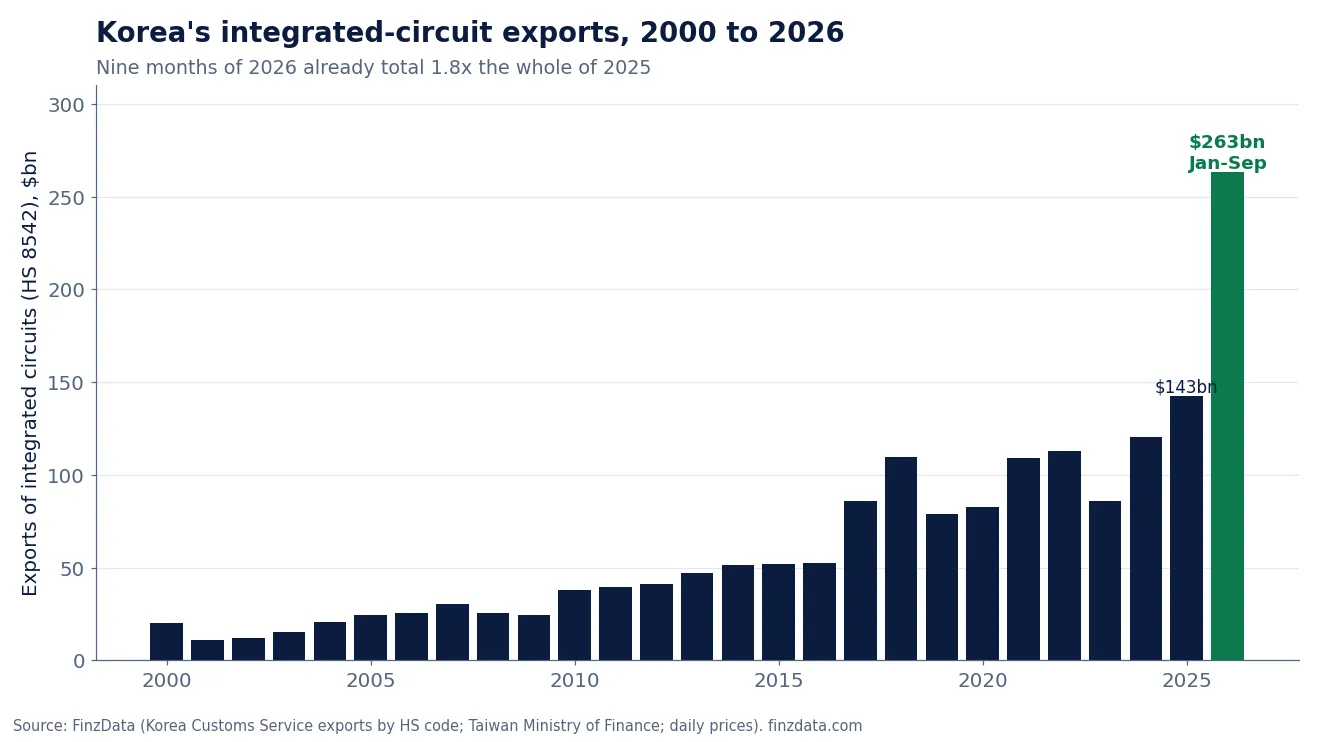
Annual exports of integrated circuits (HS 8542); 2026 is January to September.
Korea's integrated-circuit exports grew from $20.0 billion in 2000 to $142.8 billion in 2025. The path is a series of memory cycles: a surge in 2017-2018 to $109.8 billion, a fall to $79.1 billion in 2019, a peak of $112.8 billion in 2022 and a drop to $86.1 billion in 2023.
2026 breaks the pattern in size. The first nine months total $263.1 billion, 165.8% more than the same months of 2025 and 1.8 times the whole of 2025.
4. Integrated circuits alone are 7.6% of Korea's economy
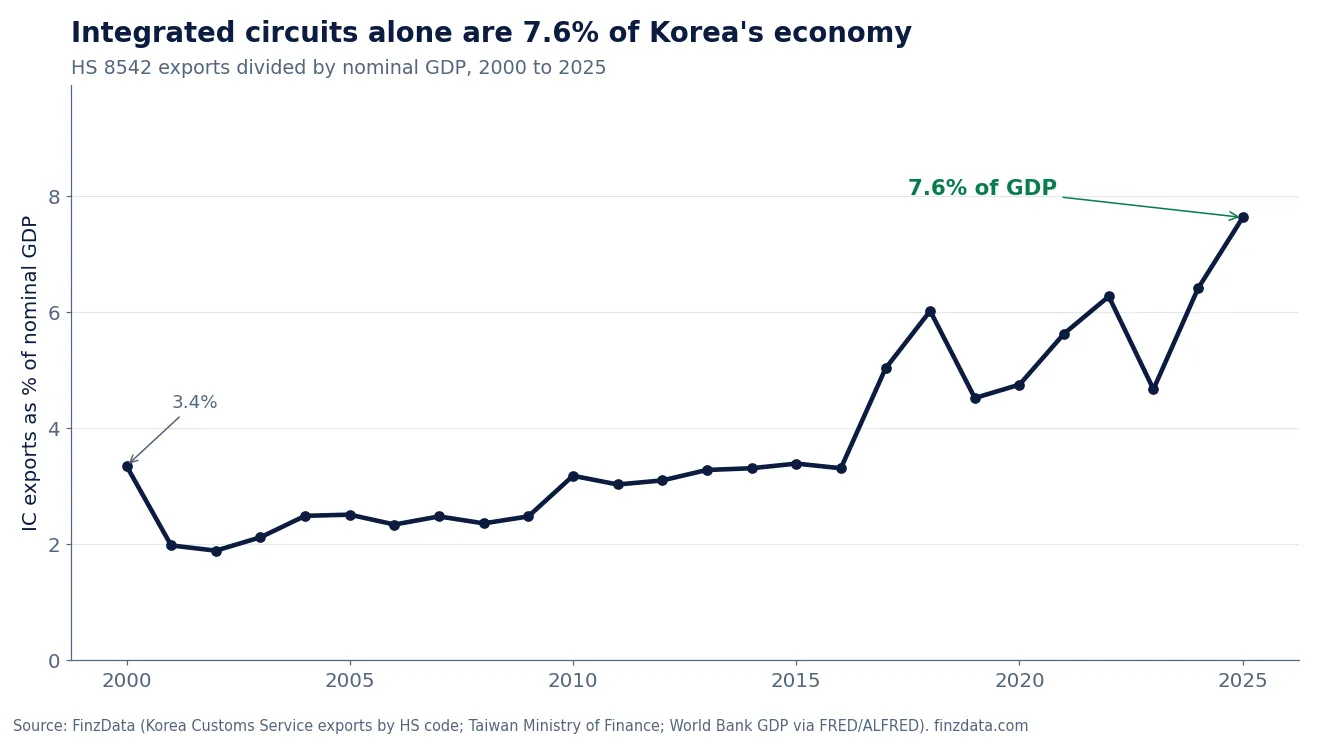
HS 8542 exports as a share of nominal GDP (World Bank), 2000 to 2025.
Goods exports of $709.3 billion in 2025 equal 37.9% of Korea's $1,872 billion GDP. Integrated circuits alone were 7.63% of GDP in 2025, up from 3.35% in 2000 and 3.31% in 2016. With 2026 exports running far ahead of 2025, that share is set to rise again this year.
Few large economies have this much of their output in one product. When memory prices turn, Korea's trade balance, corporate profits and tax receipts turn with them.
5. Monthly electronics exports: the AI memory boom
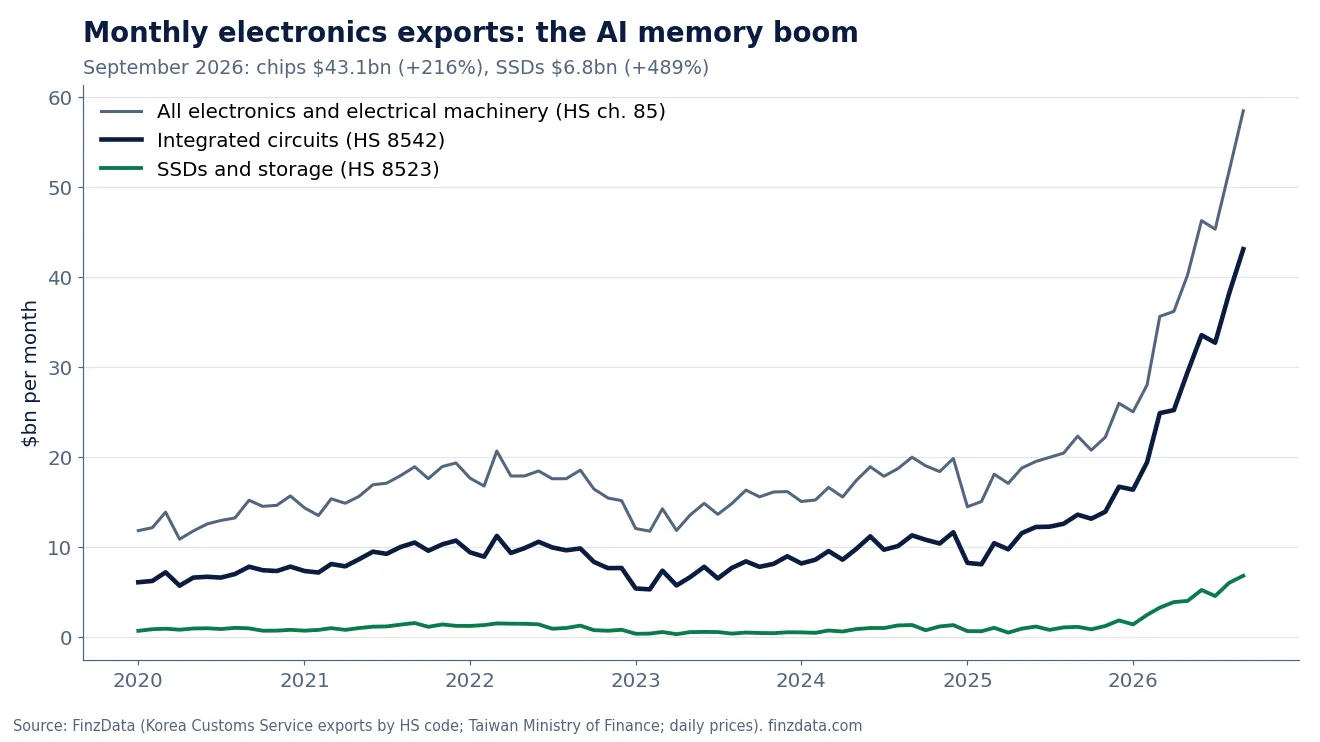
Monthly exports since 2020: HS chapter 85, integrated circuits (HS 8542) and SSDs and storage (HS 8523).
September 2026 integrated-circuit exports were $43.12 billion, up 216.5% on a year earlier. SSDs and storage media reached $6.84 billion, up 488.7%, as AI data centres bought flash storage alongside high-bandwidth memory. All electrical machinery and electronics (HS chapter 85) was $58.48 billion, and integrated circuits were 73.7% of it.
6. Korea and Taiwan: the two export engines of the AI build-out
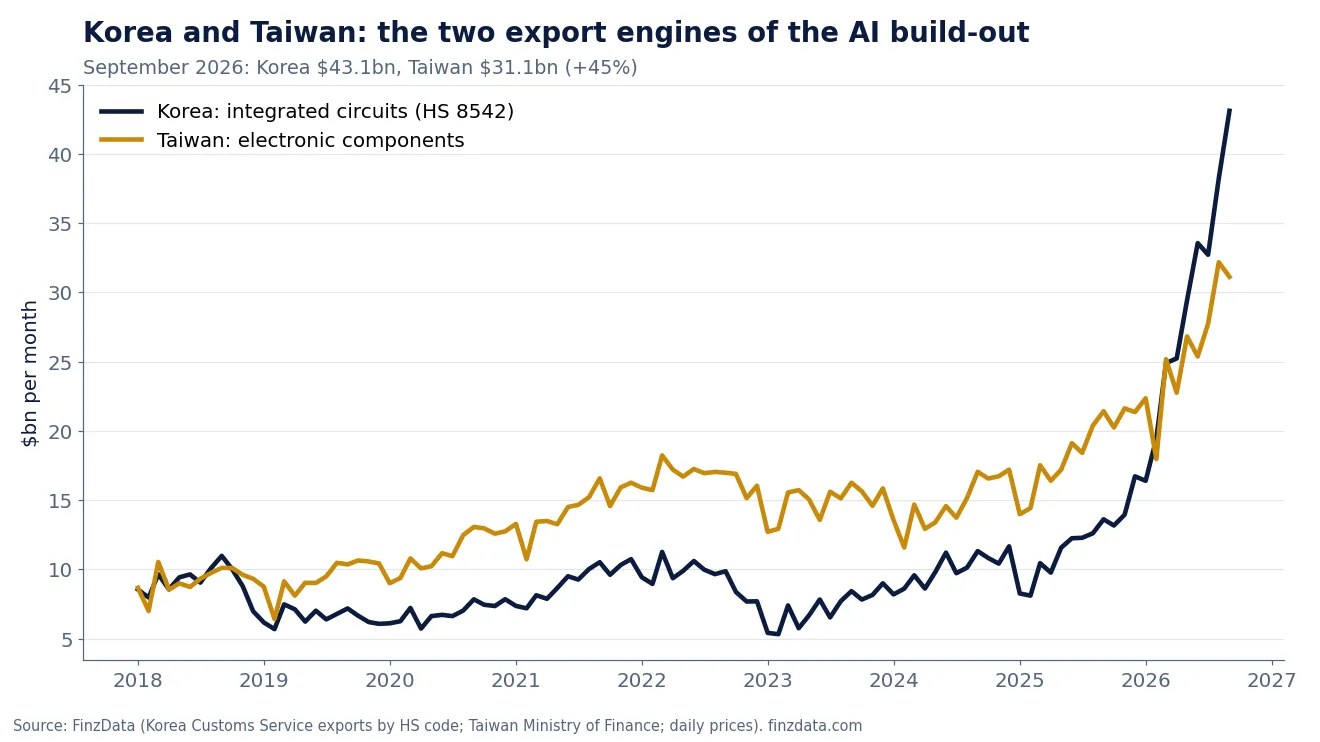
Korea integrated circuits (HS 8542) and Taiwan electronic components, monthly since 2018.
Taiwan's electronic-components exports were $31.13 billion in September 2026, up 45.3%, and its information, communication and audio-video products (servers) another $39.13 billion. Taiwan leads in logic chips and servers; Korea leads in memory. Korea's integrated-circuit exports overtook Taiwan's electronic components in spring 2026 as memory prices rose faster than logic.
7. Two chipmakers are half of Korea's stock market
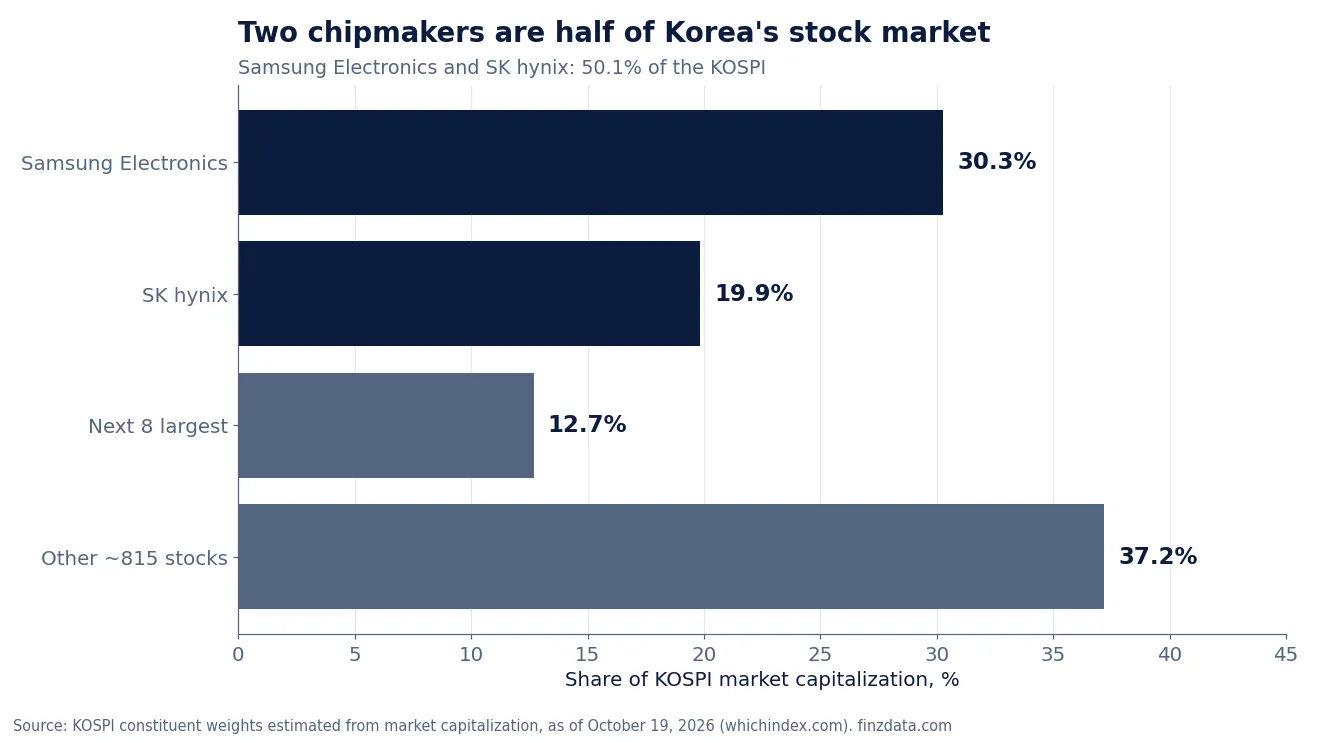
KOSPI weights estimated from market capitalization, October 19, 2026.
Samsung Electronics (30.28%) and SK hynix (19.85%) together make up 50.13% of the KOSPI; the ten largest stocks are 62.81%. Buying Korea today, through the KOSPI or the iShares MSCI South Korea ETF (EWY), is mostly buying two memory makers.
8. Chip exports and Korean stocks move together
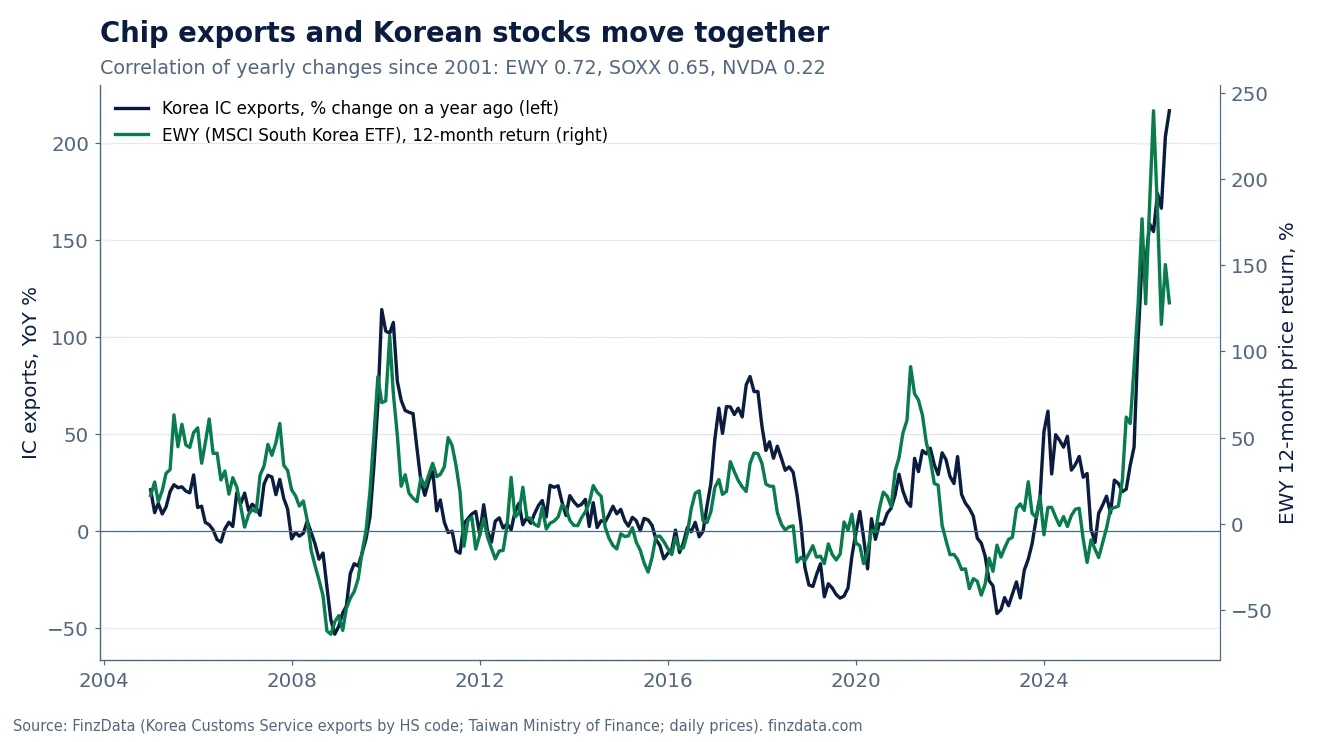
Korea IC exports, change on a year earlier, against EWY's 12-month price return, monthly.
Since 2001 the yearly change in Korea's integrated-circuit exports and EWY's 12-month price return have a correlation of 0.72 across 305 months. For the US semiconductor ETF SOXX it is 0.65; for NVDA only 0.22, because Nvidia's cycle has been driven by its own products rather than the memory cycle.
So Korea's export data is a real-time read on the memory economy that Korean stocks, and to a lesser degree US chip stocks, reflect.
9. But the export data does not reliably predict returns
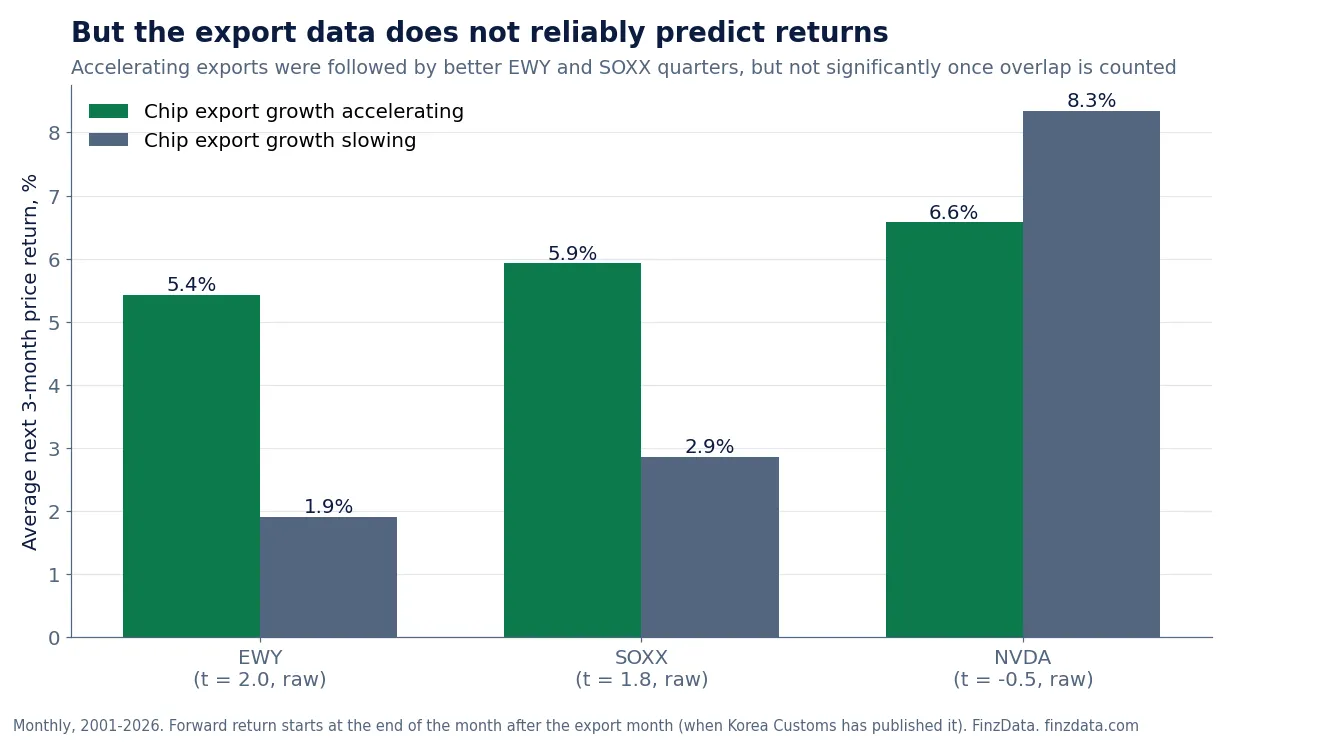
Average next 3-month price return after months when chip export growth accelerated or slowed, 2001-2026.
We tested whether the data gives an edge. For each month we checked whether chip export growth accelerated, then measured the next three months' return starting only after Korea Customs had published the figure, to avoid look-ahead.
After acceleration, EWY returned 5.43% on average versus 1.91% after slowing (t = 2.01); SOXX 5.93% versus 2.86% (t = 1.77). Those t-statistics use overlapping three-month windows, which overstates significance by roughly the square root of three; adjusted, neither clears conventional significance. For NVDA there is no difference at all.
The honest conclusion: Korea's exports explain Korean and chip stocks well, but by the time they are published, markets have largely priced them. They are a better risk and context signal than a trading signal on their own.
10. What to watch each month
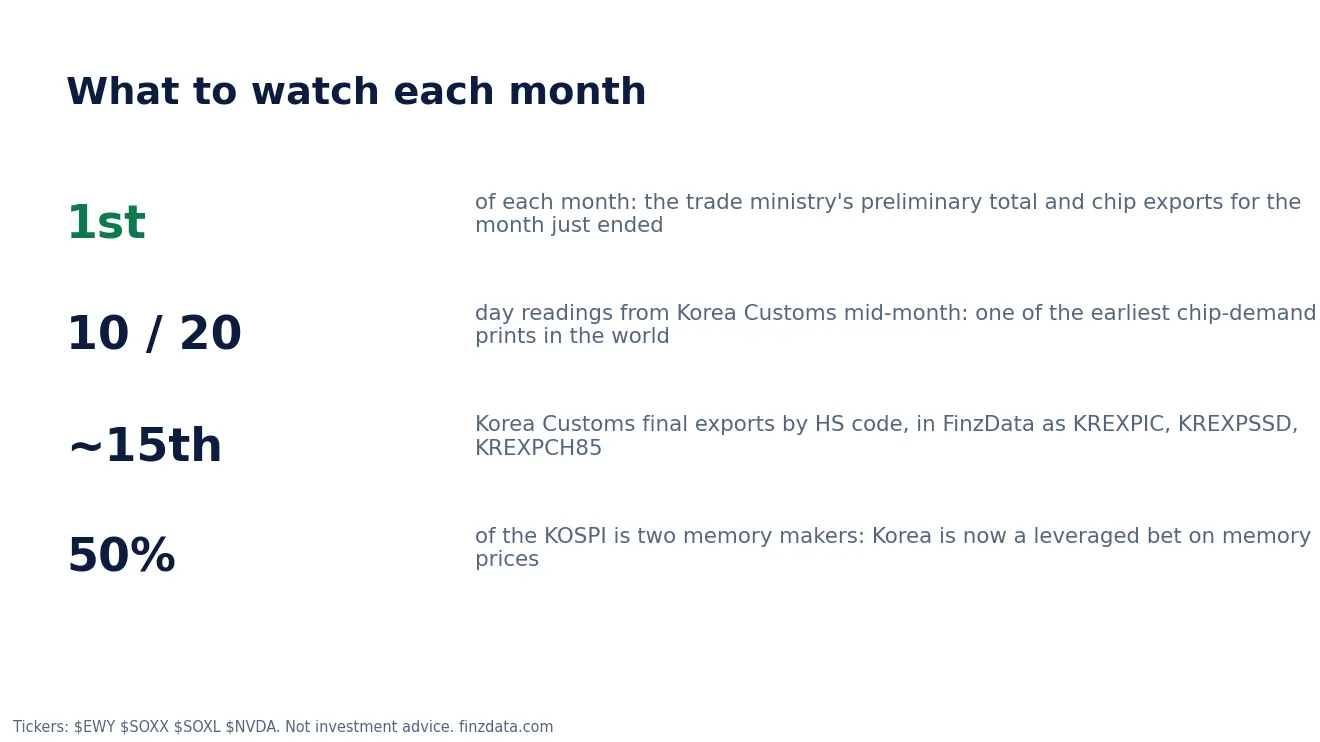
Release calendar and the concentration risk.
The trade ministry publishes preliminary totals and chip exports on the first day of each month. Korea Customs publishes readings for the first 10 and first 20 days of the month, among the earliest chip-demand data anywhere, and final exports by HS code around mid-month, which is when FinzData's series update. With half the KOSPI in two memory makers, Korea now trades as a leveraged position on memory prices: the upside in 2026, and the main risk when the cycle turns.
11. The data behind this deck
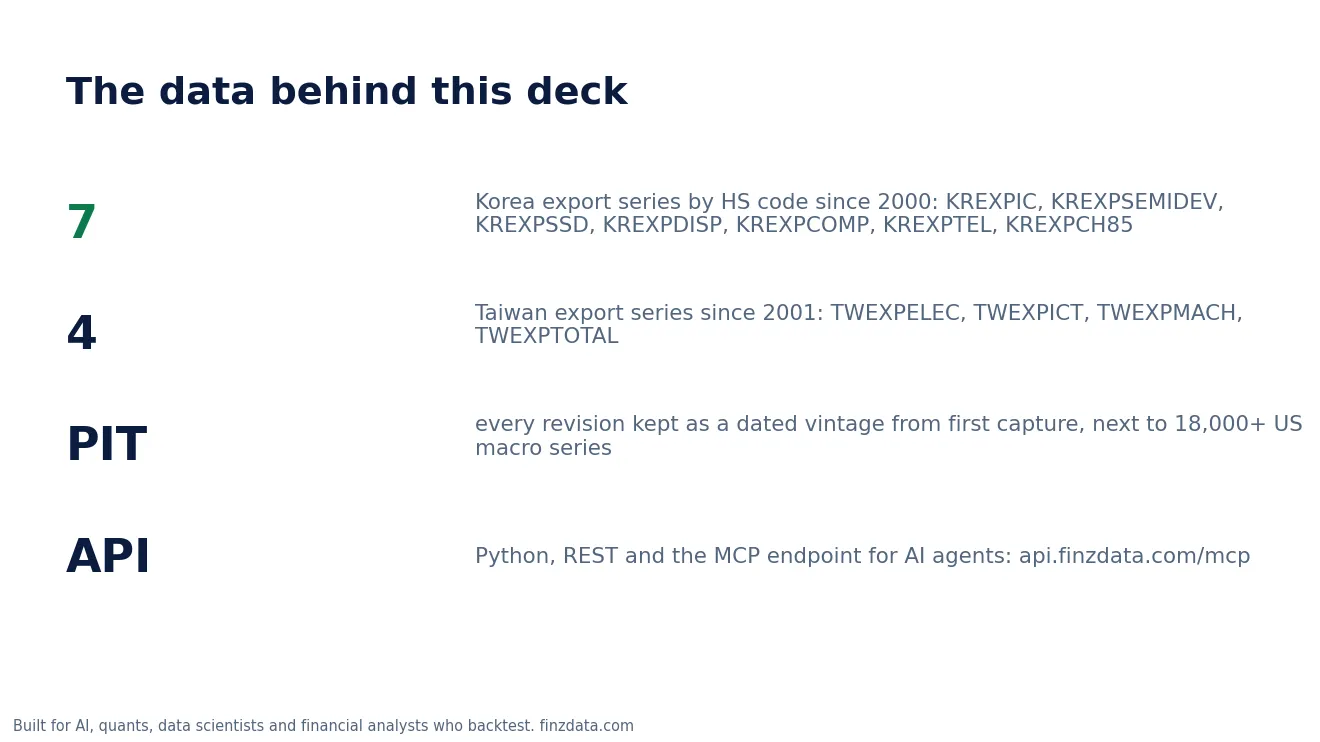
Every chart in this paper comes from the FinzData store.
Korea: KREXPIC (integrated circuits), KREXPSEMIDEV (semiconductor devices), KREXPSSD (SSDs and storage), KREXPDISP (display modules), KREXPCOMP (computers), KREXPTEL (phones and telecom), KREXPCH85 (all of HS chapter 85), monthly in US$ millions since 2000. Taiwan: TWEXPELEC, TWEXPICT, TWEXPMACH, TWEXPTOTAL since 2001. Every revision is kept as a dated vintage from first capture, alongside 18,000+ US macro series, daily prices and the rest of the FinzData store, through Python, the REST API and the MCP endpoint for AI agents.
Frequently asked questions
How dependent is South Korea on exports?
Goods exports were $709.3 billion in 2025, about 37.9% of GDP, and integrated circuits alone were 7.63% of GDP.
How much of the KOSPI is Samsung and SK hynix?
About 50.1% as of October 19, 2026: Samsung Electronics 30.28% and SK hynix 19.85%.
Do Korean chip exports predict chip stocks?
They move together (correlation 0.72 for EWY and 0.65 for SOXX on yearly changes), but once you wait for the data to be published, export acceleration did not significantly predict the next three months' returns.
Where can I get Korea's exports by HS code?
FinzData publishes Korea Customs Service exports by HS code monthly since 2000 (KREXPIC, KREXPSSD, KREXPCH85 and more), with every revision kept as a vintage, through Python, REST and MCP.
Download the deck (PDF, 11 slides) More research
Built for AI, quants, data scientists and financial analysts who backtest. Clean data. Real insights. Real alpha. finzdata.com. This material is for information only and is not investment advice. Data sources: FinzData store: Korea Customs Service exports by HS code (2000-2026), Taiwan Ministry of Finance exports by main commodity (2001-2026), World Bank GDP via FRED/ALFRED, daily prices for EWY, SOXX, SOXL, NVDA. Ministry of Trade, Industry and Energy preliminary September 2026 trade data (October 1, 2026). KOSPI weights estimated from market capitalization, October 19, 2026 (whichindex.com). Prices through 2026-10-16.
Get FinzData research free, every morning
The daily brief: what moved, the macro releases that matter, positioning and liquidity, with charts. One email a day, free, unsubscribe anytime.
Topics and related searches
Semiconductors and AI supply chain Exports and global trade Asian economies and markets
People also search
- how much of kospi is samsung and sk hynix
- will korea chip exports keep rising
- why are korea exports up in september 2026
- what is korea chip export share of gdp
- does korea chip export data predict stock returns
- when is korea trade data released each month
- where can i get korea customs exports by hs code
- are korea semiconductor exports at record high
- how dependent is south korea on exports
- which companies make up half of kospi
- korea exports september 2026 billion dollars
- korea semiconductor exports september 2026