
FinzData Research · Published 19 October 2026
Financial conditions tighten as Goldilocks returns
The FinzData Quantitative Model now reads US financial conditions as tightening and the macro quadrant as Goldilocks, while its September nowcast points to Reflation. Here is what each reading is, and what the S&P 500 did after the same readings from 2011 to 2026, measured only from data as it was published at the time.
Get FinzData research free, every morning
The daily brief: what moved, the macro releases that matter, positioning and liquidity, with charts. One email a day, free, unsubscribe anytime.
Contents
- After tightening readings, the range widened
- Average returns did not fall, but misses rose
- Goldilocks returns after a Stagflation run
- Goldilocks has the best record of the 4 quadrants
- What to watch: the September nowcast says Reflation
- Frequently asked questions
1. Financial conditions are tightening, from a loose level
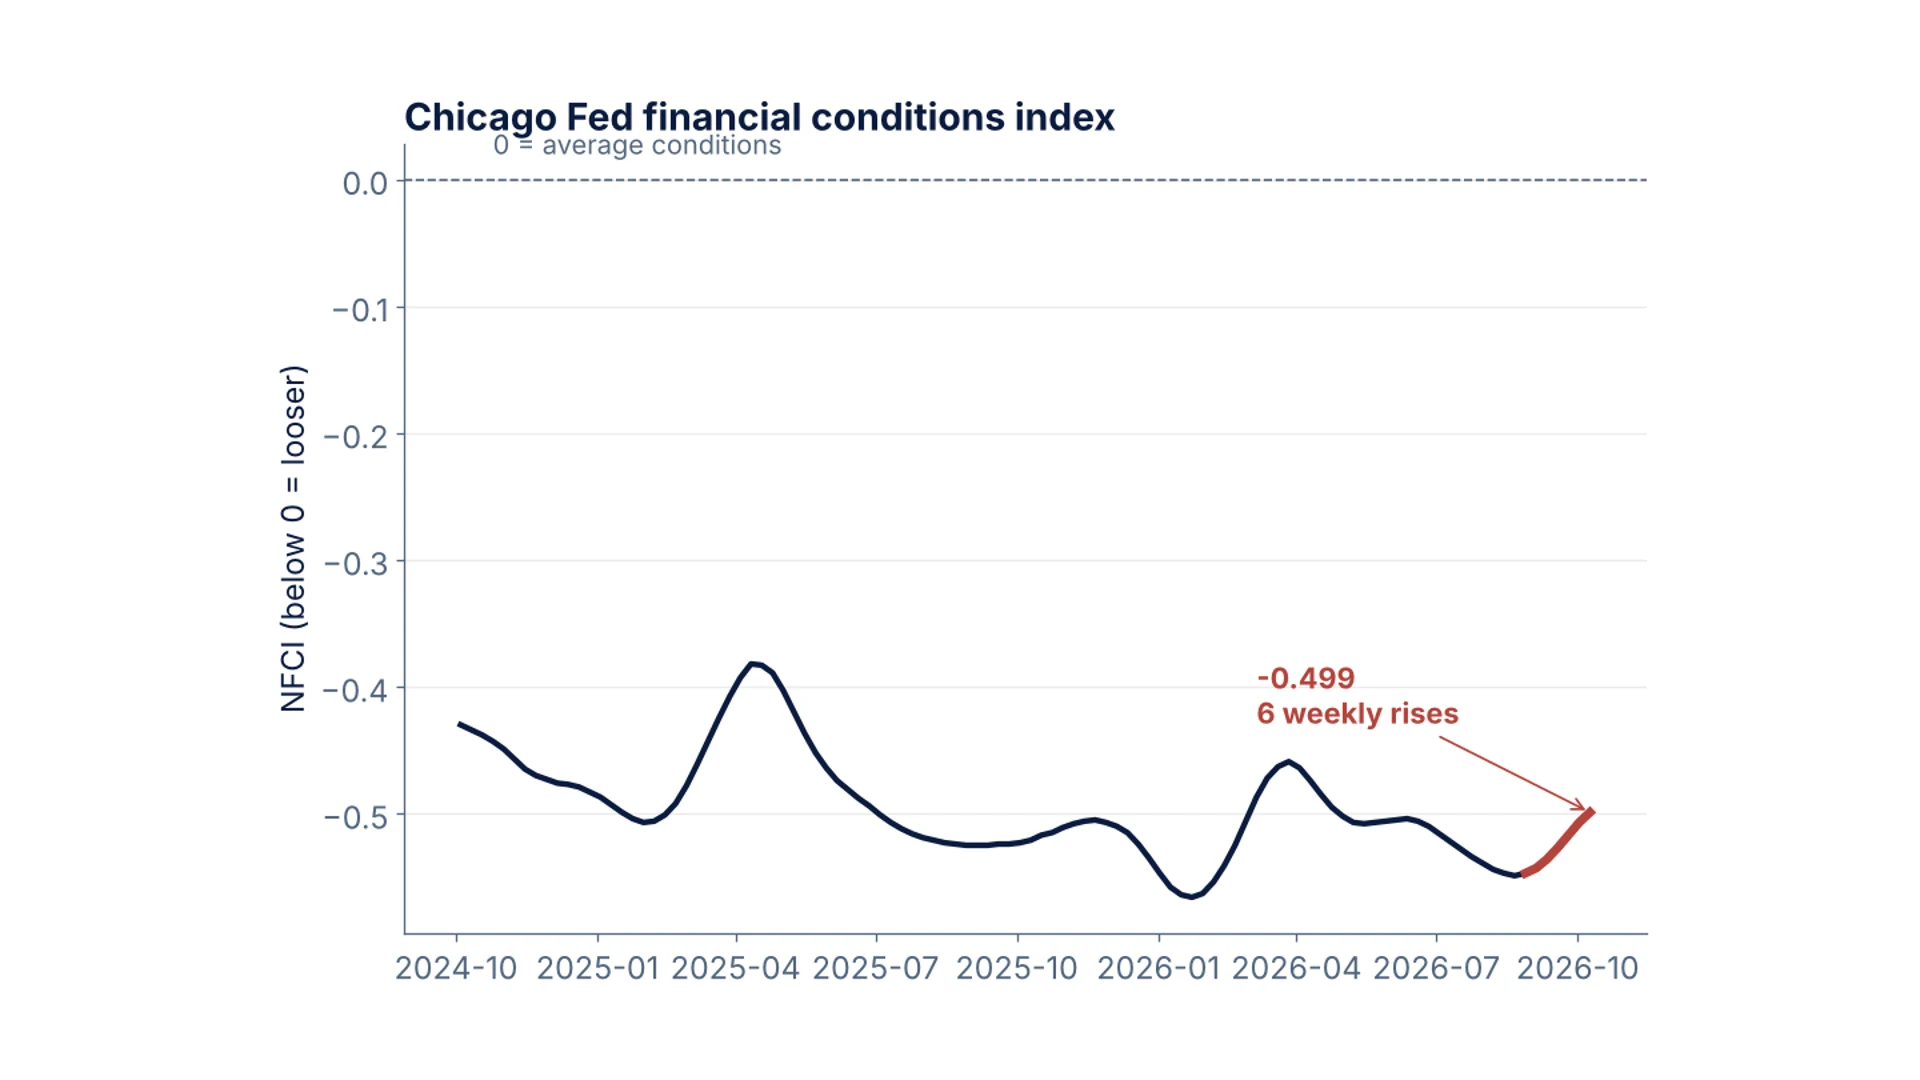
Chicago Fed NFCI, last 2 years
The model reads financial conditions as TIGHTENING for a 2nd week (Chicago Fed NFCI, 4-week change), and the financial risk subindex is tightening too. The NFCI has risen 6 weeks in a row, from -0.543 on 4 September to -0.499 on 9 October 2026. It is still below 0, so conditions remain looser than average: the direction changed, not the level. Meanwhile the model's S&P 500 stress probability, a 2-state Markov-switching model of daily index returns, read 0.015% on 19 October: the calm state.
2. After tightening readings, the range widened
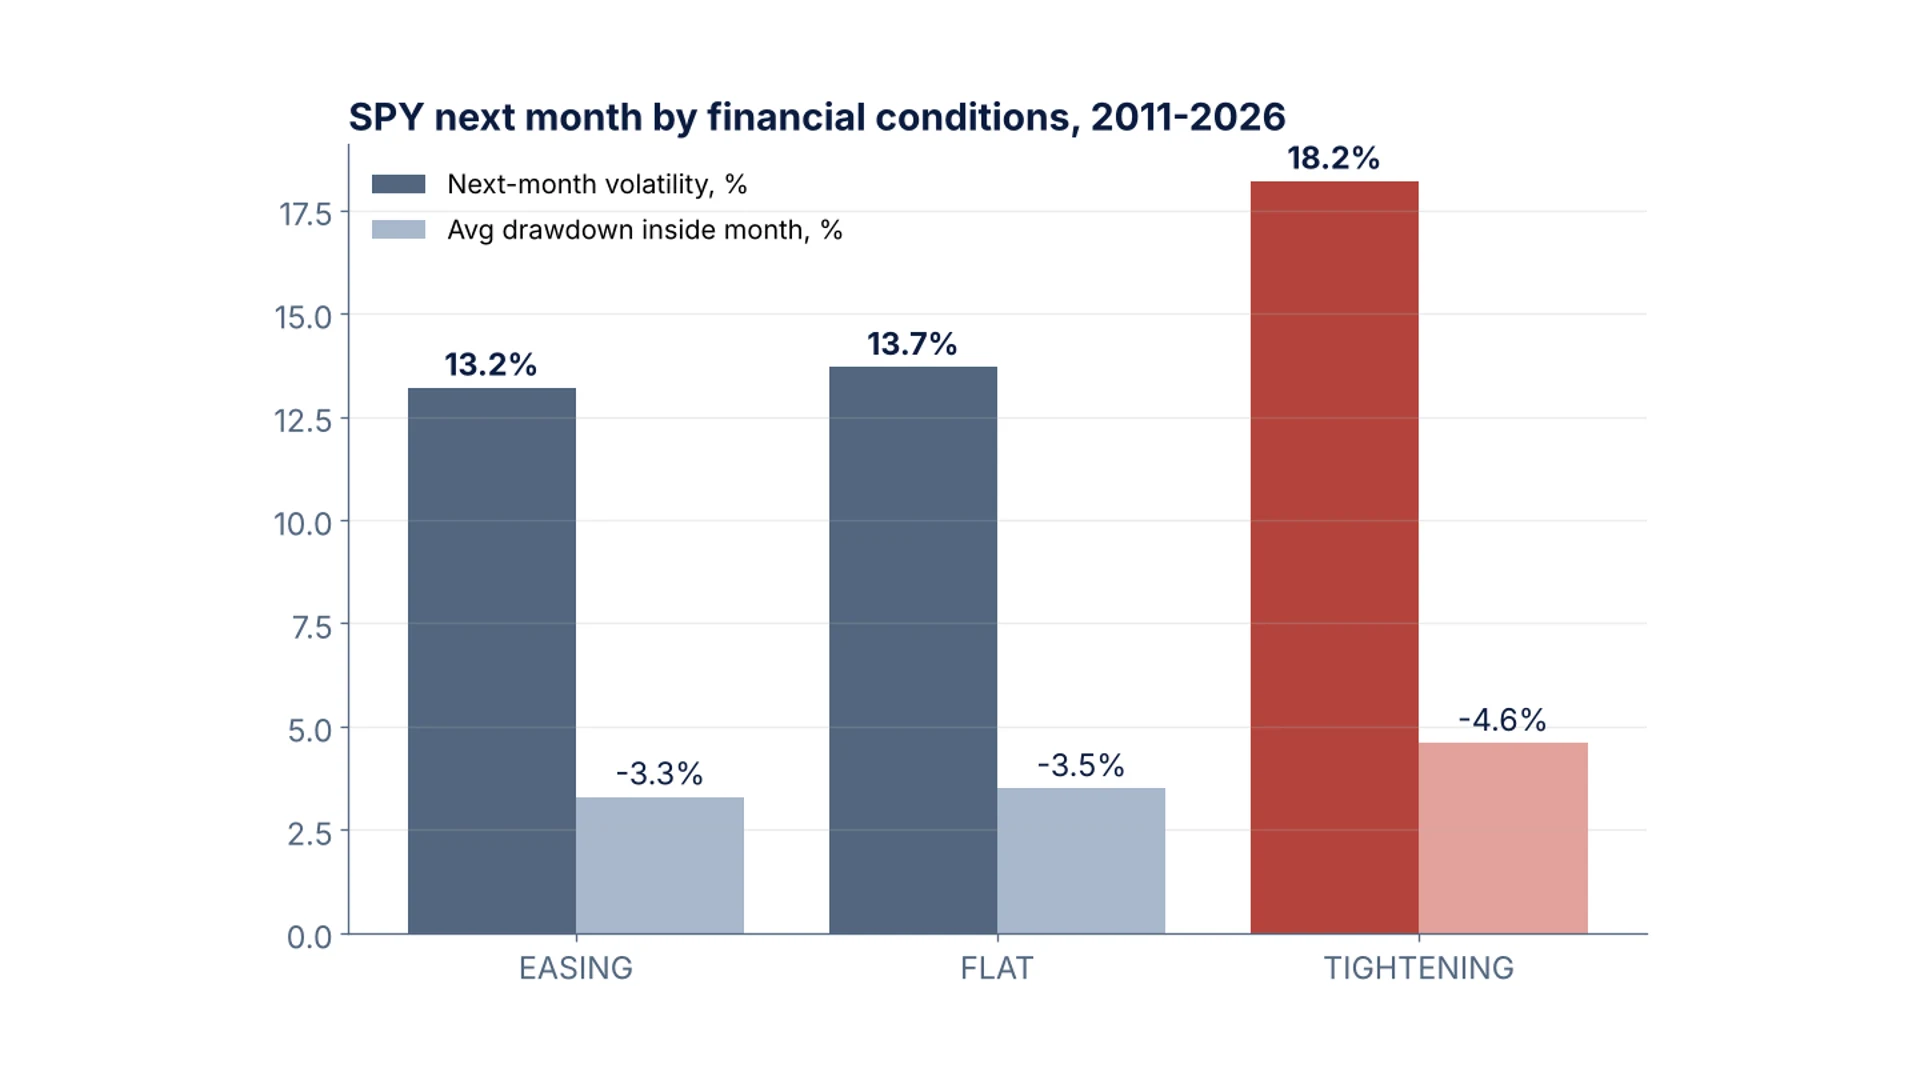
S&P 500 next-month volatility and drawdown by label, 2011-2026
Since 2011, the month after a TIGHTENING reading was choppier: S&P 500 volatility averaged 18.2% versus 13.3% after EASING readings, and the average drawdown inside the month was -4.6% versus -3.3%.
3. Average returns did not fall, but misses rose
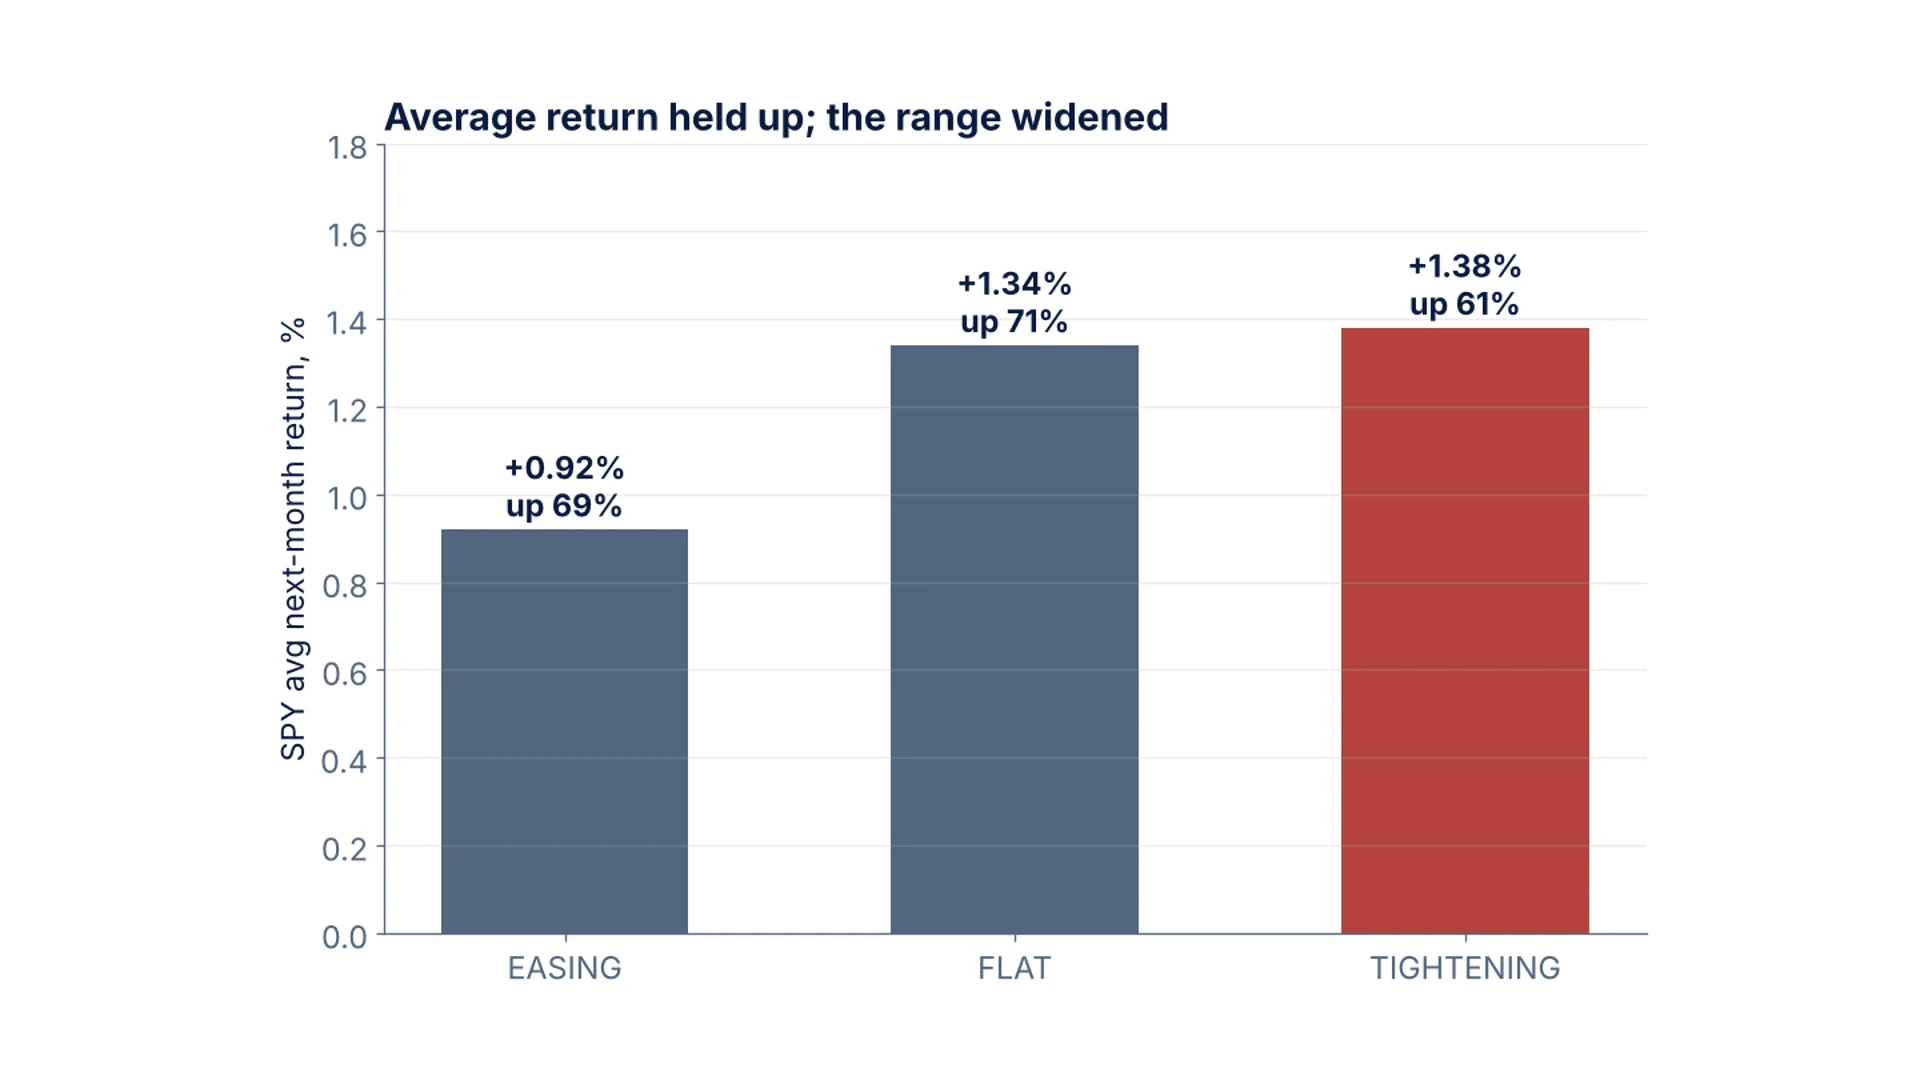
S&P 500 average next-month return and hit rate by label
Average next-month returns were +1.37% after TIGHTENING versus +0.92% after EASING, but the index was up in 61% of following months versus 69%. In 39 flips of the risk subindex to tightening, the next month averaged +1.76%, up 67%.
4. Goldilocks returns after a Stagflation run
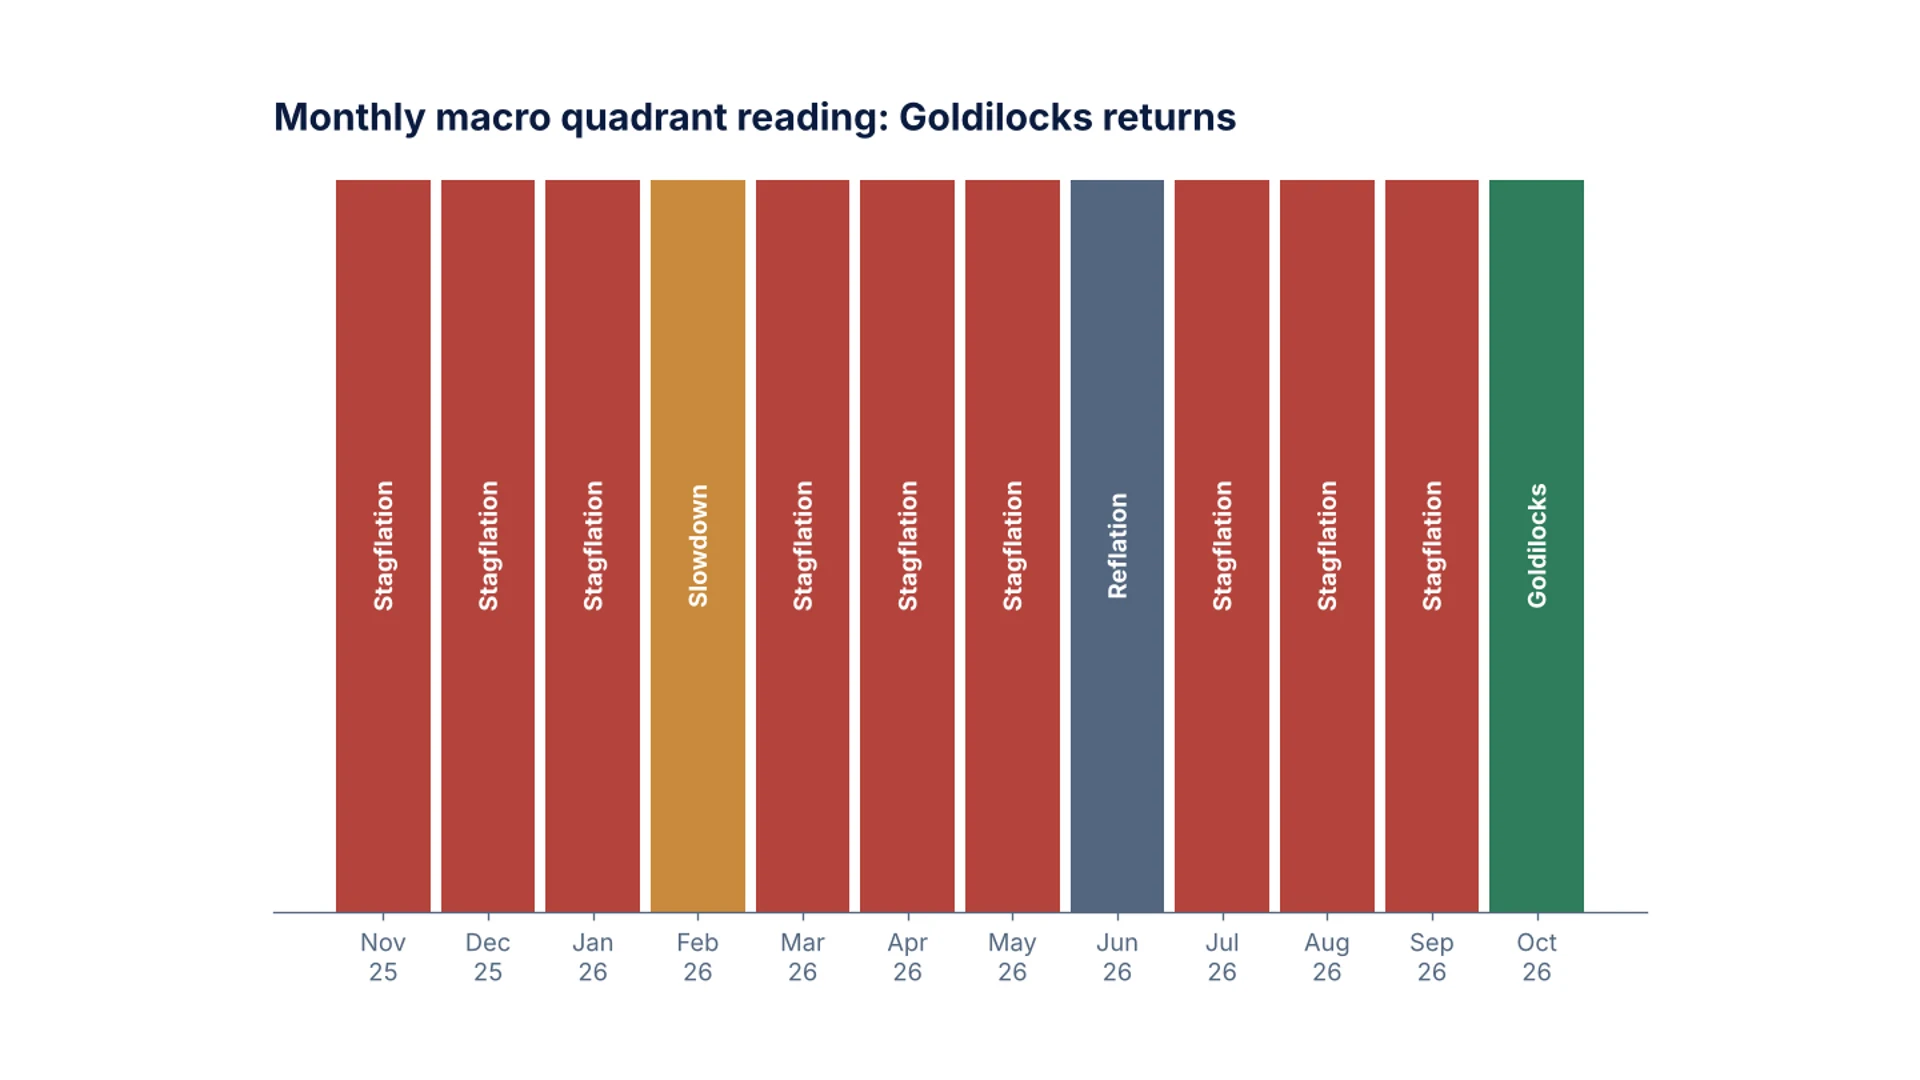
Monthly macro quadrant readings, last 12 months
The monthly macro quadrant (August data, read 15 October 2026) flipped to GOLDILOCKS: growth at or above trend (CFNAI 3-month average +0.01) and core PCE inflation not rising (3.01% year over year, direction FALLING). 9 of the previous 11 readings were STAGFLATION.
5. Goldilocks has the best record of the 4 quadrants
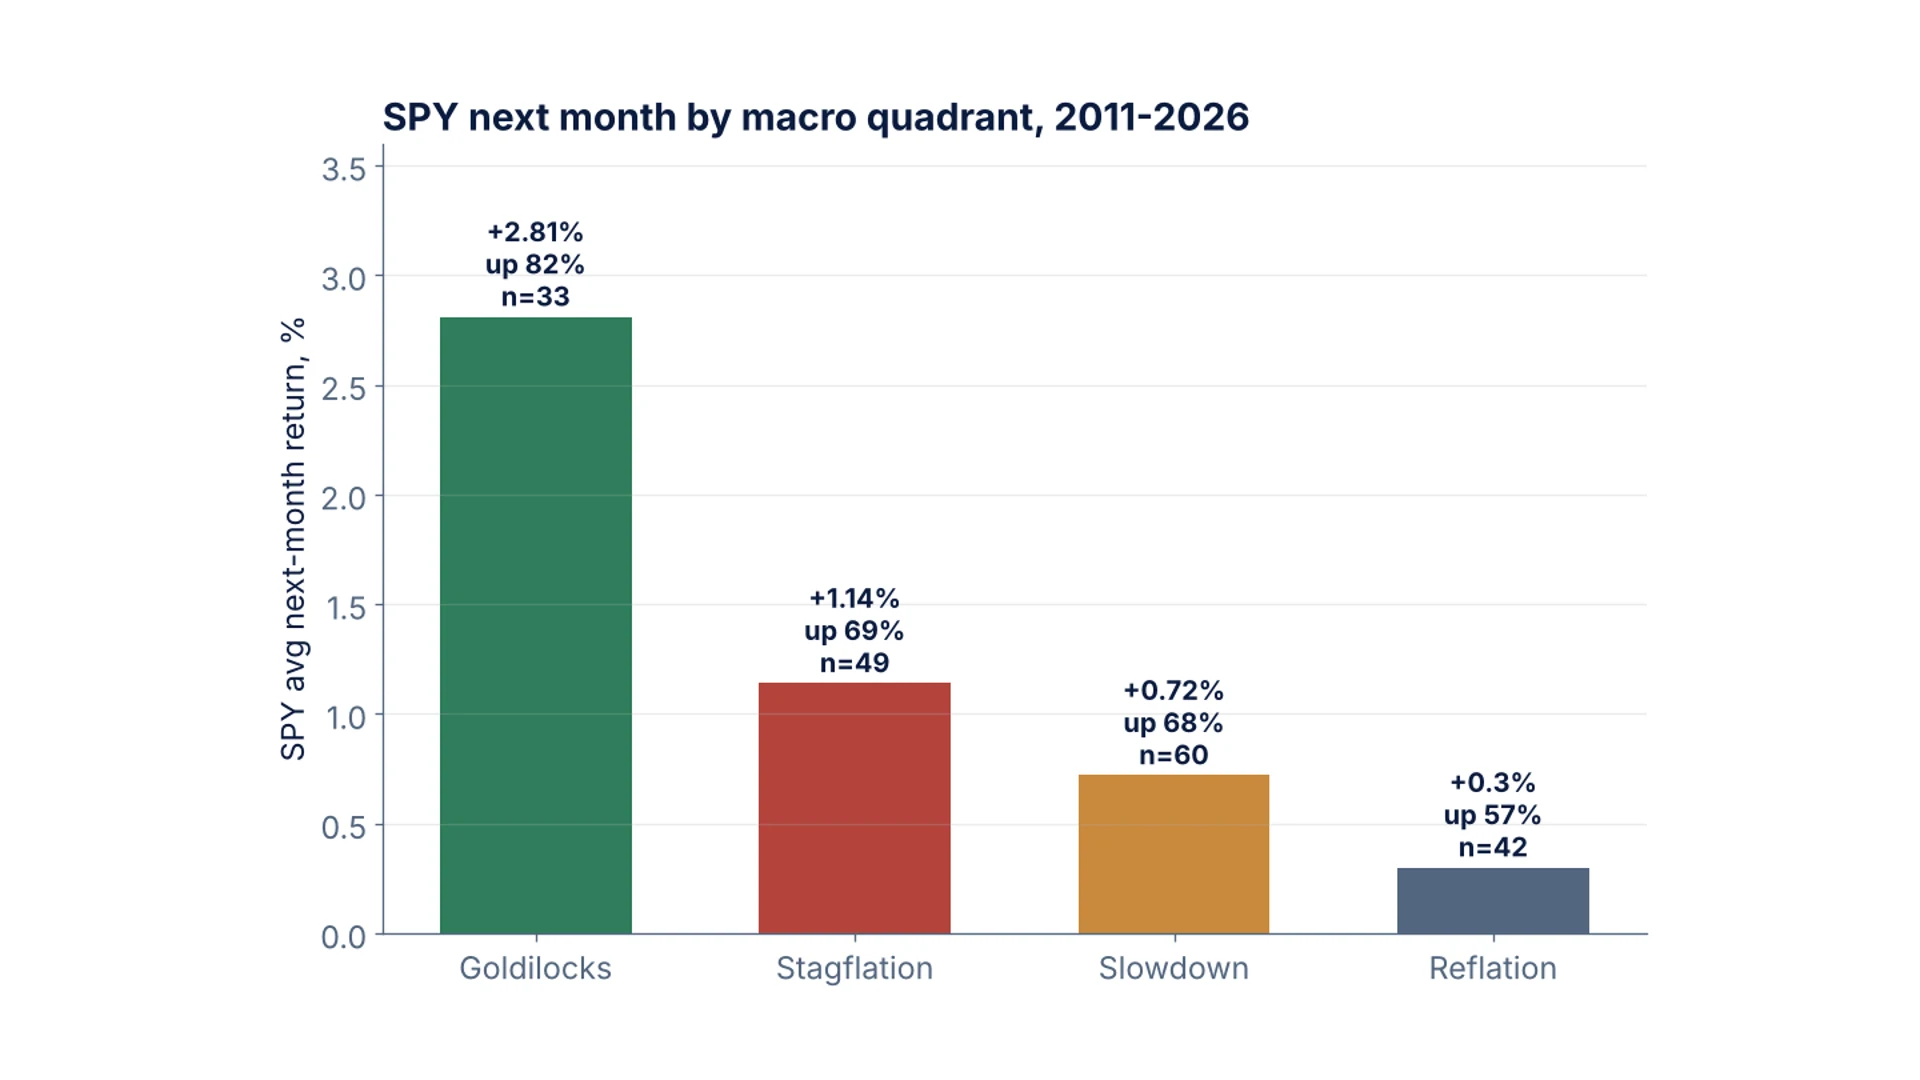
S&P 500 next month by macro quadrant, 2011-2026
Across 33 Goldilocks months since 2011, the S&P 500 rose +2.83% the next month on average and was up 76% of the time; over 3 months it averaged +4.40%, up 88%. Stagflation (49 months) +1.12%, Slowdown (60) +0.73%, Reflation (42) +0.31%, up 57%. Growth flips to ABOVE_TREND (18 cases) were followed by +2.57%, up 72%; inflation flips to FALLING (30 cases) by +1.39% the next month, up 73%, but only +1.08% over 3 months.
6. What to watch: the September nowcast says Reflation
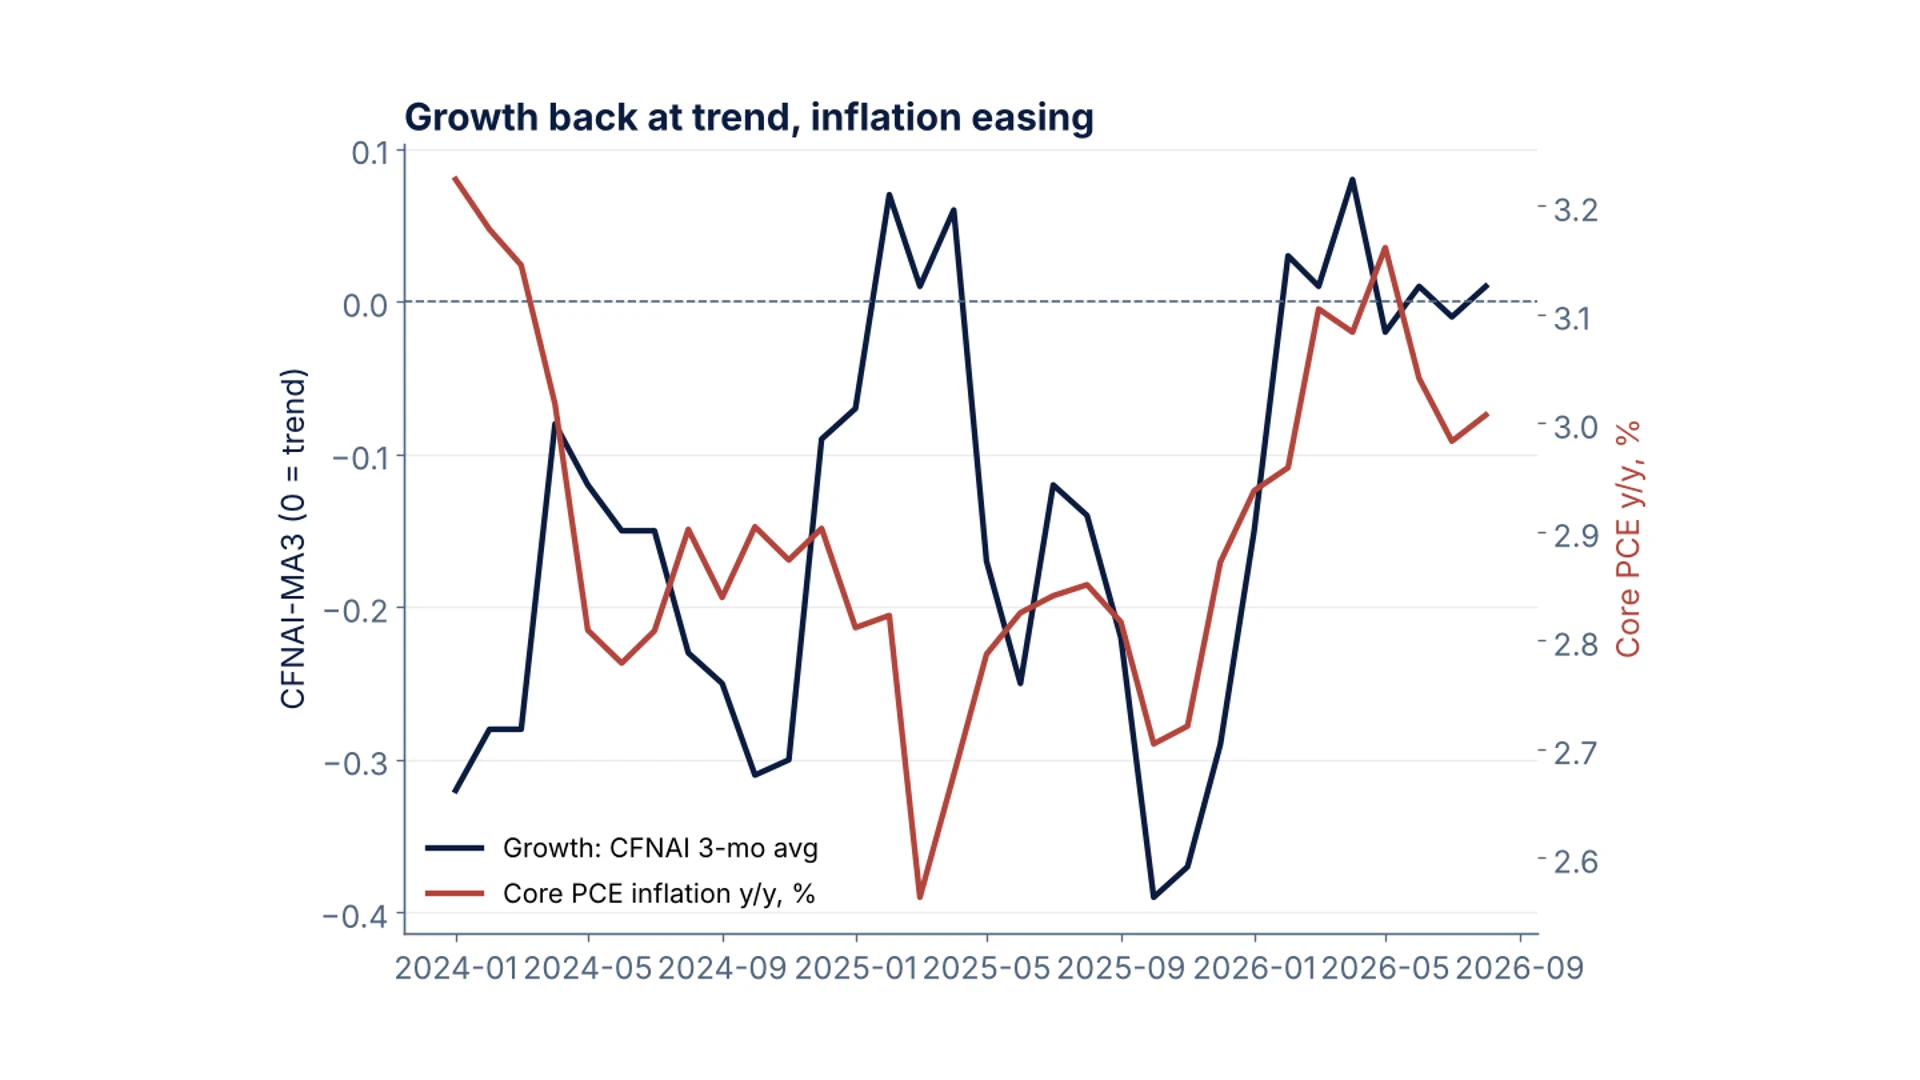
Growth (CFNAI 3-month average) and core PCE inflation since 2024
The nowcast estimates September growth above trend (0.085) and accelerating, with core PCE near 3.08%. That would make September a REFLATION reading, historically the weakest quadrant (+0.31% next month, up 57%). Labels are computed from each input as published on that date (ALFRED vintages), so the history has no later revisions; samples are small and windows overlap, so these are base rates, not forecasts.
Frequently asked questions
Are US financial conditions tightening in October 2026?
Yes, by direction. The FinzData Quantitative Model reads financial conditions as TIGHTENING for a 2nd week. The Chicago Fed NFCI rose 6 weeks in a row to -0.499 on 9 October 2026 but is still below 0, so conditions remain looser than average.
What macro regime is the US economy in?
The model's latest monthly macro quadrant (August data, read 15 October 2026) is GOLDILOCKS: growth at or above trend and core PCE inflation not rising. Its nowcast for September reads REFLATION.
How has the S&P 500 done after Goldilocks readings?
From 2011 to 2026, after 33 Goldilocks months the S&P 500 rose +2.83% the next month on average and was up 76% of the time; over 3 months +4.40%, up 88%. These are base rates from small samples, not forecasts.
What happens to the S&P 500 when financial conditions tighten?
Since 2011, next-month volatility averaged 18.2% after TIGHTENING readings versus 13.3% after EASING, and the average drawdown inside the month was -4.6% versus -3.3%. Average returns did not fall (+1.37% vs +0.92%).
How can I get these readings?
From the FinzData Quantitative Model API (/v1/model/latest, /v1/model/labels, /v1/model/nowcast, /v1/model/stress), the Python client, or the get_quant_model tool on the FinzData MCP server for AI assistants.
Download the deck (PDF, 6 slides) More research
Built for AI, quants, data scientists and financial analysts who backtest. Clean data. Real insights. Real alpha. finzdata.com. This material is for information only and is not investment advice.
Get FinzData research free, every morning
The daily brief: what moved, the macro releases that matter, positioning and liquidity, with charts. One email a day, free, unsubscribe anytime.
Topics and related searches
Quant models and market regimes Federal Reserve and monetary policy Interest rates and Treasury yields Equity strategy and factors Inflation and CPI
People also search
- will sp500 rise after goldilocks
- why are financial conditions tightening october 2026
- is us economy in goldilocks now
- what is nfci reading october 2026
- how to get finzdata quantitative model data
- when will mortgage rates go down 2027
- are financial conditions tightening in october 2026
- what is the macro quadrant for august 2026
- does goldilocks regime predict sp500 returns
- sp500 next month returns after tightening
- historical nfci chart 2024 2026
- download cfna i data csv