
FinzData Research · Published 20 October 2026
The big freeze: 7.4% mortgages, a 14-year low in builder confidence, and a Fed that may hike again
Three housing releases in two days said the same thing: high mortgage rates have frozen US housing. We put sales, starts, builder sentiment, inventory, prices and rents in context with point-in-time data, ask whether housing can afford another Fed hike, show which housing stocks have priced it in, and test whether permits predict homebuilder stocks.
Get FinzData research free, every morning
The daily brief: what moved, the macro releases that matter, positioning and liquidity, with charts. One email a day, free, unsubscribe anytime.
Contents
- Three releases in two days, one message: housing is freezing
- It starts with rates: mortgages at a three-year high
- The Fed is hiking into a housing freeze
- Can housing afford another hike? The median family is already short
- Builders are pulling back
- The glut: the most finished, unsold new homes since 2009
- A new home now costs less than a used one
- Builders are buying sales with price cuts
- Existing homes: slowest stretch of 2026, contracts point lower
- Who is still buying
- Prices have stalled, not crashed
- Rents are cooling, which helps inflation, slowly
- The pipeline is draining
- The market has priced the freeze, unevenly
- Permits are a weak signal for homebuilder stocks
- Our read: housing can't take much more
- What to watch
- The data behind this deck
- Frequently asked questions
1. The Big Freeze
FinzData Research, US housing, October 2026.
Three housing releases in two days (builder sentiment on October 19, housing starts and pending home sales on October 20) told the same story. This deck asks what they mean, including whether housing can afford another Fed rate hike, and puts them in context with Census, BLS and Treasury data kept point-in-time in the FinzData store, the licensed Case-Shiller index, NAR's existing-home figures and daily prices for homebuilder and housing stocks.
2. Three releases in two days, one message: housing is freezing
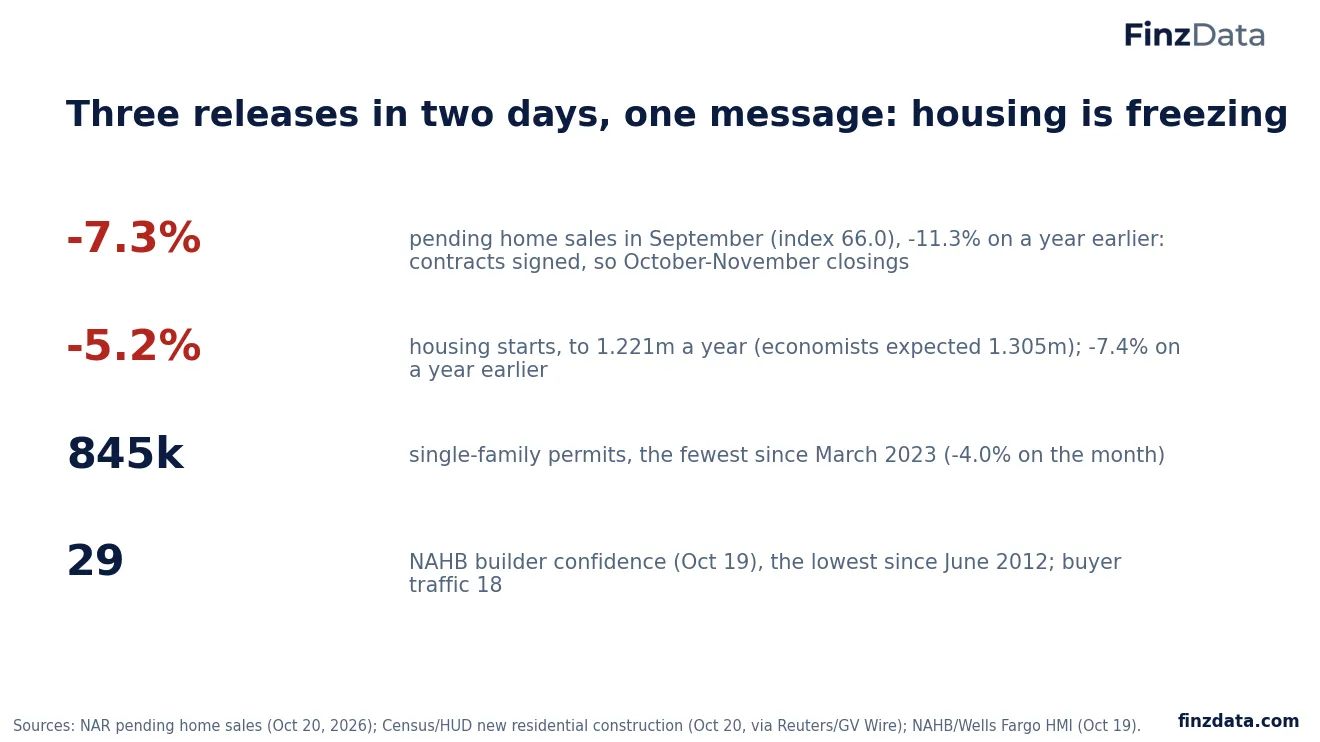
The October 19-20 releases.
Pending home sales, contracts signed in September that will close in October and November, fell 7.3% to an index of 66.0 and were 11.3% lower than a year earlier, with every region down. Housing starts fell 5.2% to 1.221 million a year, well below the 1.305 million economists expected, and single-family permits fell to 845,000, the fewest since March 2023. NAHB builder confidence fell to 29, the lowest since June 2012.
3. It starts with rates: mortgages at a three-year high
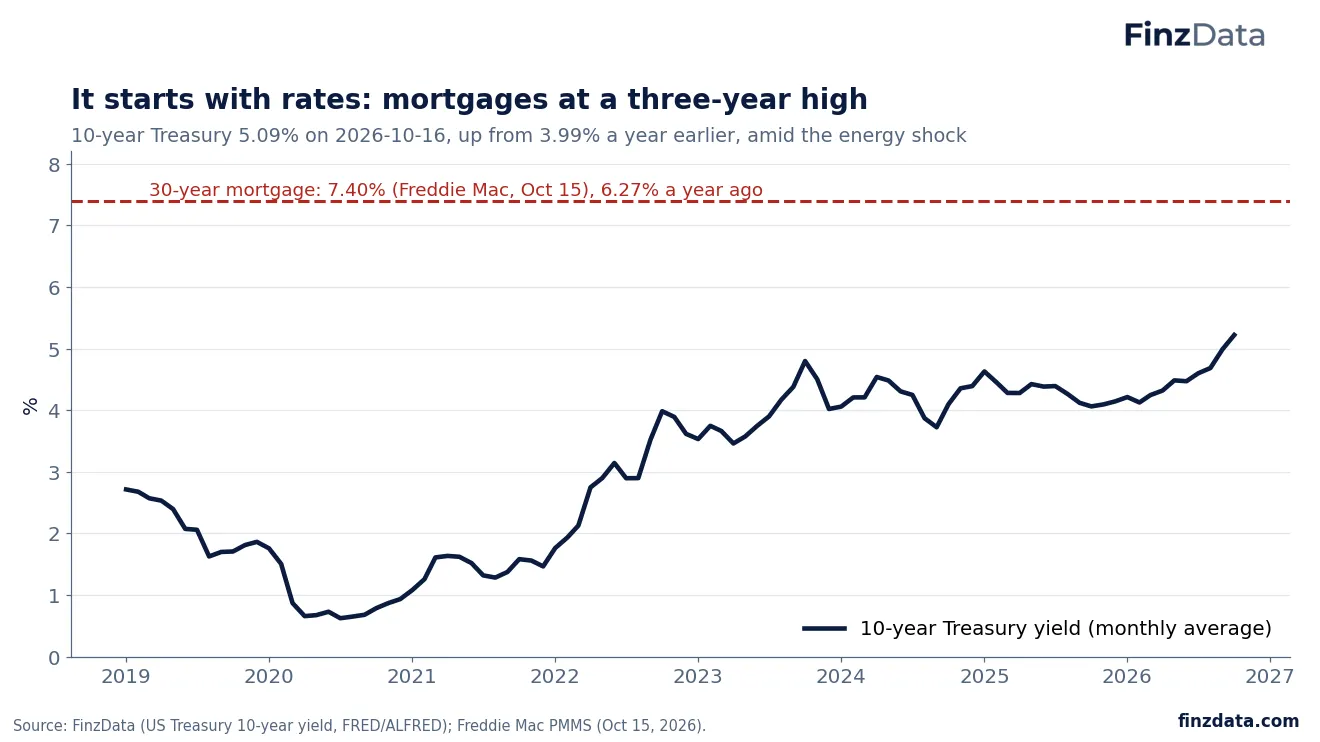
10-year Treasury yield and the 30-year mortgage rate.
Freddie Mac's 30-year fixed rate averaged 7.40% in the week of October 15, against 6.27% a year earlier and its highest in nearly three years. Mortgage rates follow the 10-year Treasury, which was 5.09% on 2026-10-16 against 3.99% a year earlier, as the energy shock pushed inflation and yields up. NAR's Lawrence Yun said conditions weakened 'due to fast-rising mortgage rates'.
4. The Fed is hiking into a housing freeze
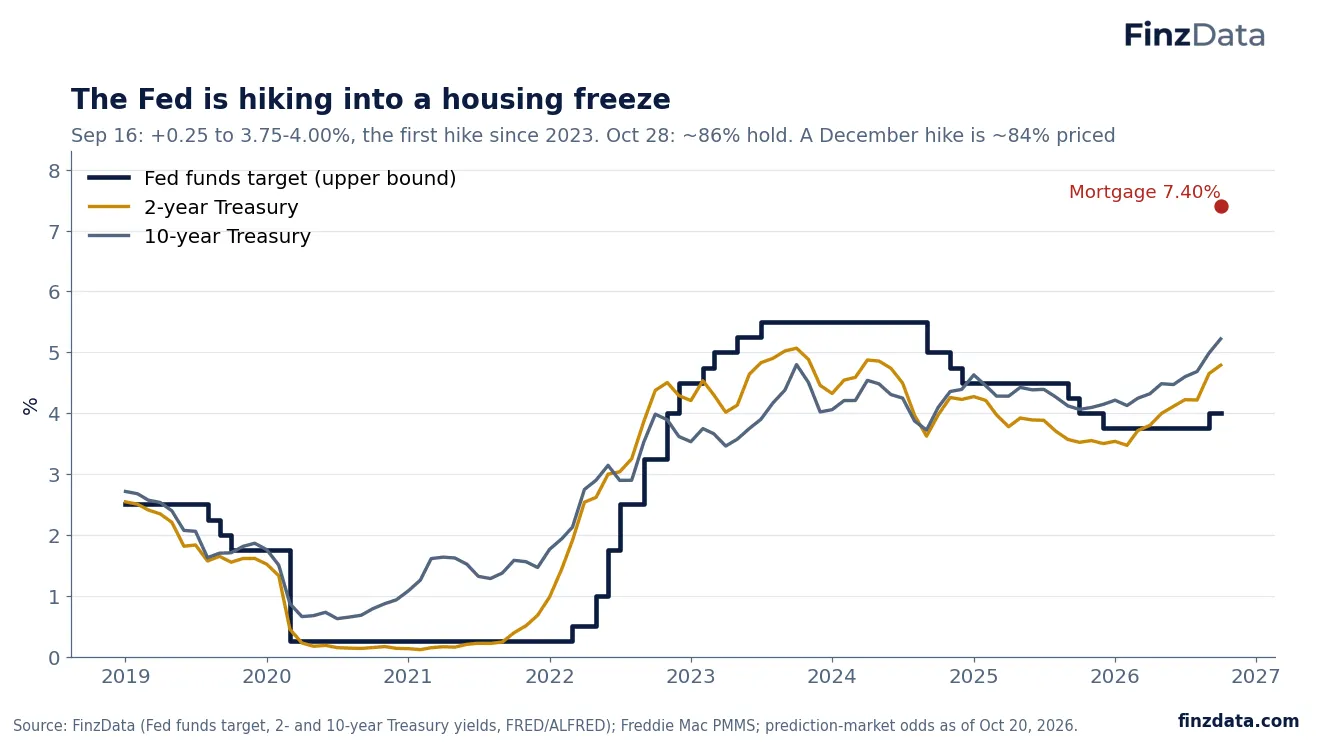
Fed funds target, 2- and 10-year Treasury yields, and the mortgage rate.
The Fed raised its target by 0.25 point to 3.75-4.00% on September 16, its first hike since July 2023, after cutting from 5.50% to 3.75% between September 2024 and December 2025. Chair Kevin Warsh said inflation 'is too high, and has been for too long', and 16 of 18 officials expected another hike this year. Headline CPI was 3.7% in September (core 2.6%), pushed up by energy prices from the Iran conflict. As of October 20, futures and prediction markets put about 86% on a hold at the October 28 meeting and about 84% on rates being higher after the December 9 meeting.
5. Can housing afford another hike? The median family is already short
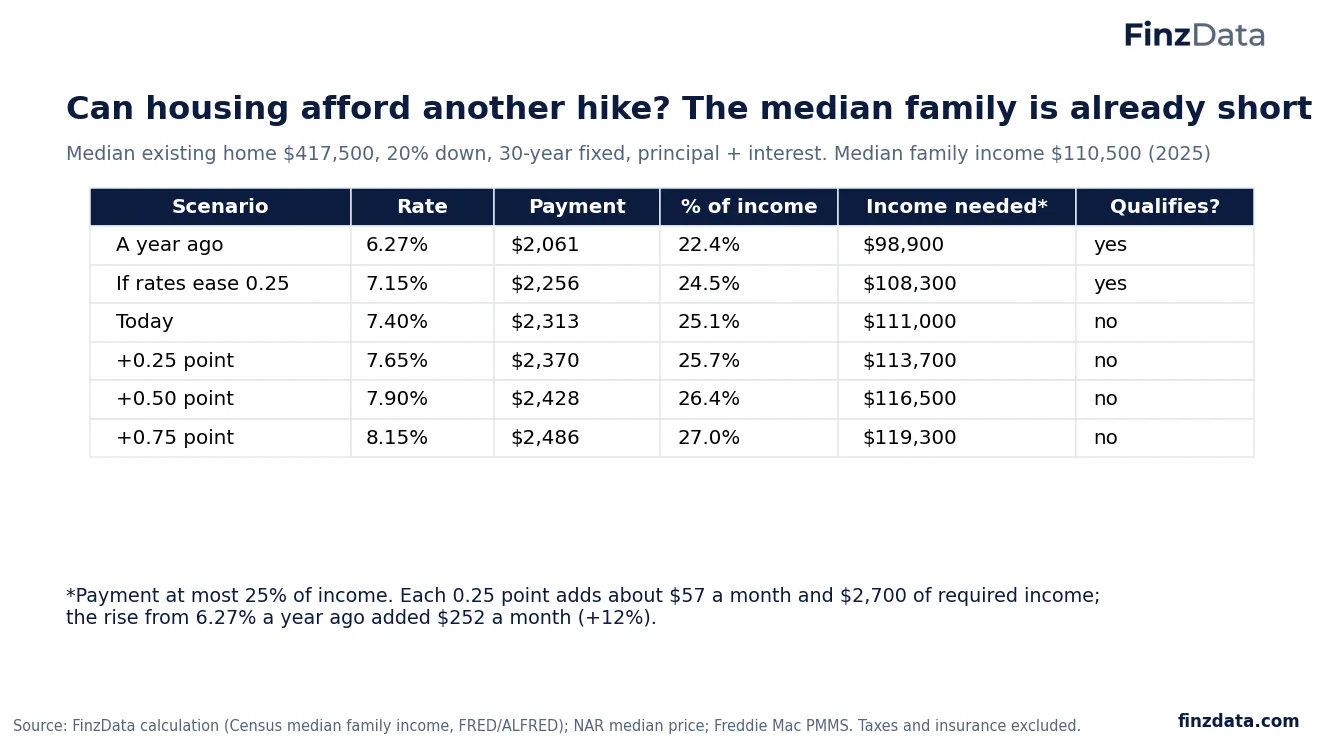
Monthly payment on the median existing home at different mortgage rates.
On a median-priced existing home ($417,500) with 20% down, principal and interest cost $2,061 a month at last year's 6.27% rate and $2,313 at today's 7.40%: $252 more (+12%). Under the usual rule that the payment should be at most 25% of income, that needs $111,000 a year, just above the $110,500 median family income (2025). Each further 0.25 point adds about $57 a month and $2,700 of required income; at 8.15% the payment would be $2,486, 27.0% of median family income. Taxes and insurance would add to all of these.
6. Builders are pulling back
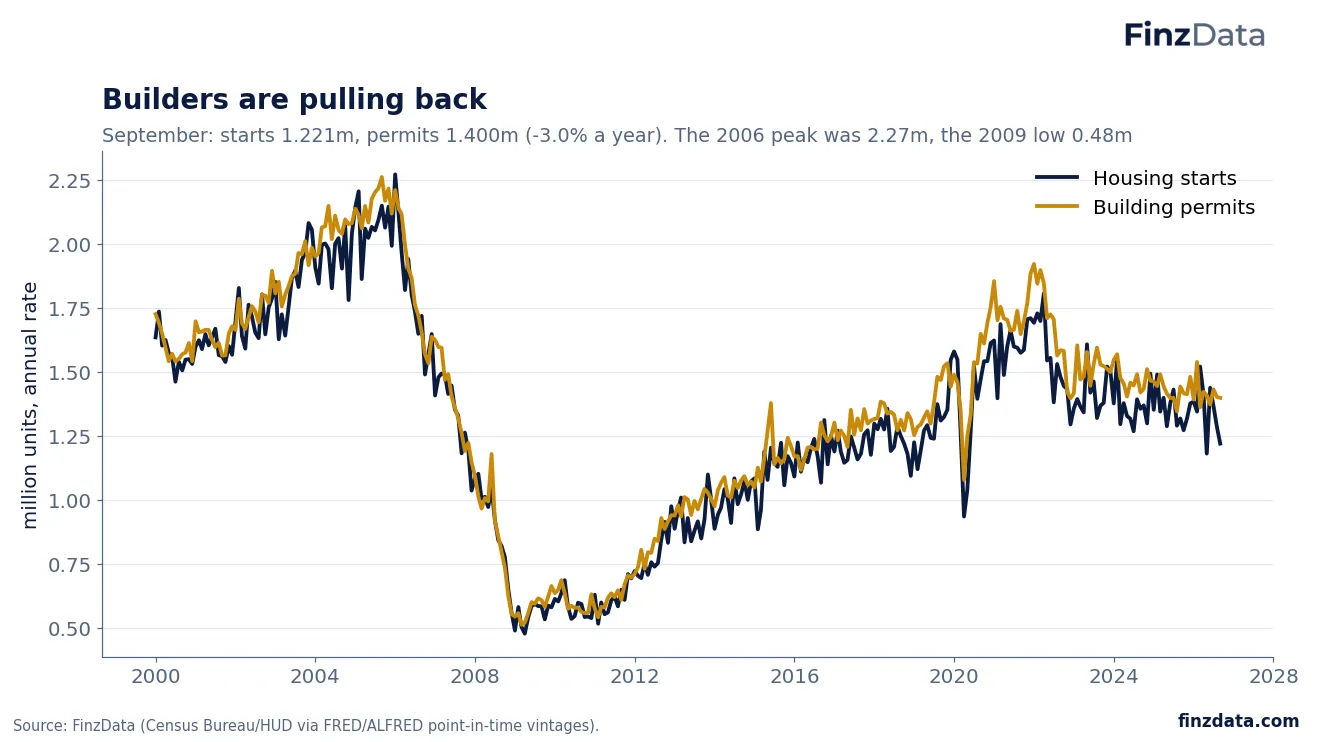
Housing starts and building permits since 2000.
Starts were 1.221 million a year in September (-7.4% on a year earlier) and permits 1.400 million (-3.0%). That is far from the 2009 low of 0.48 million but well below the 2006 peak of 2.27 million. Single-family starts fell 4.6% to 859,000 and multifamily starts 7.2%.
7. The glut: the most finished, unsold new homes since 2009
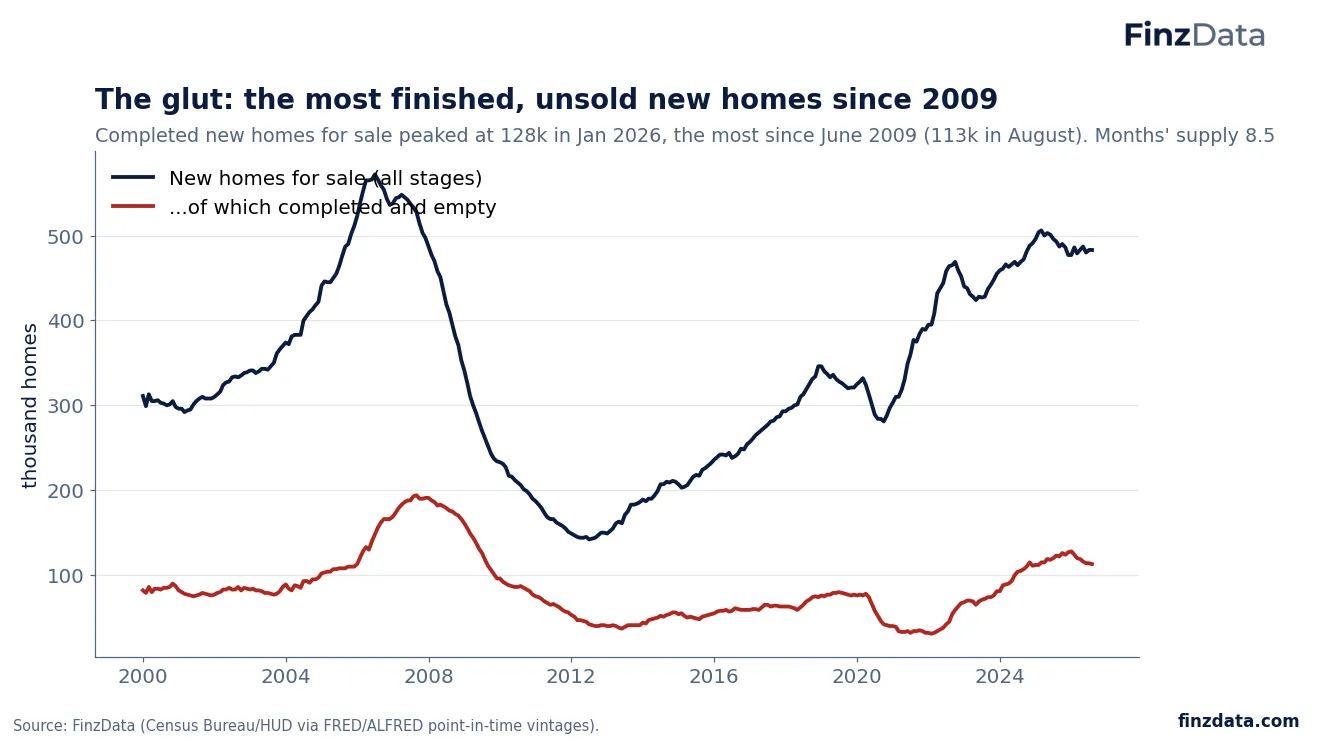
New homes for sale, all stages and completed.
Builders hold 483,000 new homes for sale (8.5 months of supply in August). The number already finished and empty peaked at 128,000 in January 2026, the most since June 2009, and was 113,000 in August. That overhang is why builders are starting fewer homes.
8. A new home now costs less than a used one
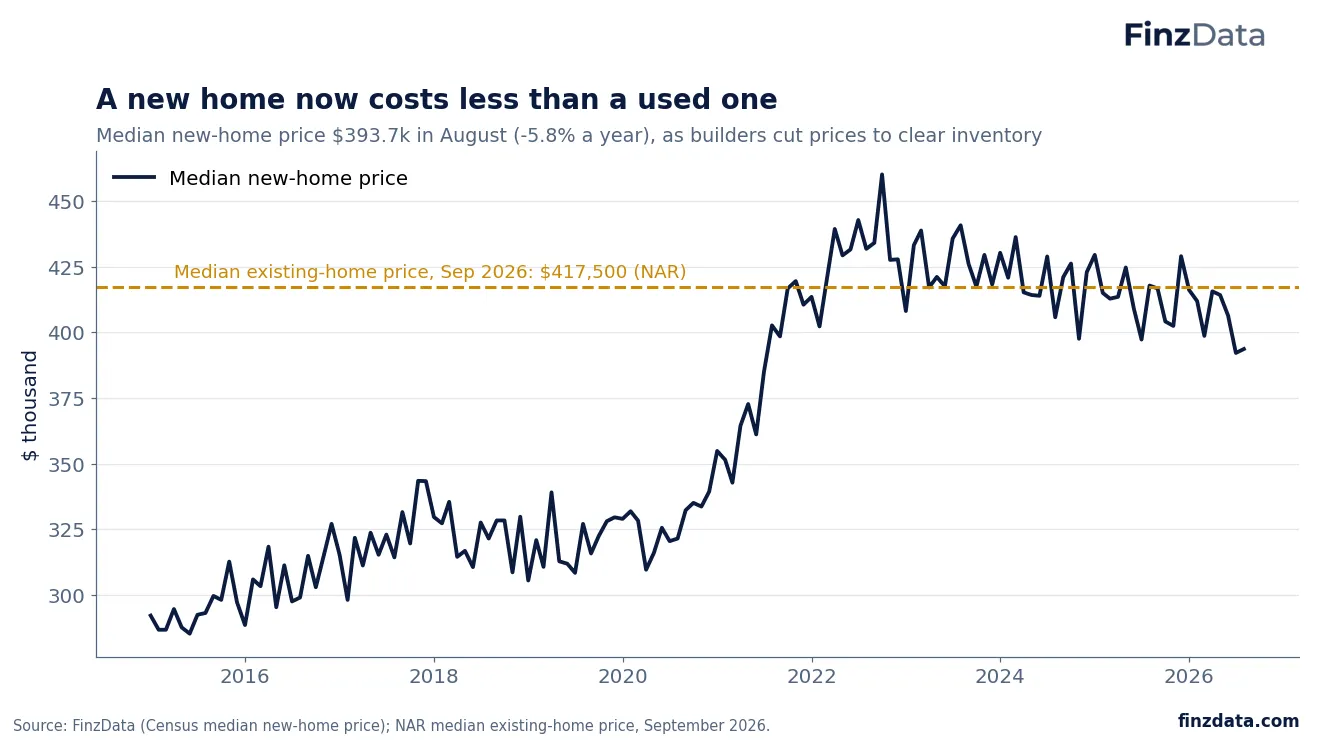
Median new-home price vs the median existing-home price.
The median new home sold for $393,700 in August (-5.8% on a year earlier), below the $417,500 median existing home in September. Builders can cut prices and buy down mortgage rates; existing owners sitting on low-rate mortgages mostly cannot or will not.
9. Builders are buying sales with price cuts
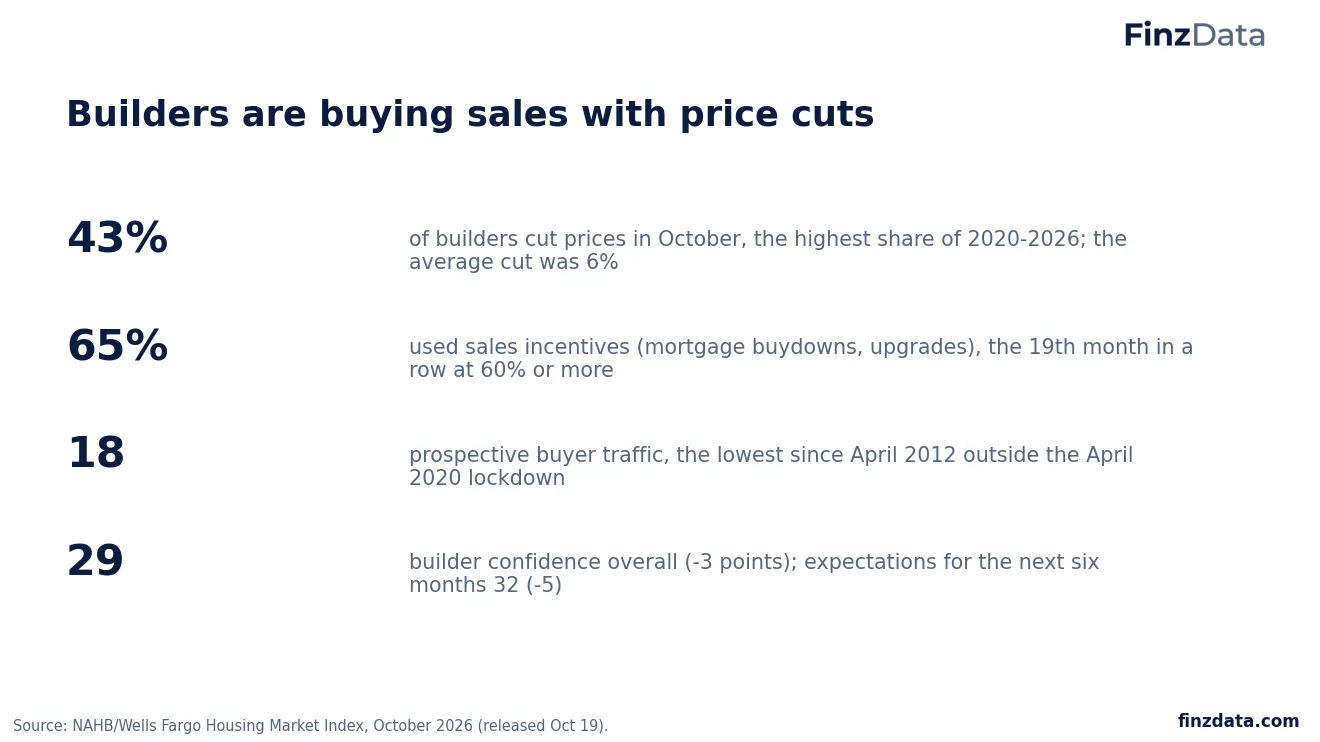
NAHB/Wells Fargo HMI, October 2026.
43% of builders cut prices in October, the highest share in the 2020-2026 period, by an average of 6%, and 65% used incentives such as mortgage-rate buydowns. Prospective buyer traffic fell to 18, the lowest since April 2012 apart from the April 2020 lockdown, and expectations for the next six months fell 5 points to 32.
10. Existing homes: slowest stretch of 2026, contracts point lower
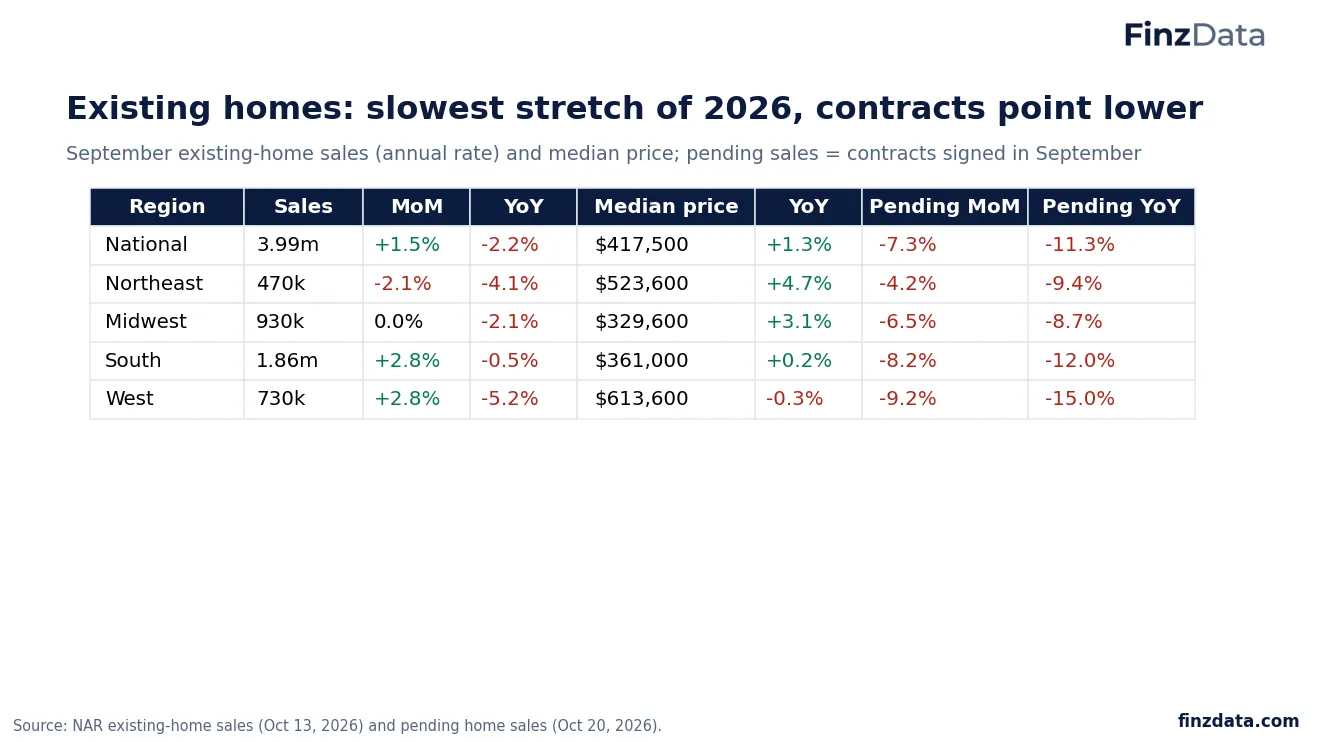
September existing-home sales, prices and pending sales by region.
Existing-home sales rose 1.5% to 3.99 million a year in September, but August and September were the two slowest months of 2026 and sales were 2.2% lower than a year earlier. The median price was $417,500 (+1.3%), the 39th straight annual gain, with the West slightly negative. Pending sales fell in every region, most in the West (-9.2% on the month, -15.0% on the year).
11. Who is still buying
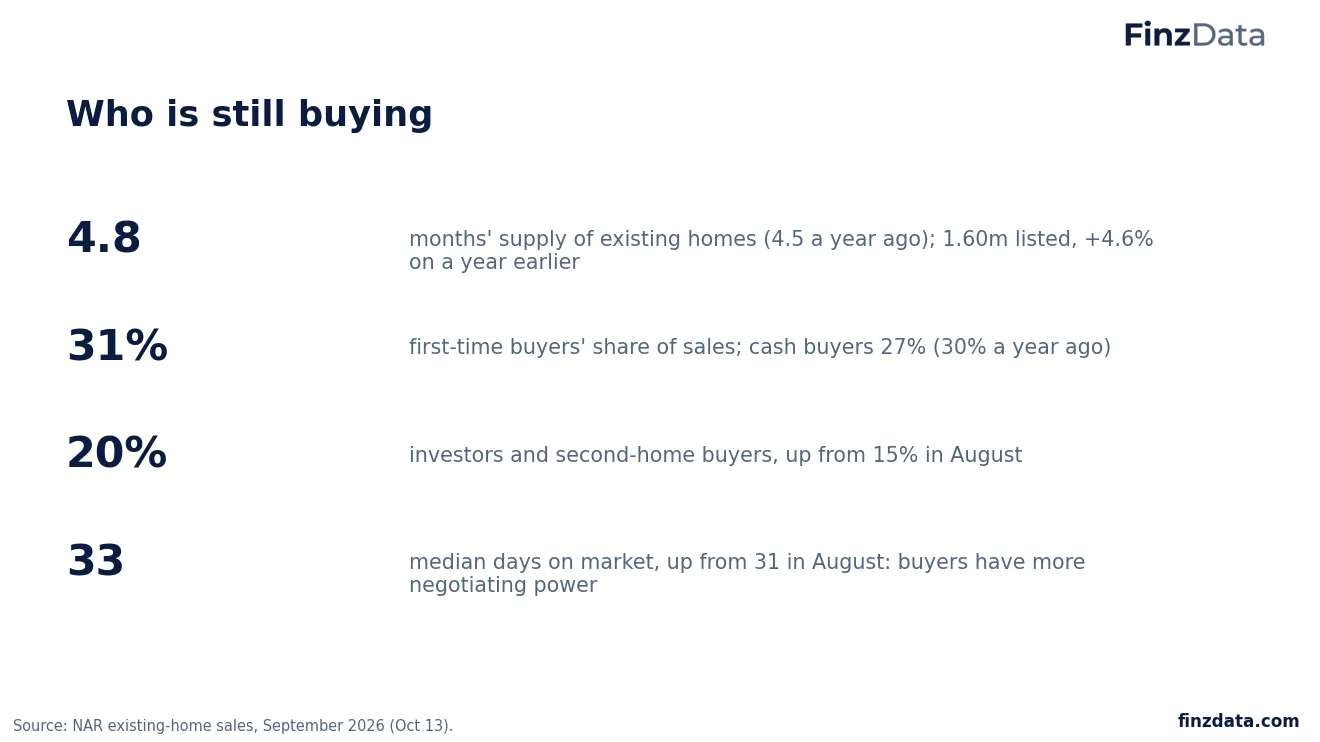
September existing-home buyers.
Supply is rising: 1.60 million homes listed (+4.6% on a year earlier), 4.8 months of supply against 4.5, and 33 days on market. First-time buyers were 31% of sales, cash buyers 27% and investors and second-home buyers 20%, up from 15% in August. NAR says higher inventory and longer days on market give buyers more negotiating power.
12. Prices have stalled, not crashed
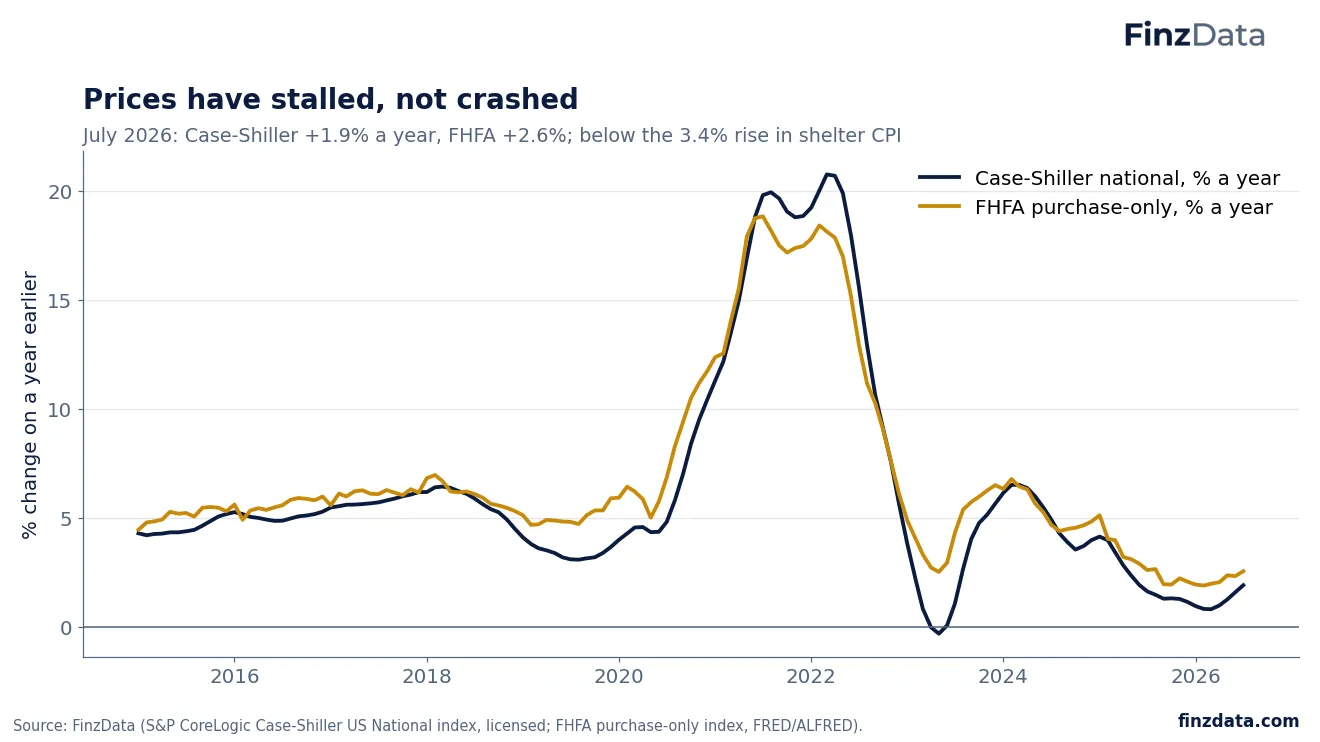
Case-Shiller national and FHFA purchase-only indexes, annual change.
In July 2026 the Case-Shiller national index was +1.9% on a year earlier and the FHFA purchase-only index +2.6%, after 15-20% gains in 2021-2022. With consumer prices rising 3.7% a year, house prices are already falling in real terms; with mortgages above 7%, that improves affordability only slowly.
13. Rents are cooling, which helps inflation, slowly
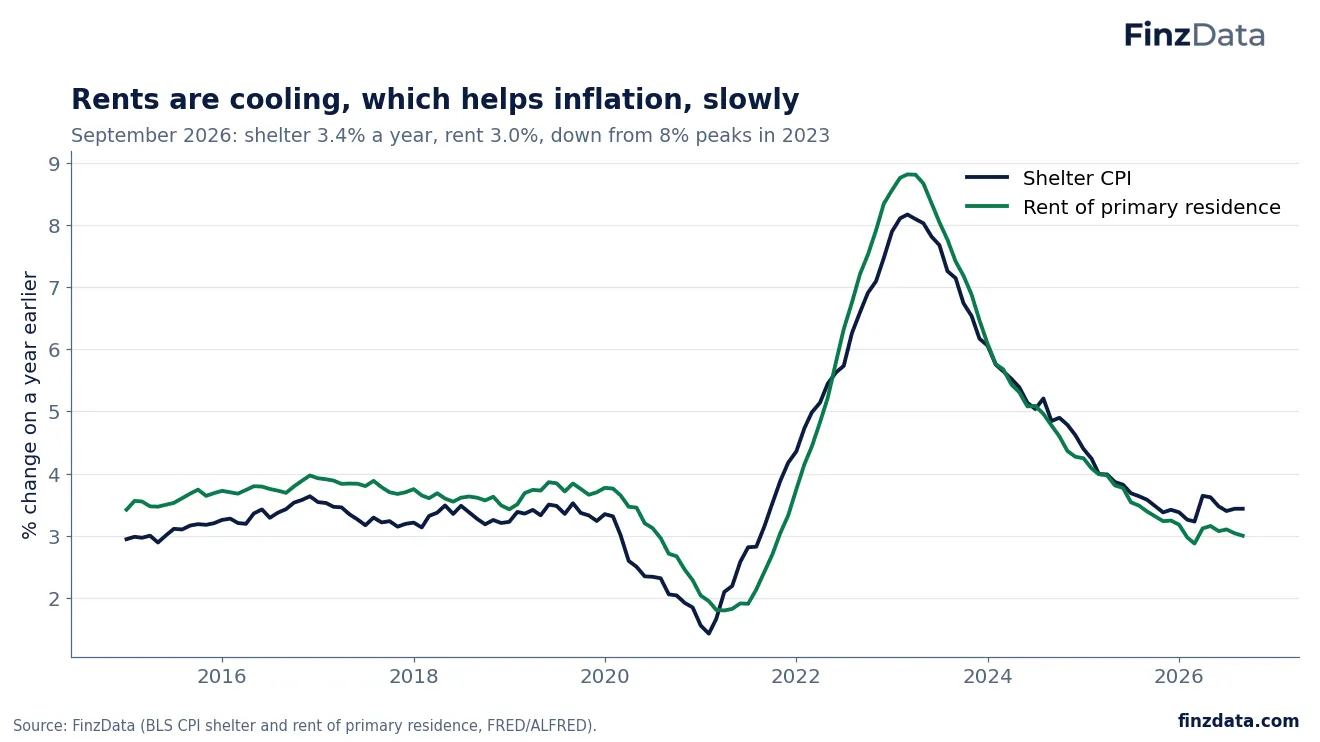
Shelter CPI and rent of primary residence, annual change.
Shelter inflation was 3.4% in September and rent 3.0%, down from peaks around 8% in 2023. Shelter is about a third of the CPI basket, so slower rents keep pulling core inflation down even as energy pushes the headline up.
14. The pipeline is draining
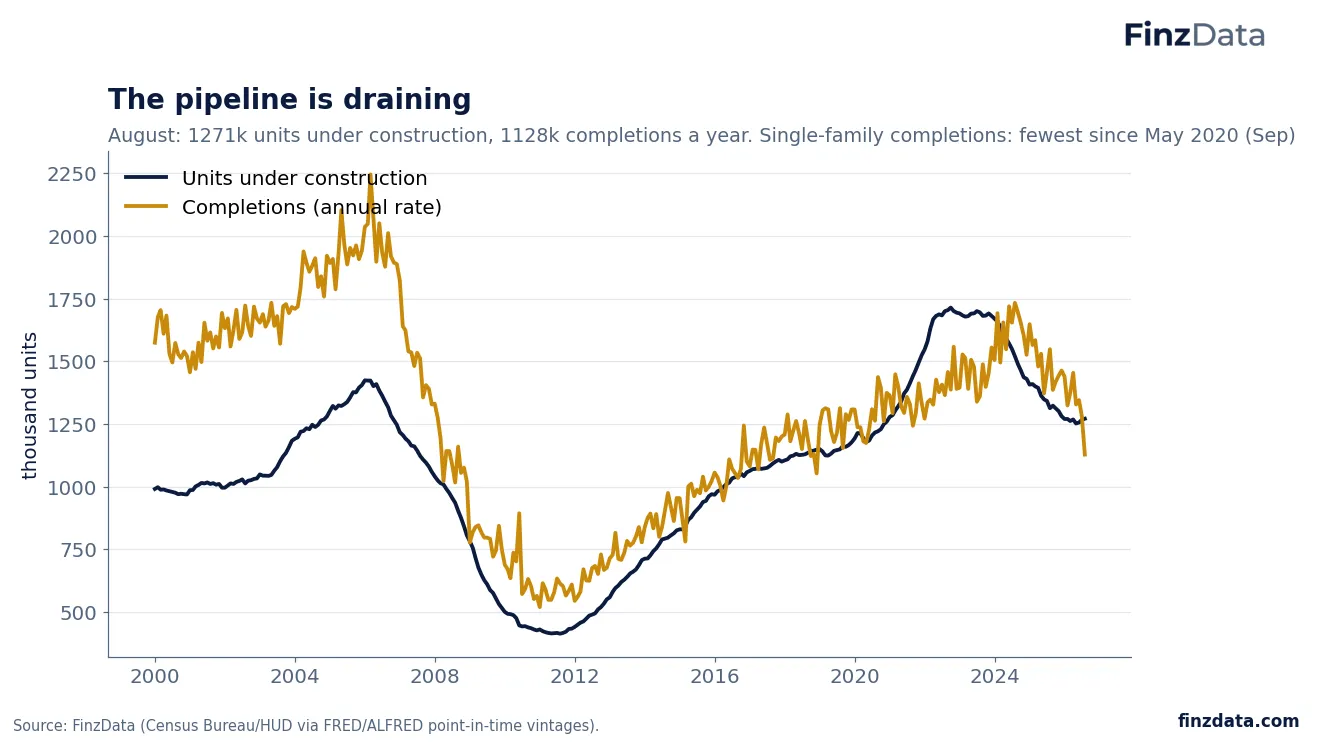
Units under construction and completions.
1271,000 units were under construction in August and completions ran at 1128,000 a year, well below the 2023 peak as the apartment boom ends. Single-family completions in September were the fewest since May 2020 and 151,000 homes are authorized but not yet started, near a 4.5-year high.
15. The market has priced the freeze, unevenly
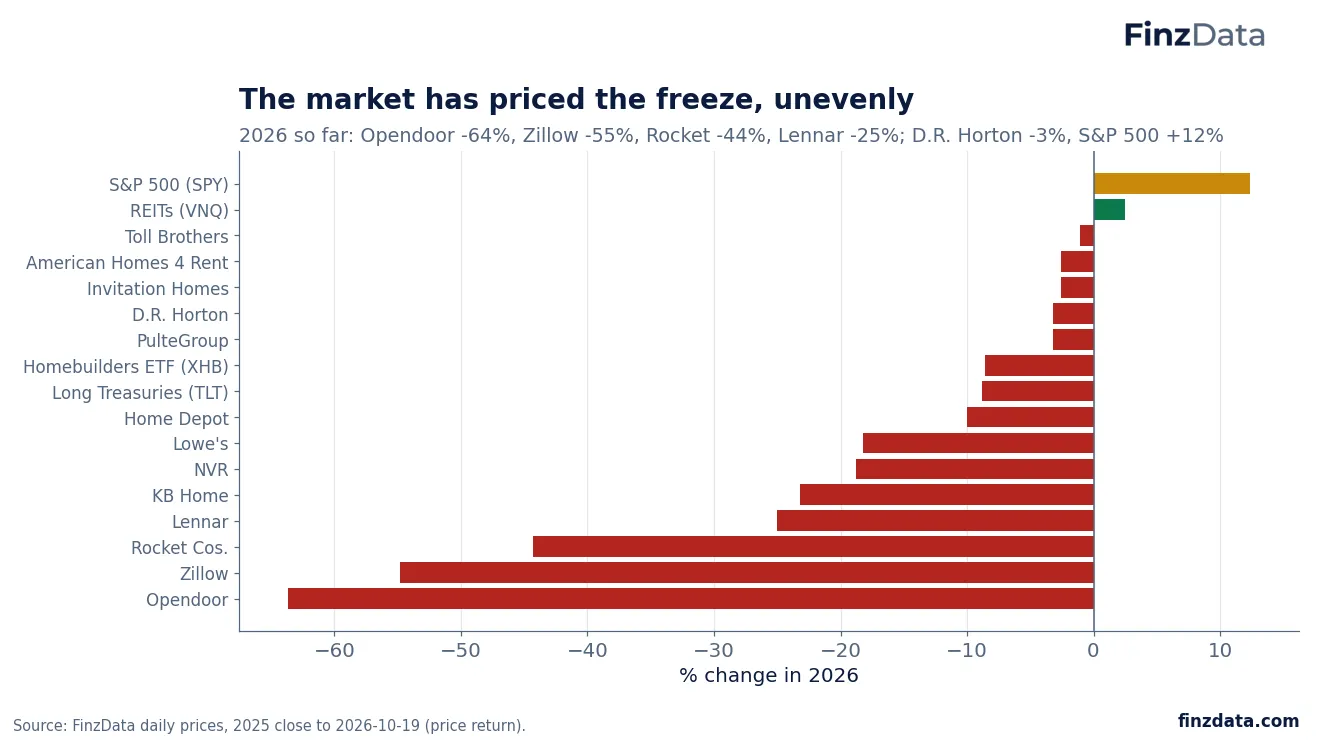
Housing-related stocks in 2026 so far.
From the 2025 close to October 19: Opendoor -64%, Zillow -55%, Rocket -44%, Lennar -25%, KB Home -23%, NVR -19%, Lowe's -18% and Home Depot -10%. The biggest builders held up better (D.R. Horton -3%, PulteGroup -3%, Toll -1%) and the homebuilders ETF XHB is -9%, against the S&P 500 +12% and long Treasuries (TLT) -9%.
16. Permits are a weak signal for homebuilder stocks
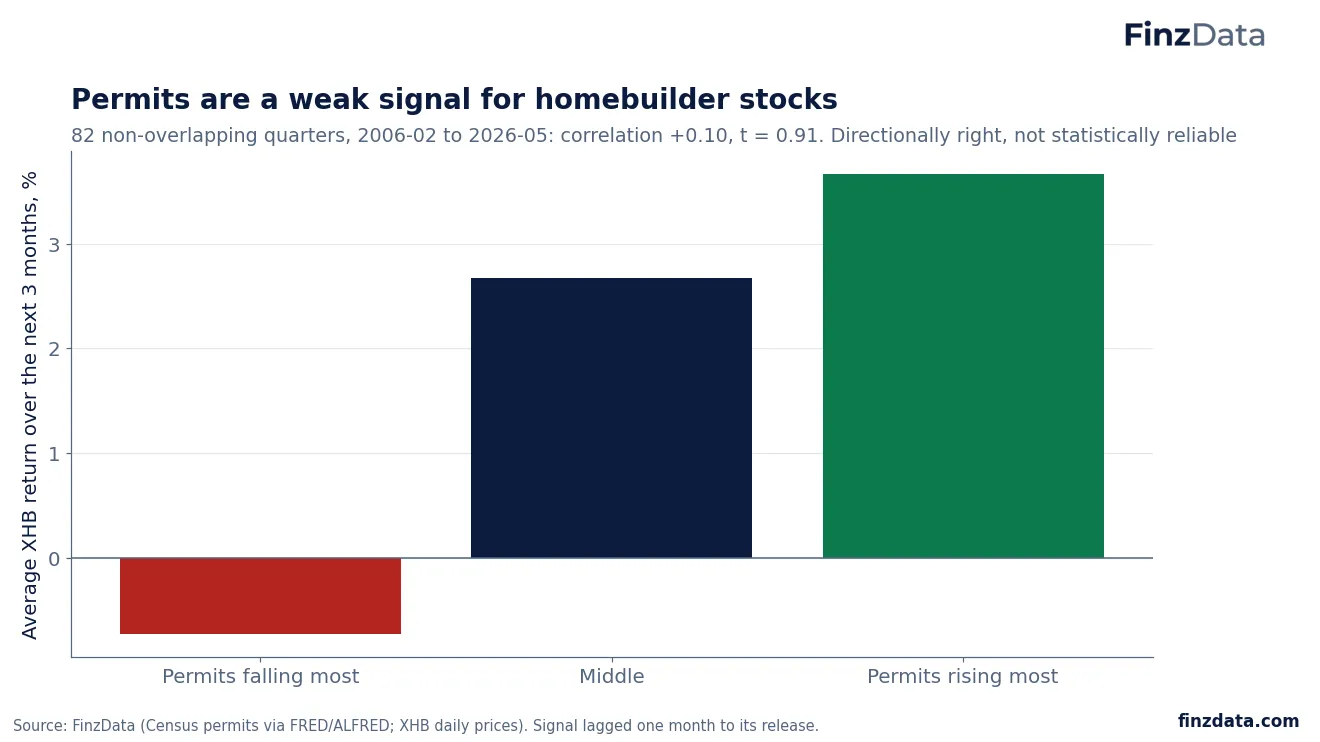
XHB returns over the next three months, by permit growth.
We tested whether the annual change in building permits (three-month average, lagged one month to its release) predicts XHB over the next three months. Over 82 non-overlapping quarters from 2006-02 to 2026-05, the correlation was +0.10 (t = 0.91): XHB averaged -0.7% after the weakest permit readings and +3.7% after the strongest. The direction makes sense, but the evidence is not statistically reliable.
17. Our read: housing can't take much more
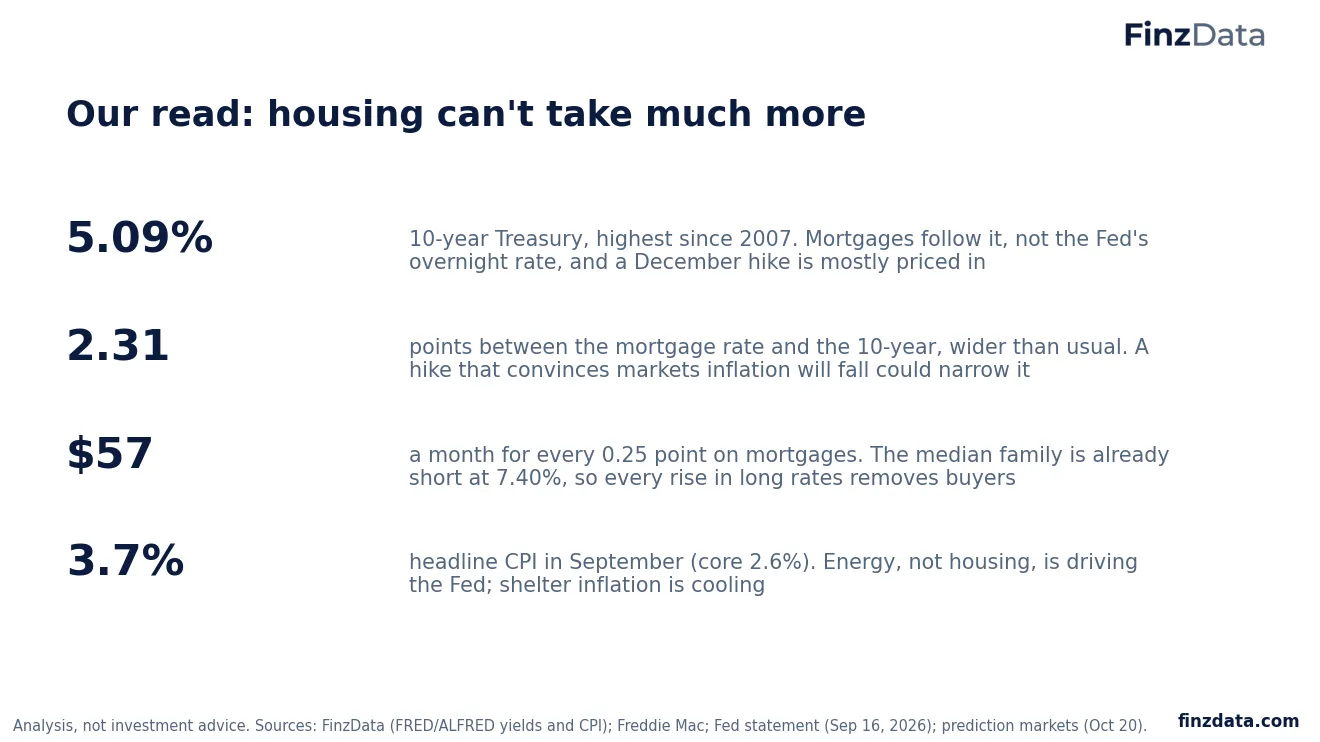
What another Fed hike would mean for housing.
Housing cannot absorb much more: at 7.40% the median family is already short of the median home, demand is falling (pending sales -11.3% on a year) and builders are cutting prices. But the Fed's overnight rate is not what prices mortgages. Mortgages follow the 10-year Treasury, now 5.09% and the highest since 2007, and a December hike is already largely priced. The mortgage rate also sits 2.31 points above the 10-year, a wider gap than usual, and that gap could narrow if markets come to believe inflation will fall. The bigger risk to housing is energy-driven inflation pushing long rates higher, with or without another hike. With shelter inflation cooling, housing is not the reason the Fed is hiking. This is analysis, not investment advice.
18. What to watch
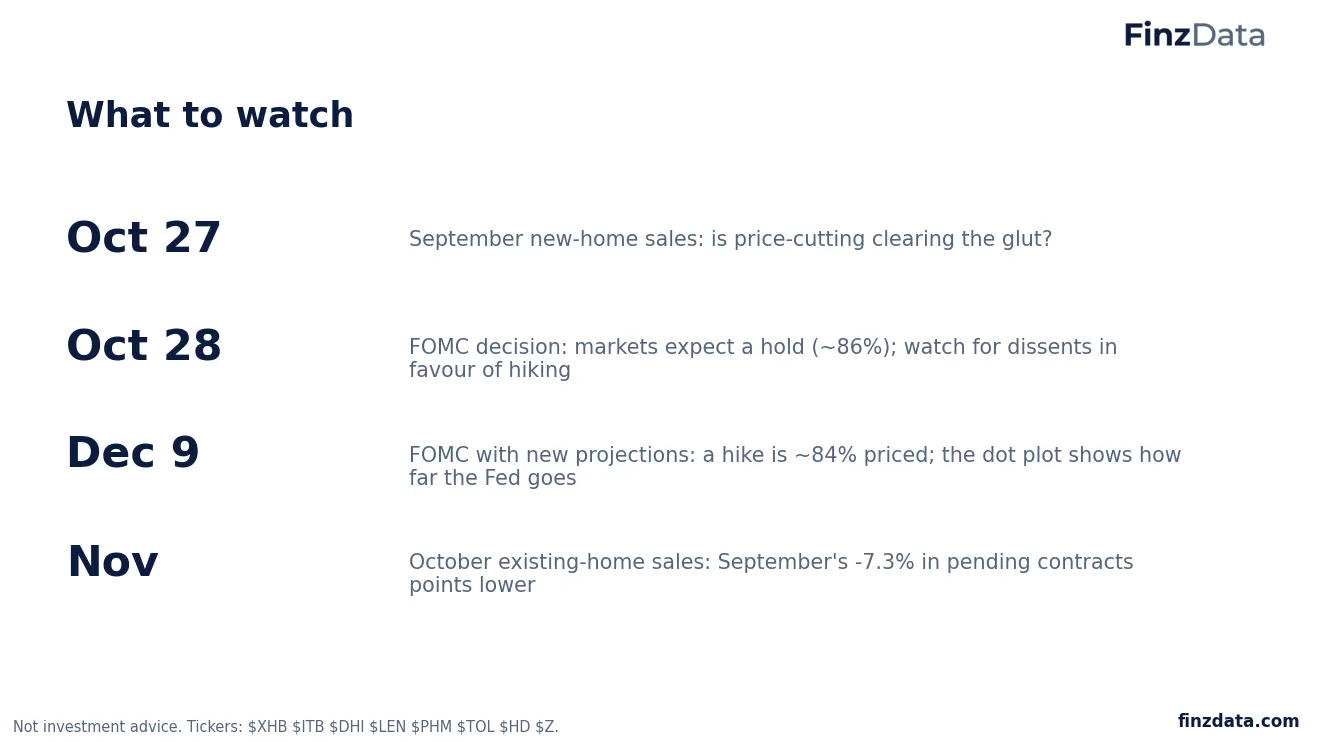
September new-home sales on October 27 (is price-cutting clearing the glut?); the Fed's October 28 decision, where markets expect a hold, and any dissents in favour of hiking; the December 9 meeting with new projections, where a hike is largely priced; and October existing-home sales in November, which September's 7.3% fall in pending contracts points lower.
19. The data behind this deck
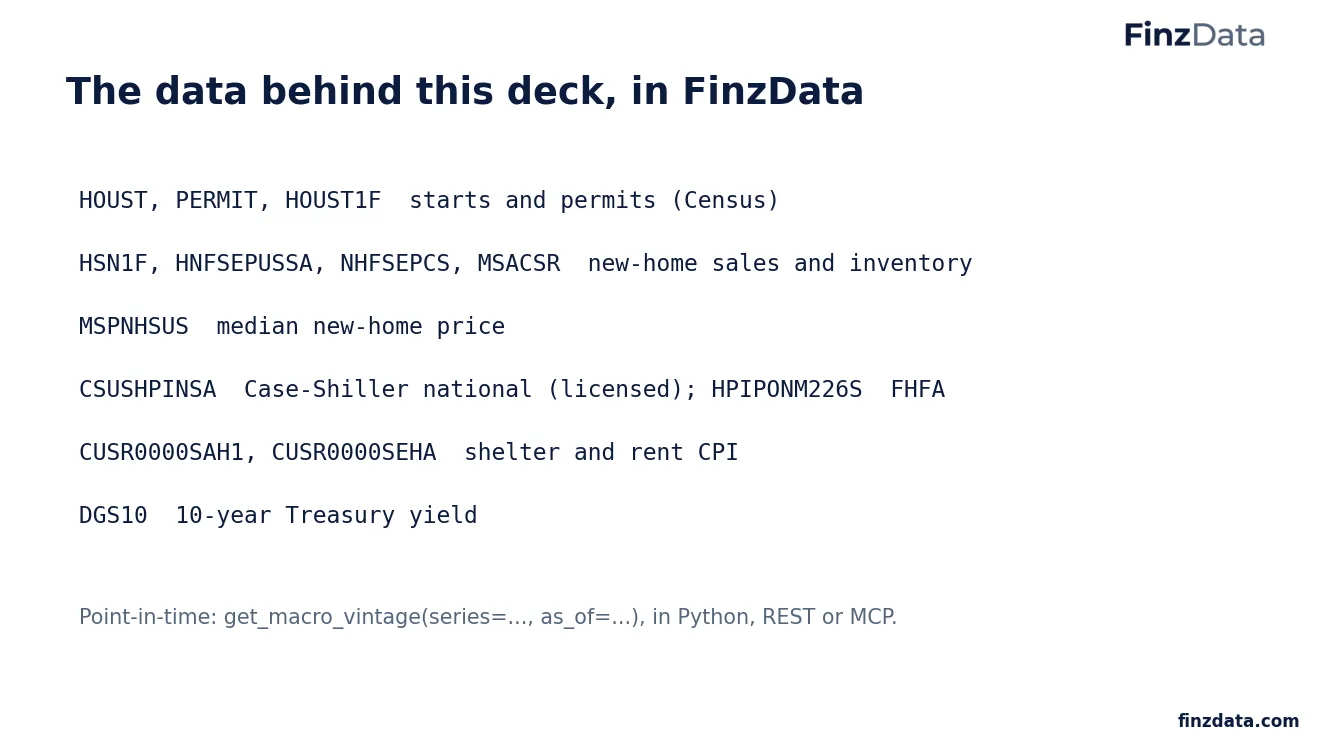
Every chart is built on series anyone can pull from FinzData, point-in-time: HOUST, PERMIT and HOUST1F (starts and permits), HSN1F, HNFSEPUSSA, NHFSEPCS and MSACSR (new-home sales and inventory), MSPNHSUS (median new-home price), CSUSHPINSA (Case-Shiller, licensed), HPIPONM226S (FHFA), CUSR0000SAH1 and CUSR0000SEHA (shelter and rent CPI) and DGS10 (10-year Treasury).
Frequently asked questions
What happened to pending home sales in September 2026?
They fell 7.3% from August to an index of 66.0 and were 11.3% lower than a year earlier, with all four regions down (NAR, October 20, 2026).
Why is housing slowing?
Mortgage rates: the 30-year fixed averaged 7.40% in mid-October 2026, against 6.27% a year earlier, as Treasury yields rose to about 5.1%.
Will the Fed raise interest rates again?
As of October 20, 2026, markets put about 86% on a hold at the October 28 meeting and about 84% on rates being higher after December 9. The Fed raised rates to 3.75-4.00% on September 16, and 16 of 18 officials expected another hike in 2026.
Can the housing market afford another rate hike?
Barely: at 7.40% the payment on the median existing home is $2,313 a month, which needs $111,000 of income on a 25% rule, slightly more than the $110,500 median family income. Mortgages follow the 10-year Treasury more than the Fed's rate, so the bigger risk is higher long-term yields.
Are home prices falling?
Not nationally: Case-Shiller was +1.9% on a year in July 2026 and the existing-home median +1.3% in September, but the median new-home price was -5.8% as builders cut prices.
Do building permits predict homebuilder stocks?
Only weakly: over 82 quarters since 2006 the correlation between permit growth and XHB's next-quarter return was +0.10, not statistically significant.
Download the deck (PDF, 19 slides) More research
Built for AI, quants, data scientists and financial analysts who backtest. Clean data. Real insights. Real alpha. finzdata.com. This material is for information only and is not investment advice. Data sources: FinzData store: Census Bureau/HUD new residential construction and new residential sales, BLS CPI, US Treasury yields and FHFA HPI (FRED/ALFRED point-in-time vintages), S&P CoreLogic Case-Shiller (licensed), daily prices. NAR pending home sales (October 20, 2026) and existing-home sales (October 13, 2026); Census/HUD September 2026 new residential construction (October 20, via Reuters/GV Wire); NAHB/Wells Fargo Housing Market Index (October 19, 2026); Freddie Mac PMMS (October 15, 2026). Federal Reserve FOMC statement and projections (September 16, 2026, via Chase/CNBC); Forbes FOMC preview (October 19, 2026); prediction-market and futures odds (October 20, 2026).
Get FinzData research free, every morning
The daily brief: what moved, the macro releases that matter, positioning and liquidity, with charts. One email a day, free, unsubscribe anytime.
Topics and related searches
US housing market Mortgage rates Home prices Homebuilders and construction Federal Reserve and monetary policy Rents and shelter inflation Inflation and CPI Interest rates and Treasury yields
People also search
- will mortgage rates go down in 2027
- why are home sales falling in 2026
- is now a good time to buy a house
- will the housing market crash
- housing market october 2026 report
- pending home sales september 2026 data
- housing starts data by month 2026
- historical 30 year mortgage rate chart
- download pending home sales csv
- september 2026 cpi report housing
- new home vs existing home price 2026
- homebuilder stocks vs mortgage rates