
FinzData Research · Published 21 October 2026
Why most backtests lie, and how FinzData keeps them honest
A high Sharpe ratio is tempting, and among hundreds of strategies luck alone produces world-class numbers. The four mistakes behind most broken backtests, the evidence from 546 published strategies, and the safeguards built into FinzData. Full paper and slide deck free to download.
Get FinzData research free, every morning
The daily brief: what moved, the macro releases that matter, positioning and liquidity, with charts. One email a day, free, unsubscribe anytime.
Contents
- The high-Sharpe trap: luck looks exactly like skill
- The evidence: what published strategies did after publication
- Mistake 1: tuned parameters and uncounted trials
- Mistake 2: no stress-period testing
- Mistake 3: light trading costs
- Mistake 4: survivorship and look-ahead bias
- How FinzData is built differently
- Where FinzData still falls short
- A checklist for any backtest
- Frequently asked questions
1. Summary
Four mistakes do most of the damage; a high Sharpe on its own proves nothing.
Most backtests overstate what a strategy will earn, and four mistakes do most of the damage: tuned parameters, no stress-period testing, light trading costs, and survivorship or look-ahead bias. Each one adds return that was never available to a real trader. Together they explain why a strategy can show a Sharpe ratio of 3 on a leaderboard and lose money in its first year. A high Sharpe on its own proves nothing: among 546 strategies with no skill at all, luck alone produces a best 3-month Sharpe near 6.
The cure is not a better formula. It is data and procedures that make these mistakes hard to commit: point-in-time data with delisted companies included, a count of every variant tried, costs charged on every trade, and a record that only counts days after the strategy was frozen. This paper sets out the evidence, the four mistakes, how FinzData is built to prevent them, and where we still fall short.
2. The high-Sharpe trap: luck looks exactly like skill
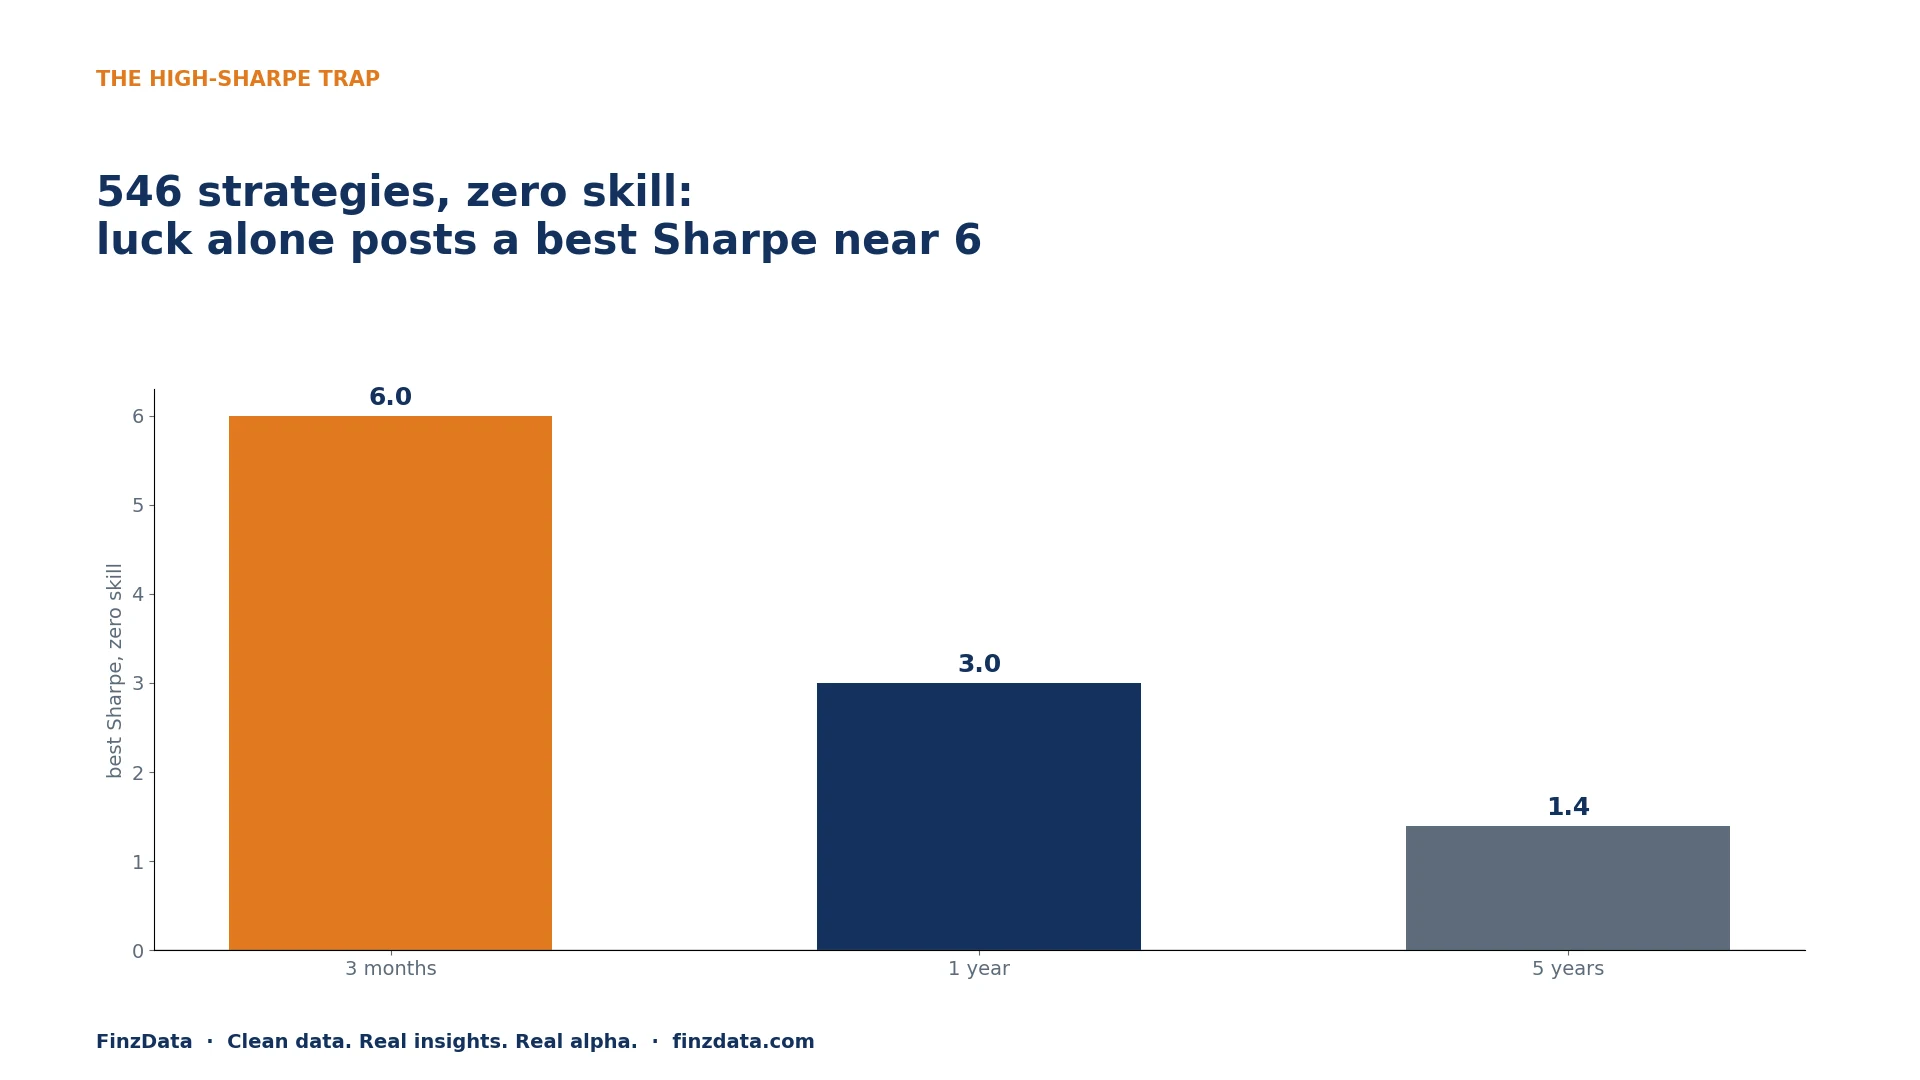
Best Sharpe among 546 zero-skill strategies, by measurement window (simulation).
A high Sharpe ratio from a backtest or a short live window is not a competitive advantage. With zero skill, luck alone produces Sharpe ratios that look world-class, and a leaderboard picks exactly those.
We simulated 546 strategies with a true Sharpe of exactly zero, the same count as the public library below, and measured them over windows of different length:
| Measurement window | Typical best Sharpe, zero skill | Strategies above Sharpe 2, zero skill | Above Sharpe 3, zero skill |
|---|---|---|---|
| 3 months (63 trading days) | 6.0 | about 87 | about 37 |
| 1 year (252 days) | 3.0 | about 12 | about 1 |
| 5 years (1,260 days) | 1.4 | 0 | 0 |
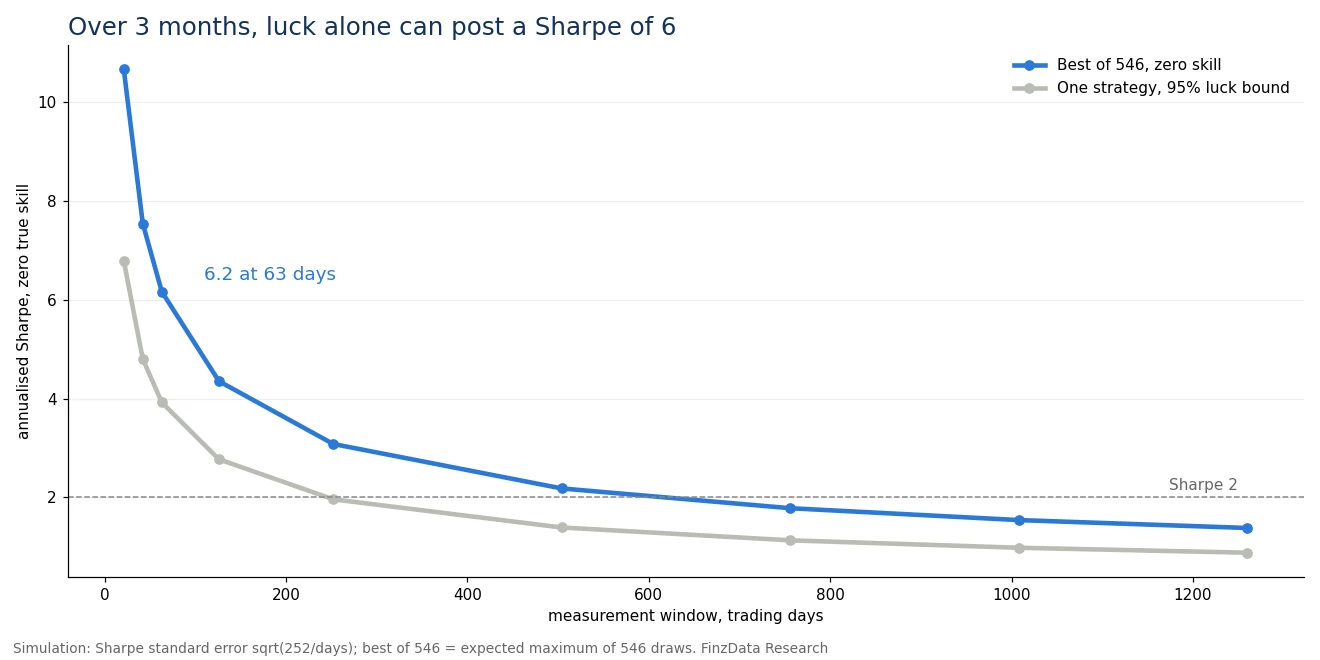
Short windows are where luck hides: a single strategy needs a three-month Sharpe near 4 just to clear luck's 95% range, and the lucky best of a large library sits higher still.
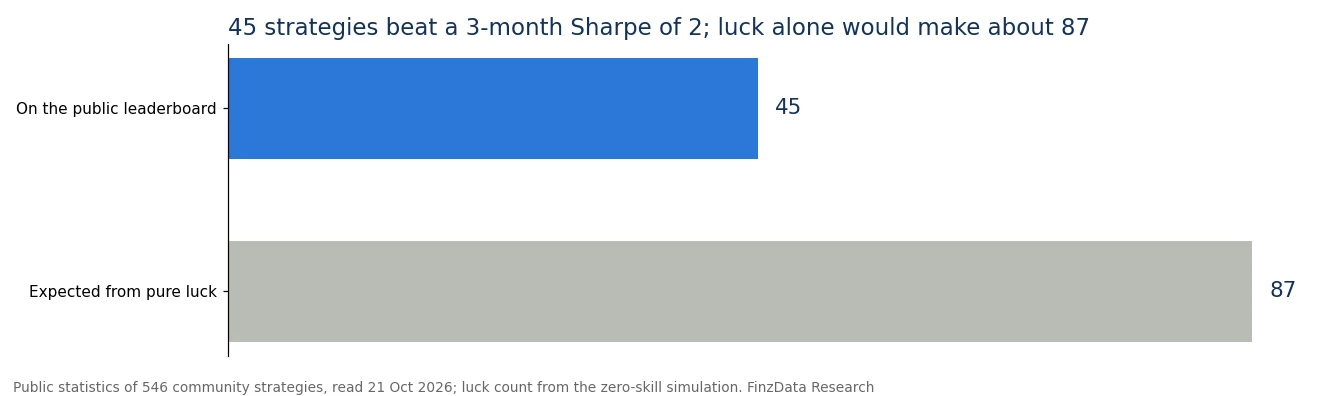
The public leaderboard shows 45 strategies above a 3-month Sharpe of 2. Pure luck would give about 87. Its top ten, ranked on three months, cannot be told apart from coin flips.
Why the trap is so easy to fall into:
- The number looks precise. A Sharpe of 4.48 reads like a measurement. Over 63 days its standard error is about 2.0, so the honest statement is "somewhere between 0.5 and 8.5".
- The winner is chosen after the fact. Picking the best of many backtests guarantees a high number. The same search would find one in random data.
- The story fits afterwards. Every lucky strategy comes with a reason it worked. Reasons are cheap; a forward record is not.
- It invites leverage. A trader who believes a Sharpe of 4 sizes up. When the luck reverts, the loss is sized for the illusion.
What a real edge looks like instead: a deflated Sharpe that survives the number of trials, a t-statistic above about 3, at least a year (better five) of data including a crisis, and a forward record that starts only after the strategy was frozen. Anything less is a hypothesis, not an advantage.
3. The evidence: what published strategies did after publication
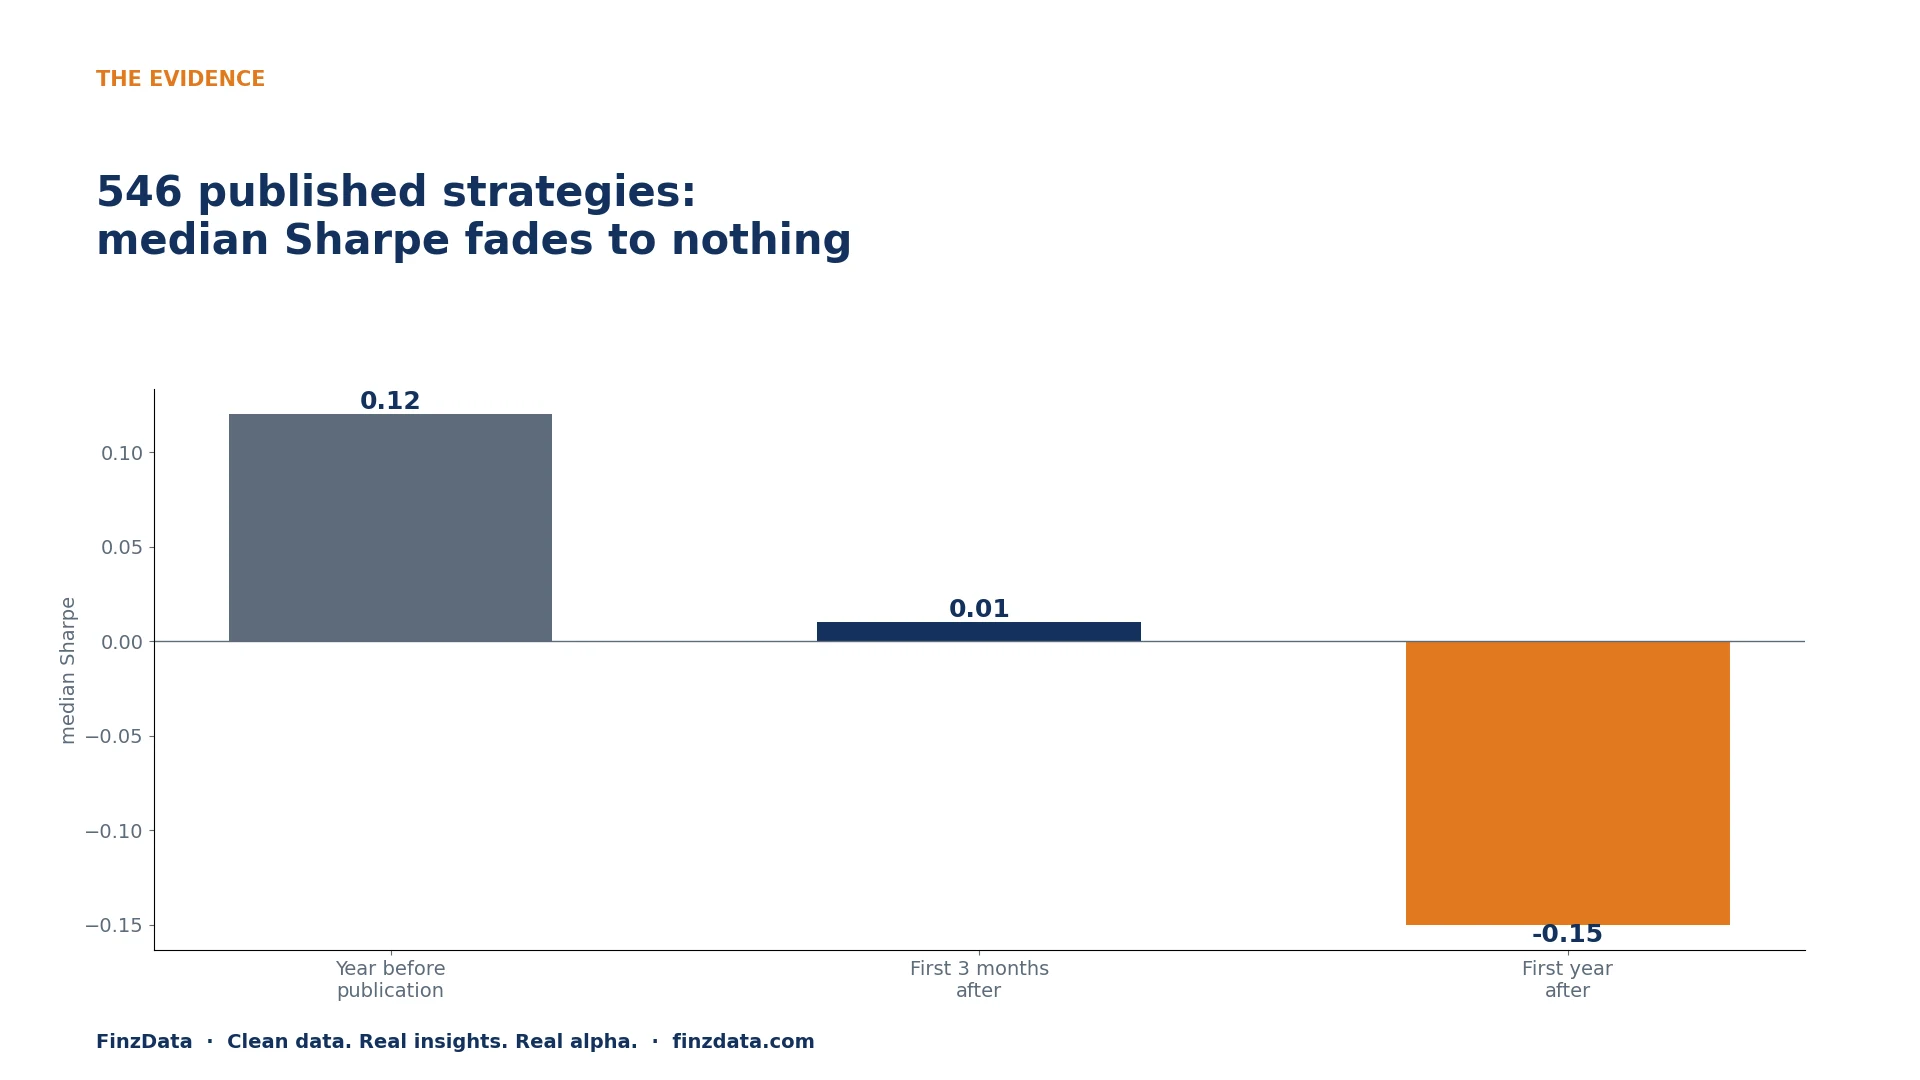
Median Sharpe of 546 published community strategies, before and after publication.
On 21 October 2026 we read the public statistics of 546 community strategies on a large retail backtesting platform. Its leaderboard ranks them by out-of-sample Sharpe over the last three months. The typical strategy earned close to nothing once it was published.
| Measure (platform's own statistics) | Median across strategies |
|---|---|
| Sharpe, the year before publication (in-sample) | 0.12 |
| Sharpe, first 3 months after publication (what the leaderboard ranks) | 0.01 |
| Sharpe, first year after publication (197 strategies old enough) | -0.15 |
| Worst drawdown over 5 years | 26% |
A board ranked on three months is mostly ranking luck.
- 45 strategies show a 3-month Sharpe above 2. Only 16 of 197 keep a one-year post-publication Sharpe above 1, and only 1 stays above 2.
- A 3-month window is about 63 trading days. Among 546 strategies, several will post a Sharpe above 3 over such a window by chance alone; a board that ranks on that window promotes them.
- The best one-year performer, a short-volatility strategy with a Sharpe of 2.4, also carries a 55% worst drawdown over five years.
The academic record says the same at scale. Across 97 published stock-return predictors, returns were about 26% lower out-of-sample and about 58% lower after publication (McLean and Pontiff, 2016).
4. Mistake 1: tuned parameters and uncounted trials
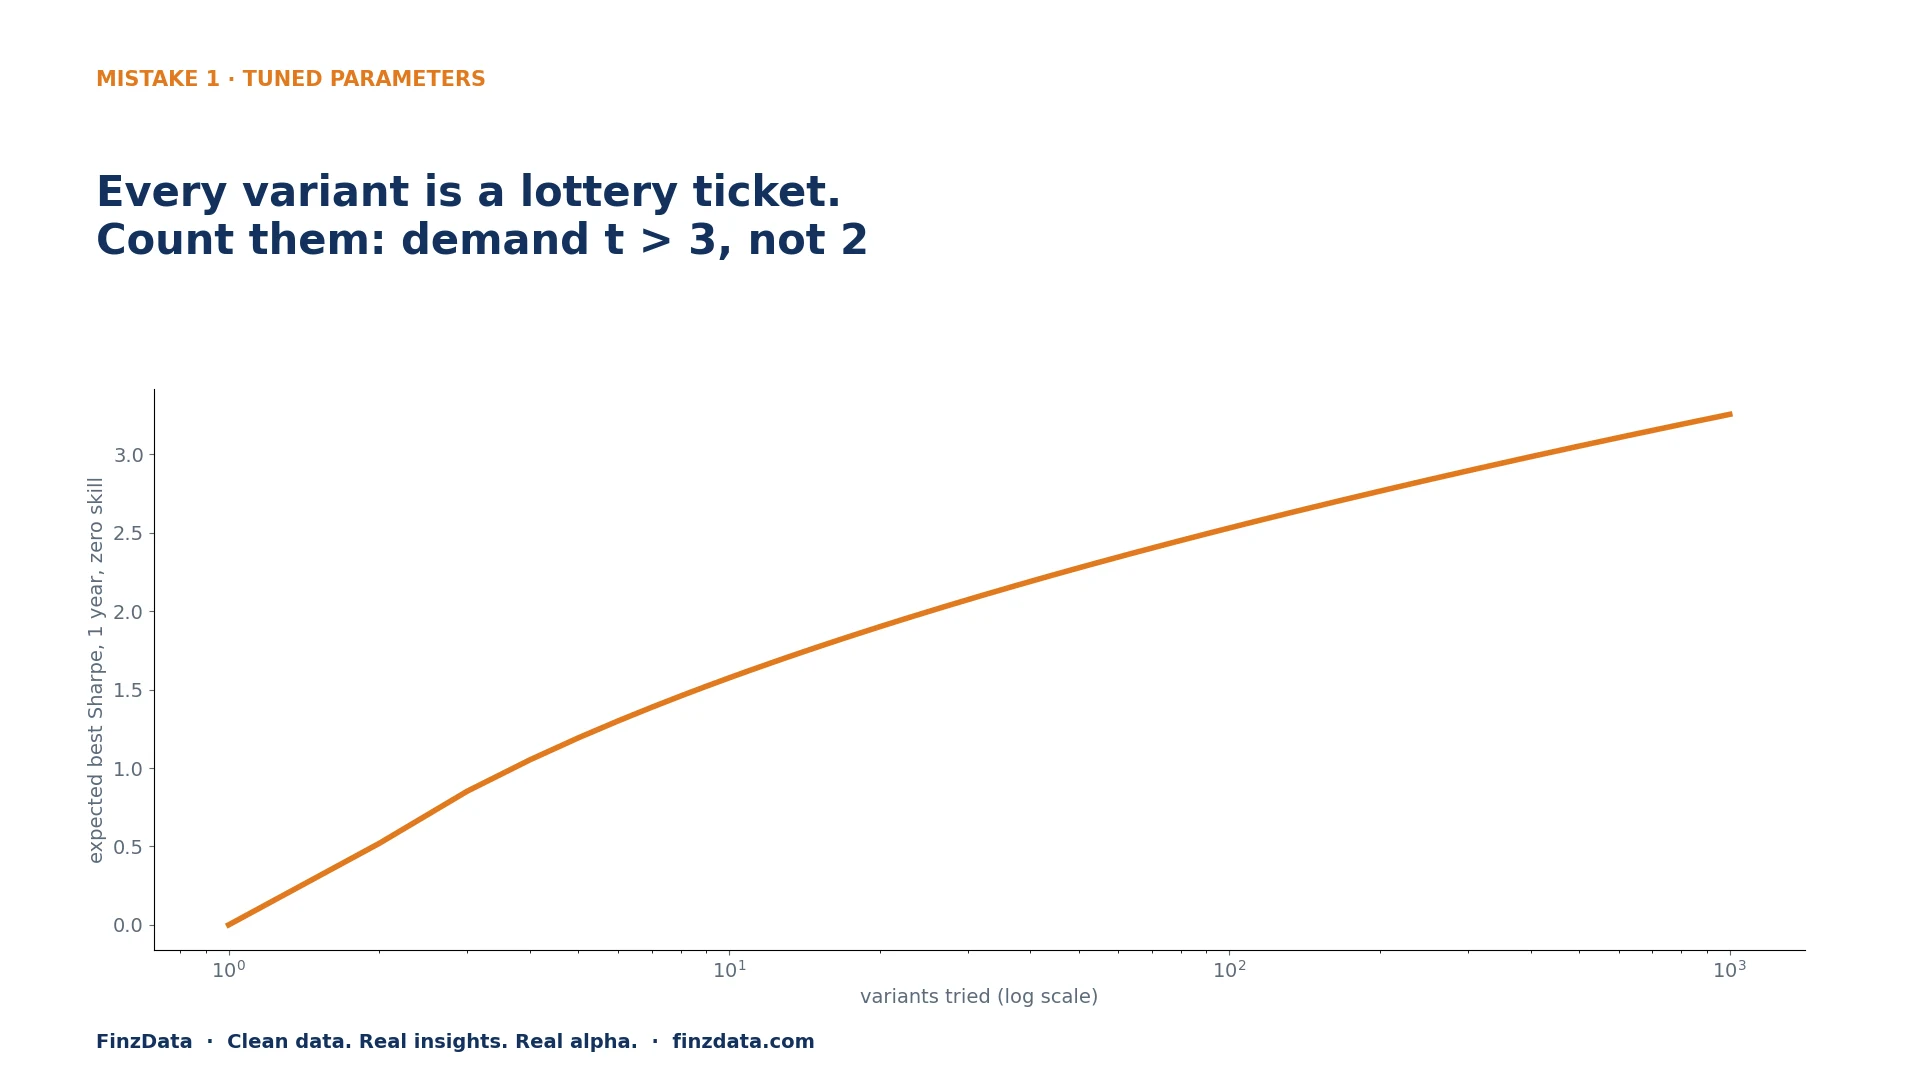
Expected best one-year Sharpe from pure luck as the number of variants tried grows.
Every parameter you try is another lottery ticket, and the best ticket always looks like skill. Try a 30-day lookback, then 20, then 50; five stocks, then ten; weekly, then monthly. After a few hundred combinations, the winner's backtest Sharpe mostly measures how hard you searched.
- The fix is to count the trials and raise the bar to match. The deflated Sharpe ratio adjusts a strategy's Sharpe for the number of variants tried, the sample length and fat tails (Bailey and López de Prado, 2014).
- Across the academic literature, a new factor needs a t-statistic above about 3.0, not the usual 2.0, once the hundreds of factors already tested are counted (Harvey, Liu and Zhu, 2016).
- A warning sign: performance that collapses when a parameter moves one step. A real effect degrades gently across nearby settings.
5. Mistake 2: no stress-period testing
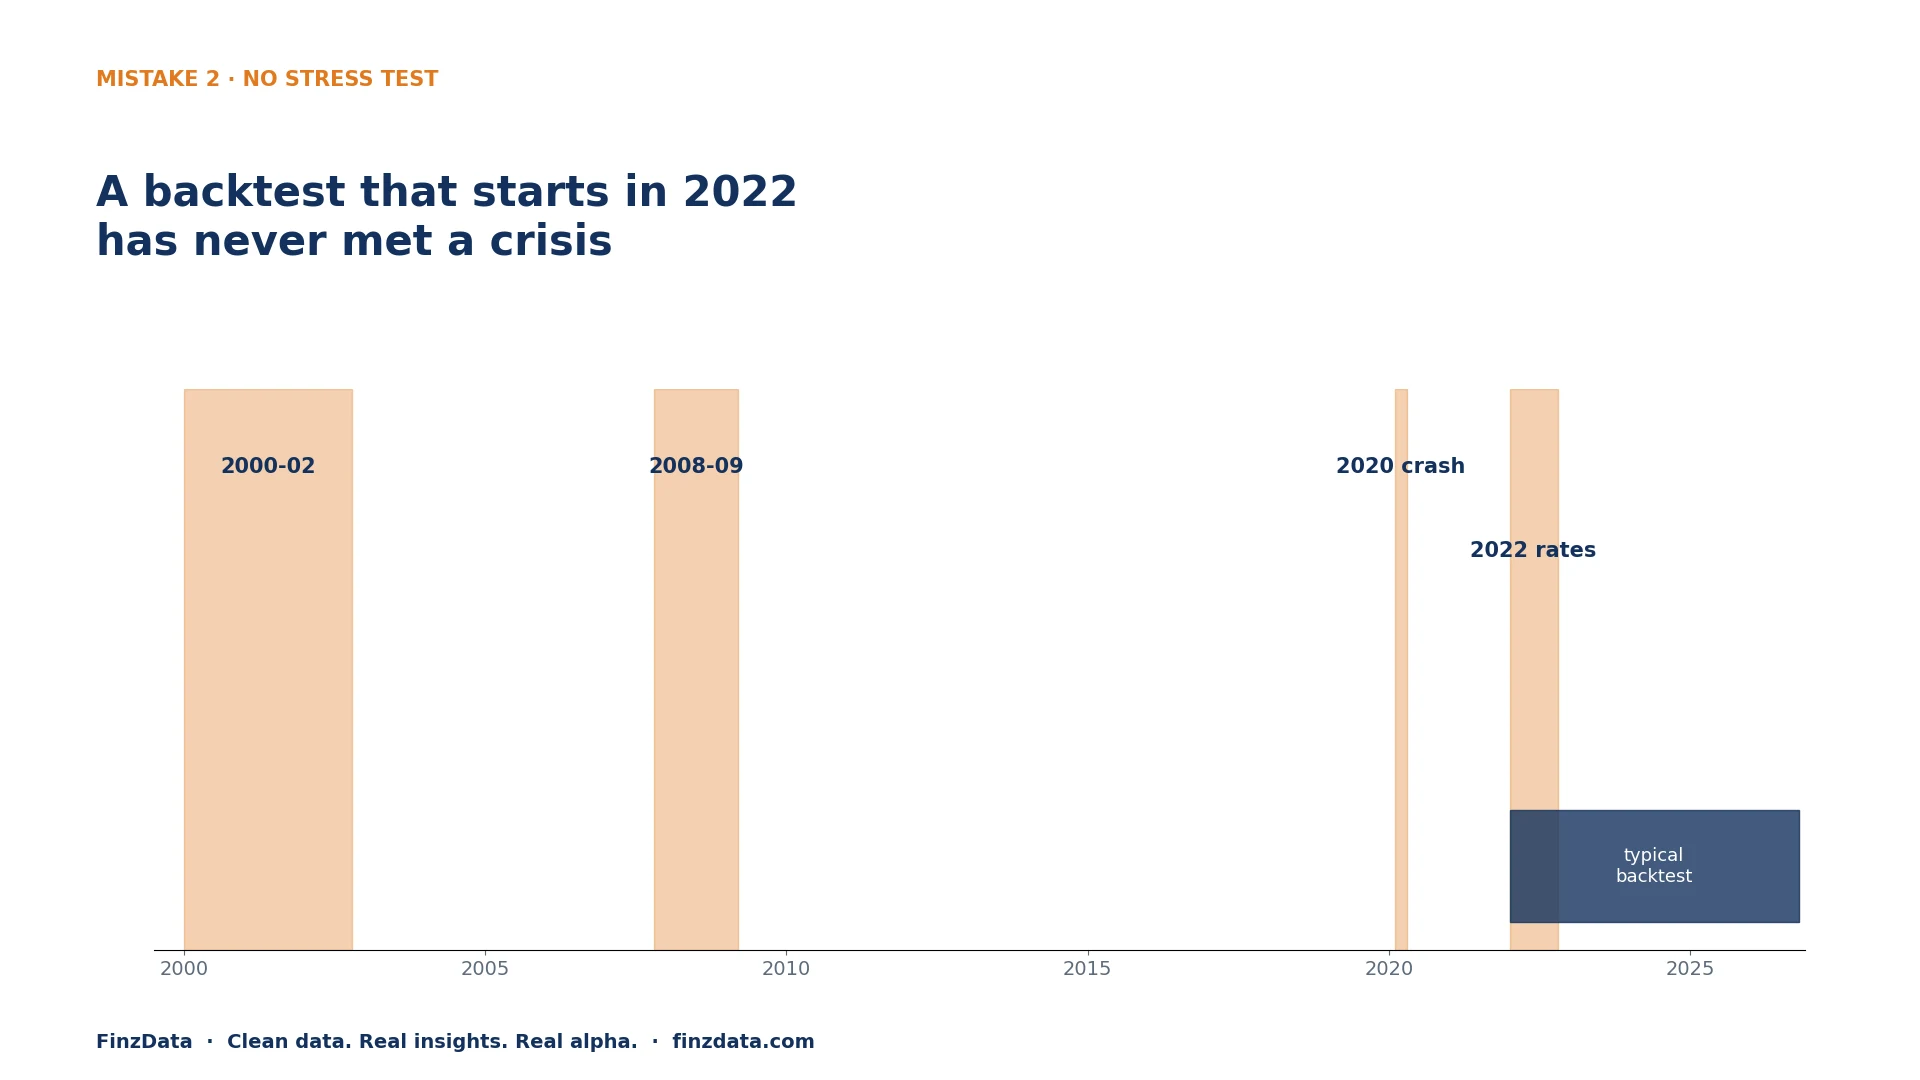
The regimes that broke strategies before, and the window most backtests cover.
A backtest that starts in 2022 has never met a crisis, so it cannot tell you how the strategy behaves in one. Many published strategies cover only the last two to five years, which for equities means a long bull market led by a few large technology stocks.
- Test across the regimes that broke strategies before: 2000–02, 2008–09, the 2020 crash, the 2022 rate shock, and momentum reversals such as 2009.
- Split history before you look: fit on an early window, choose on a middle one, and keep the most recent years sealed until the strategy is frozen. Read the sealed window once.
- Report the worst drawdown and how long recovery took, not only the average. A 55% drawdown ends most strategies in practice, whatever the Sharpe.
6. Mistake 3: light trading costs
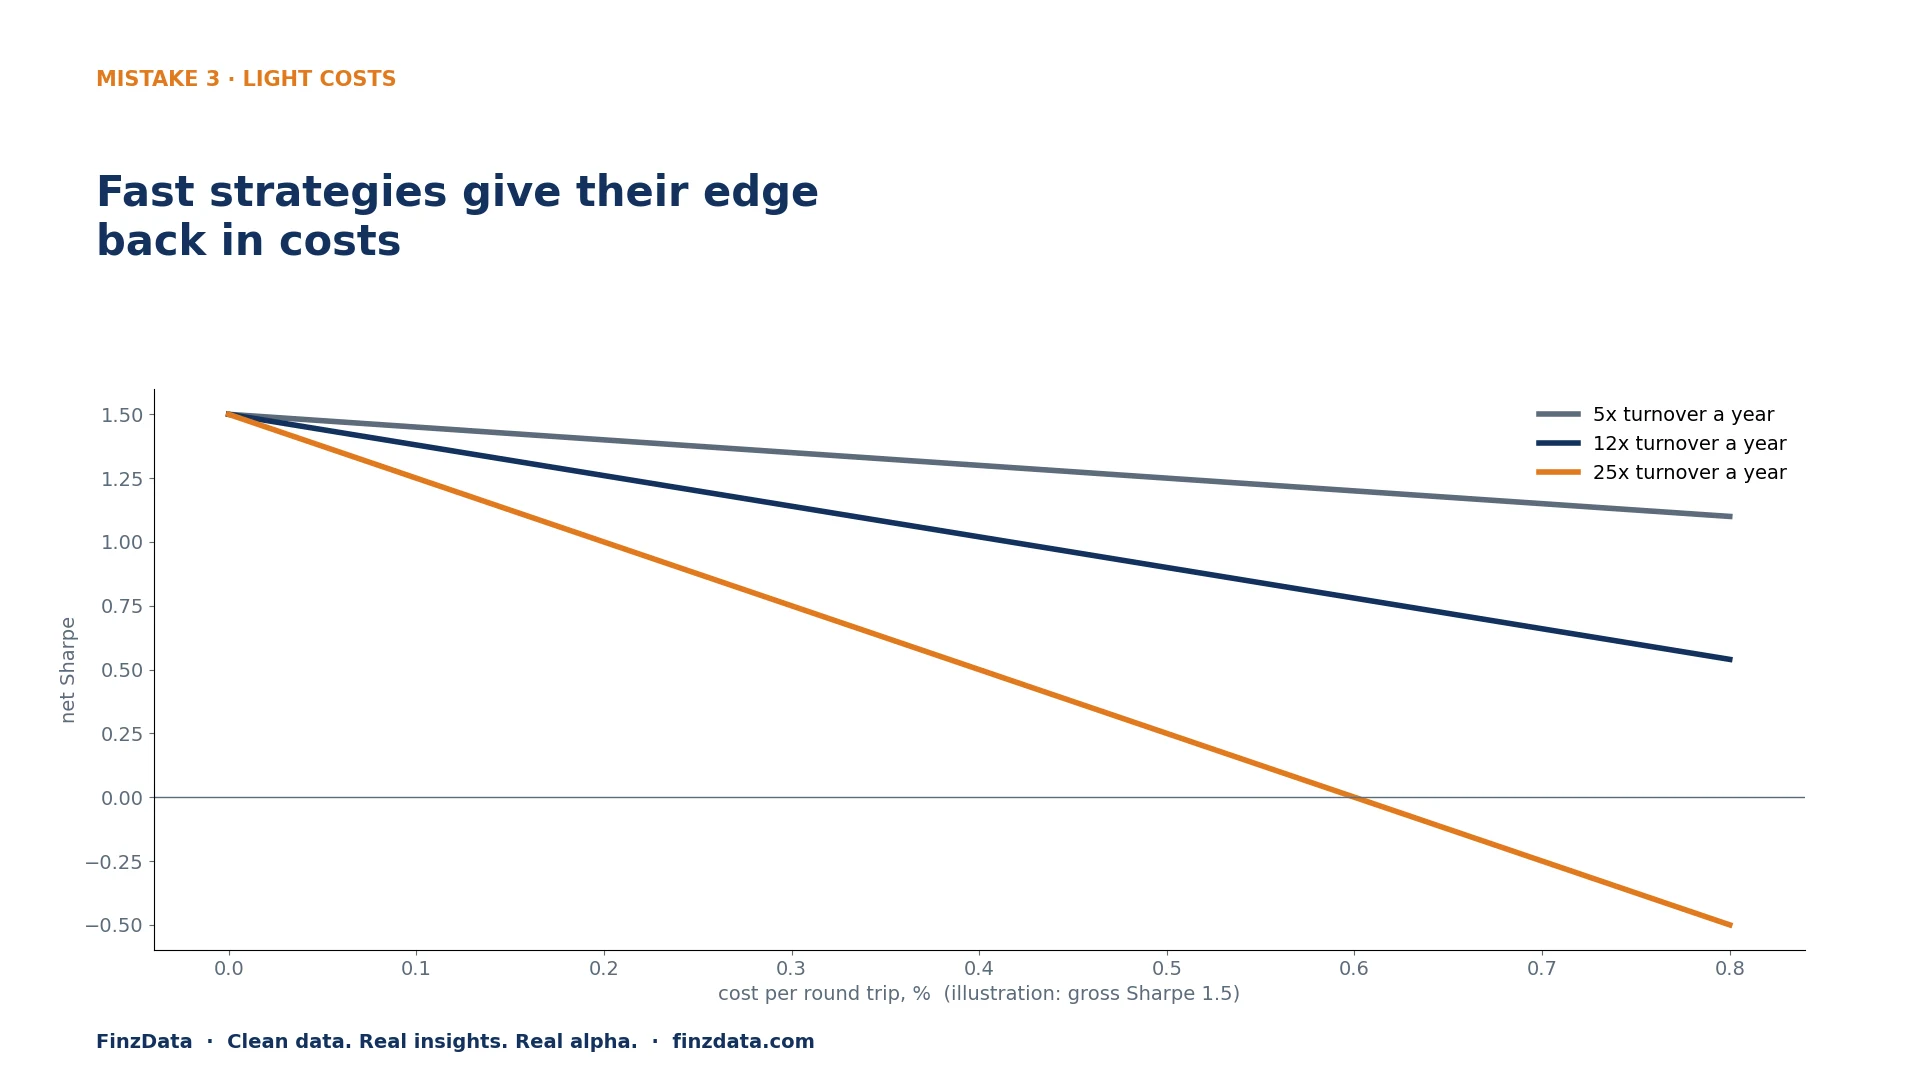
Illustration: net Sharpe of a strategy with a gross Sharpe of 1.5 as costs and turnover rise.
A strategy that trades often can earn its whole edge and give it all back in costs. Many backtests charge nothing, or a flat few basis points, and fill every order at the closing price.
- Real costs include commissions, the bid-ask spread, market impact that grows with size, borrow fees on shorts, and slippage on fast markets. Small and illiquid stocks cost far more than large ones.
- High-turnover anomalies are the ones costs destroy; many published effects do not survive realistic trading costs (Novy-Marx and Velikov, 2016).
- Report results at two cost levels, for example 0.20% and 0.60% per round trip, together with turnover. If the edge disappears at the higher level, it was never safe to trade.
7. Mistake 4: survivorship and look-ahead bias
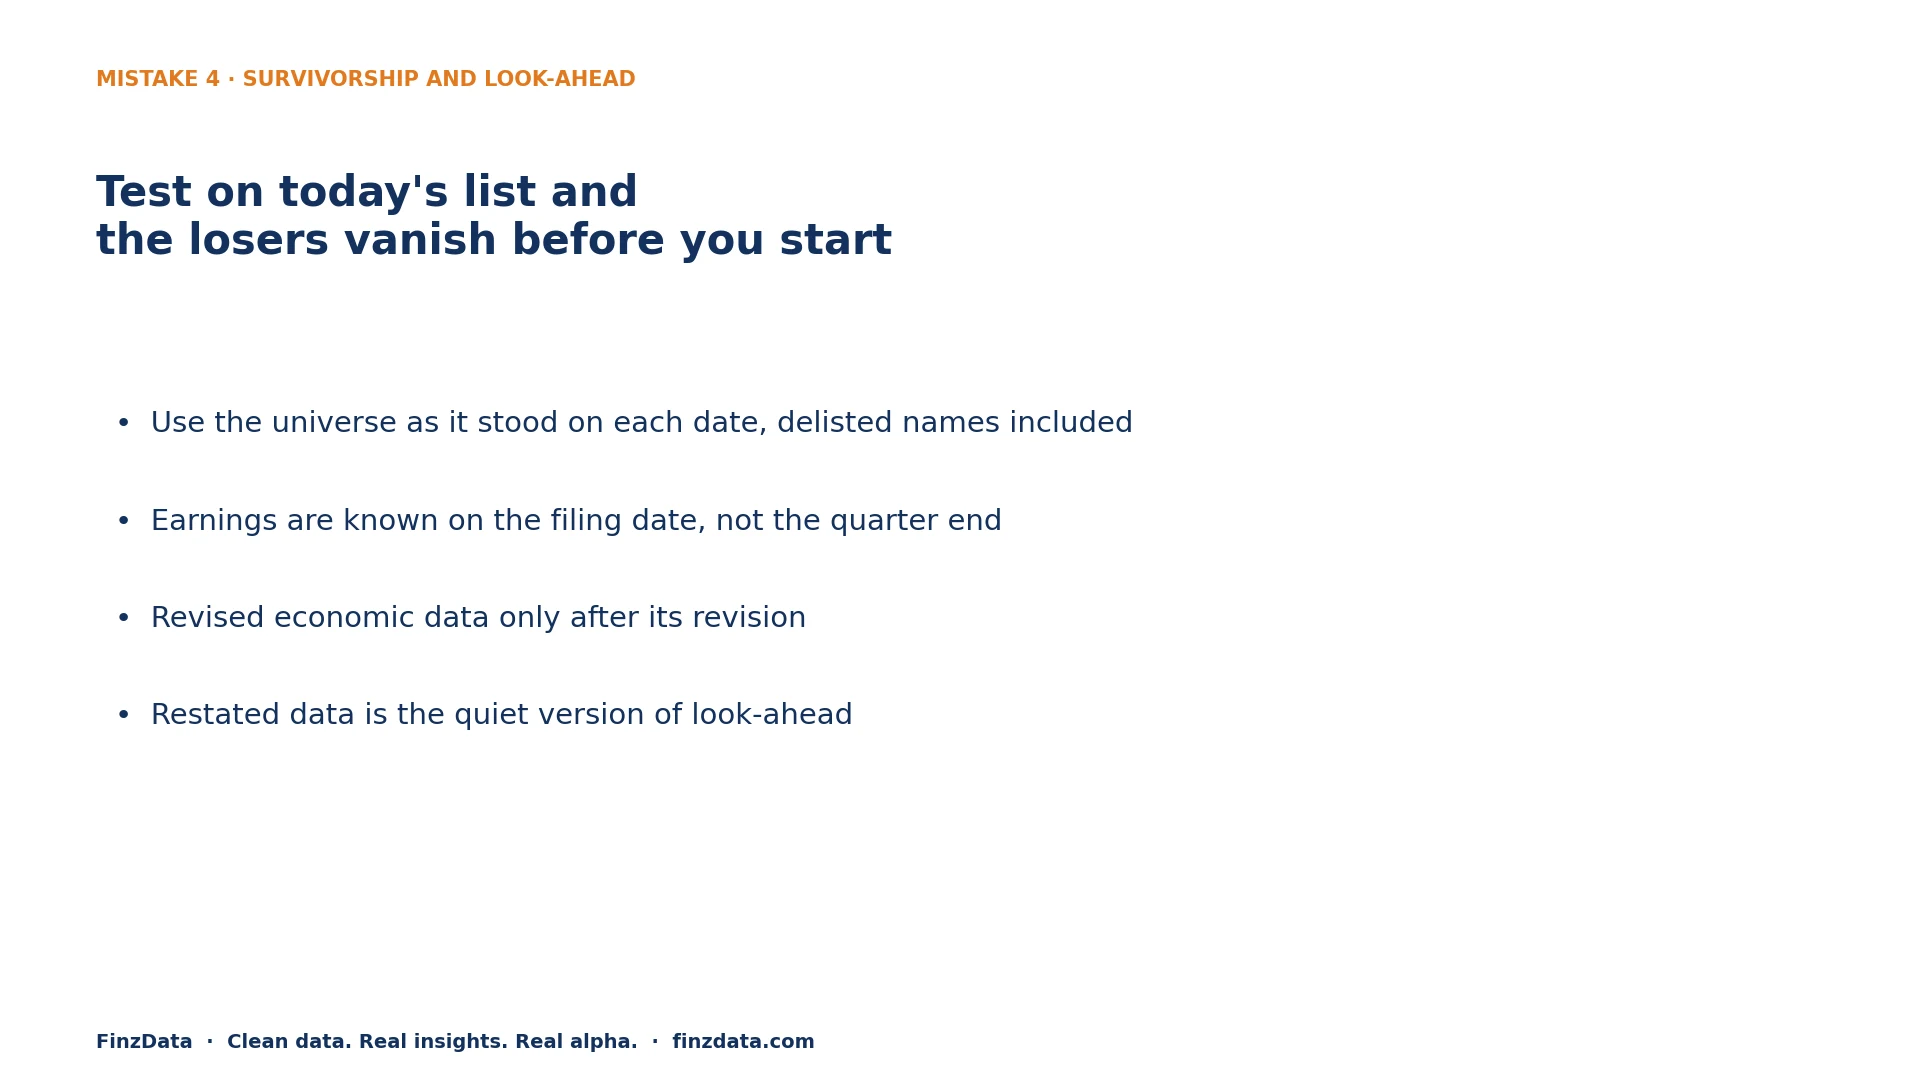
Survivorship and look-ahead: what was knowable, when.
Testing on today's list of companies quietly removes every company that went bankrupt, was delisted or was bought out. The losers are gone before the test starts, so almost any long strategy looks better than it was.
- Survivorship bias: use the universe as it stood on each date, delisted names included until the day they stopped trading, with their final returns.
- Look-ahead bias: a value used on date t must have been knowable at the close of t. Earnings are known on the filing date, not the quarter-end date; index membership on the announcement date; revised economic data only after its revision.
- Restated data is the quiet version of look-ahead. A point-in-time record keeps what was known then, not what the number became later.
8. How FinzData is built differently
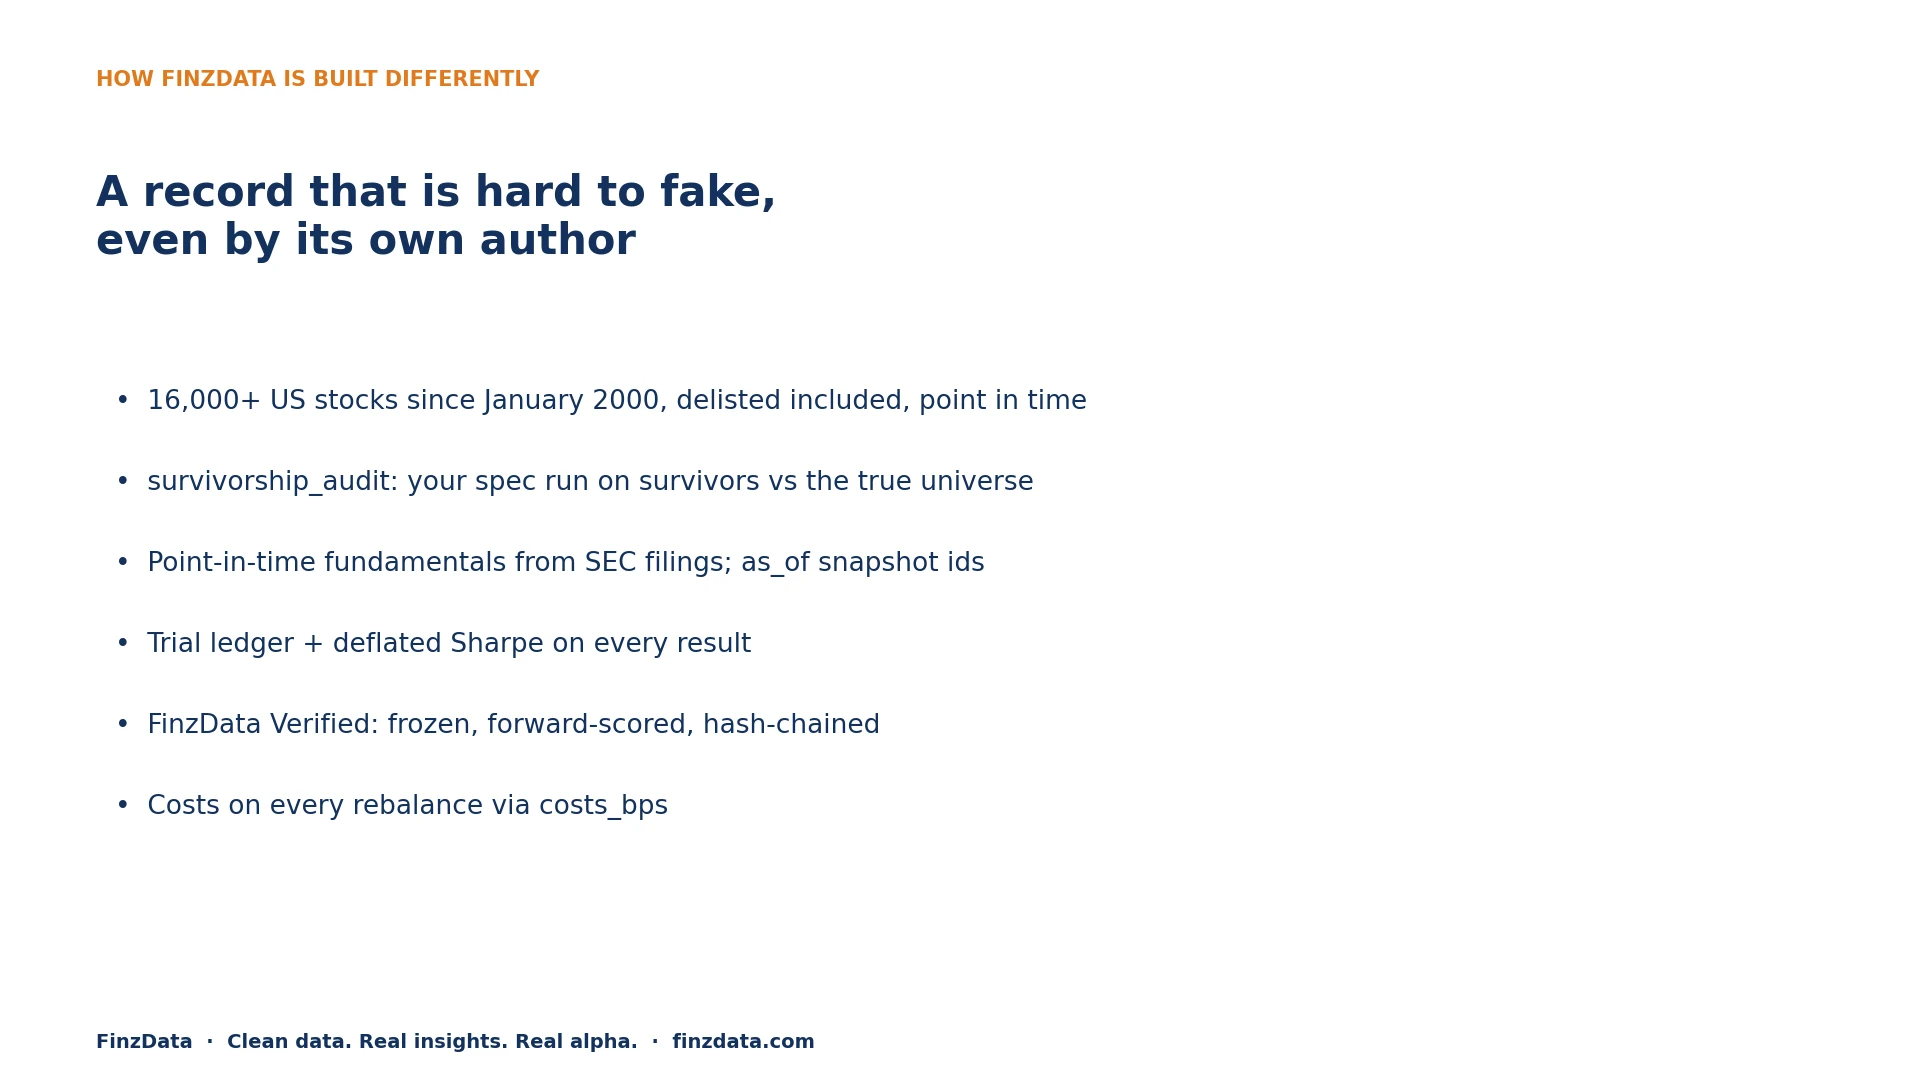
Each safeguard is a working part of the FinzData data, API and MCP tools today.
FinzData's rule is that a strategy's record should be hard to fake, even by its own author. Each safeguard below is a working part of the FinzData data, API and MCP tools today.
| Mistake | FinzData safeguard | How you use it |
|---|---|---|
| Survivorship bias | 16,000+ US stocks that have traded on NYSE and Nasdaq since January 2000, delisted included, point in time | Backtest on the point-in-time universe (top 500, 1,000 or 3,000 on each date) |
| Survivorship bias, measured | survivorship_audit runs your spec twice: on the point-in-time universe and on today's survivors only |
See how much CAGR and Sharpe the bias would have added |
| Look-ahead bias | Point-in-time fundamentals built from SEC filings, dated when filed; every result carries as_of snapshot ids |
Replay any result exactly, on the data as it was known |
| Tuned parameters | A trial ledger counts every backtest per API key; results report the deflated Sharpe for that count | Judge a strategy on its deflated Sharpe, not its best run |
| Short or cherry-picked windows | Hub rankings use deflated Sharpe and the forward record; nothing is ranked on fewer than 63 forward sessions | Compare strategies only after the record exists |
| Edited or back-dated records | FinzData Verified: a registered strategy is frozen, scored forward only from its registration date, and chained by hash; verify_chain is public |
Anyone can check that no record was changed after the fact |
| Light costs | Costs are charged on every rebalance through costs_bps |
Set your own cost level and run it twice, for example 20 and 60 basis points |
Two rules keep the referee independent: FinzData sells data and scoring, not strategies, and it never trades on strategies registered with it.
9. Where FinzData still falls short
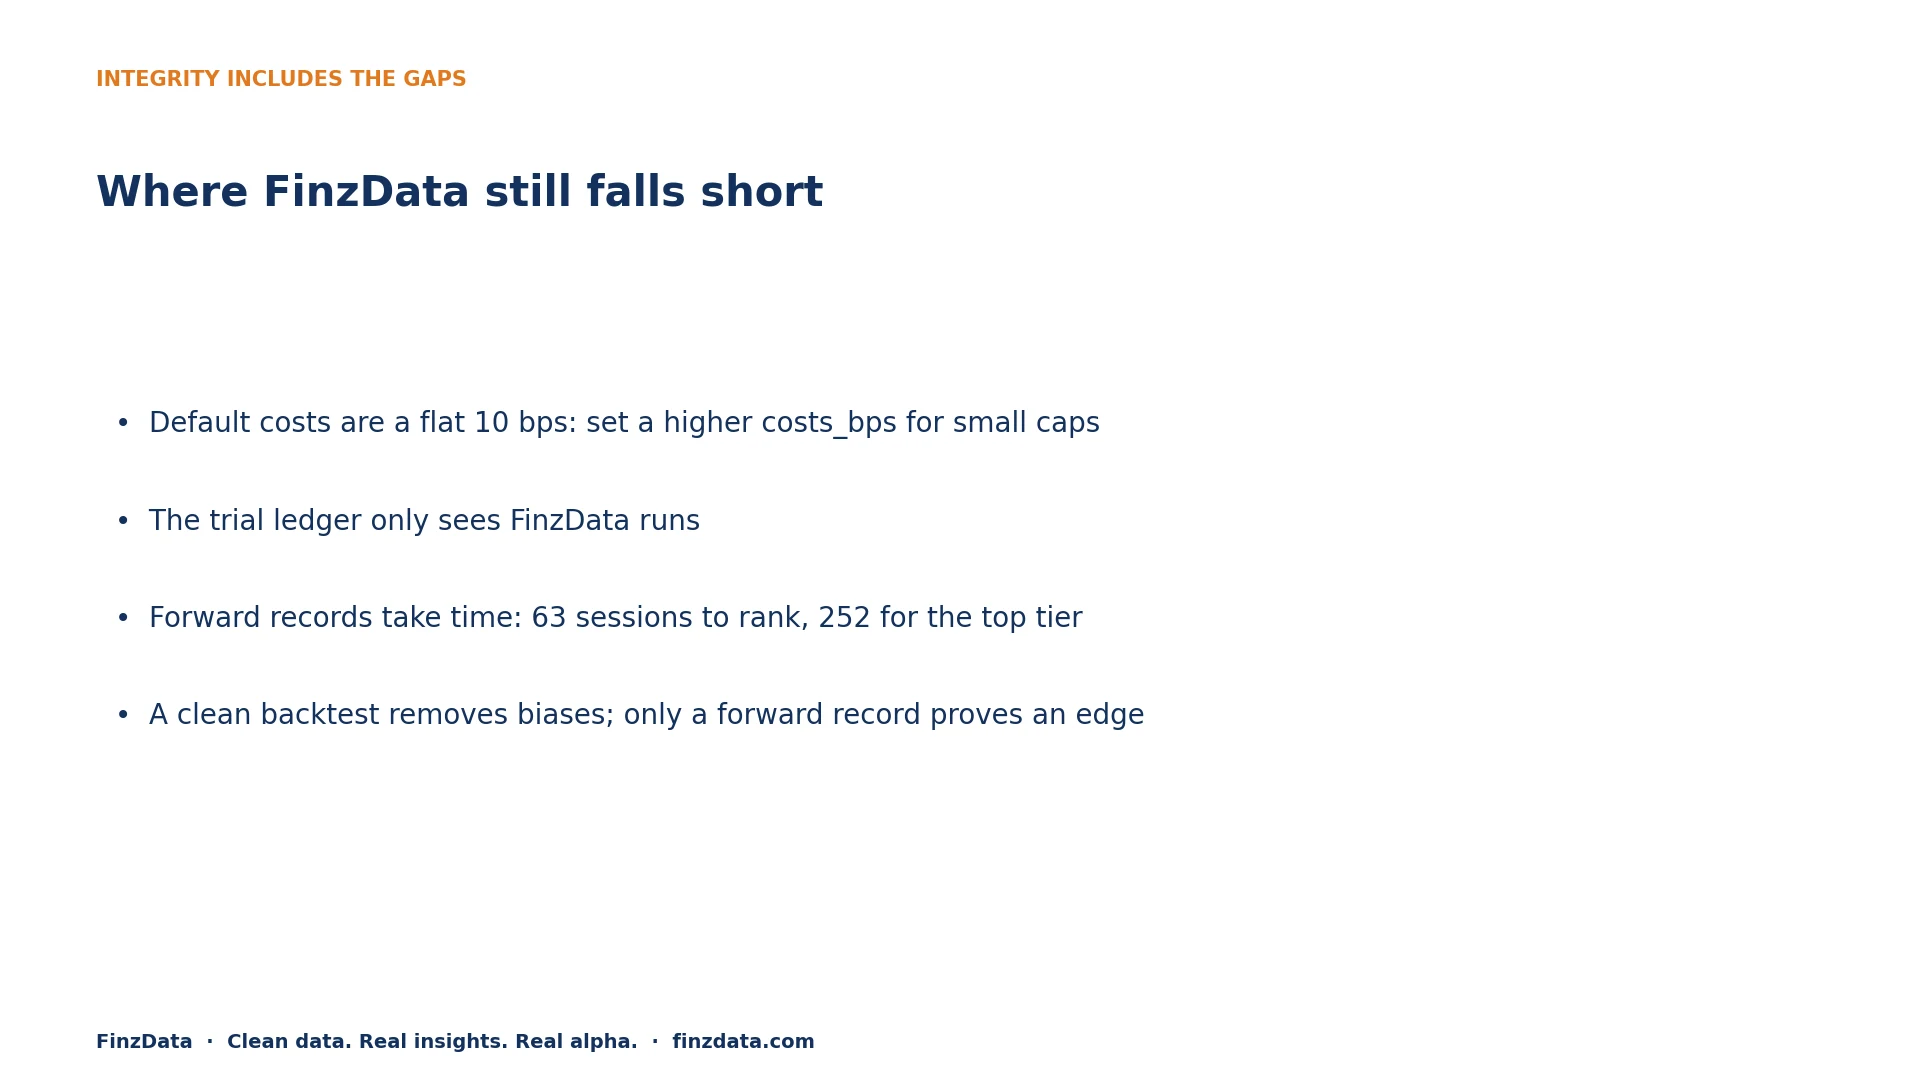
What FinzData does not do yet.
Integrity includes saying what we do not do yet.
- Costs are a flat rate. The default is 10 basis points per trade, too light for small or illiquid stocks. The engine does not yet model market impact, borrow fees or spreads by liquidity. Set a higher
costs_bpsyourself. - The trial ledger sees only FinzData runs. It counts backtests per API key. Variants tried elsewhere, or under another key, are invisible to it, so the deflated Sharpe can only be as honest as the history it sees.
- Forward records take time. A strategy is not ranked before 63 forward sessions, about three months, and the top tier needs 252. There is no shortcut, by design.
- Coverage has edges. Full stock coverage starts in January 2000, so the 1987 and 1990s crises are out of reach for single stocks. Point-in-time fundamentals depend on what companies filed and when.
- A clean backtest is not a promise. It removes known biases; it does not prove the effect will last. Only the forward record can do that.
10. A checklist for any backtest
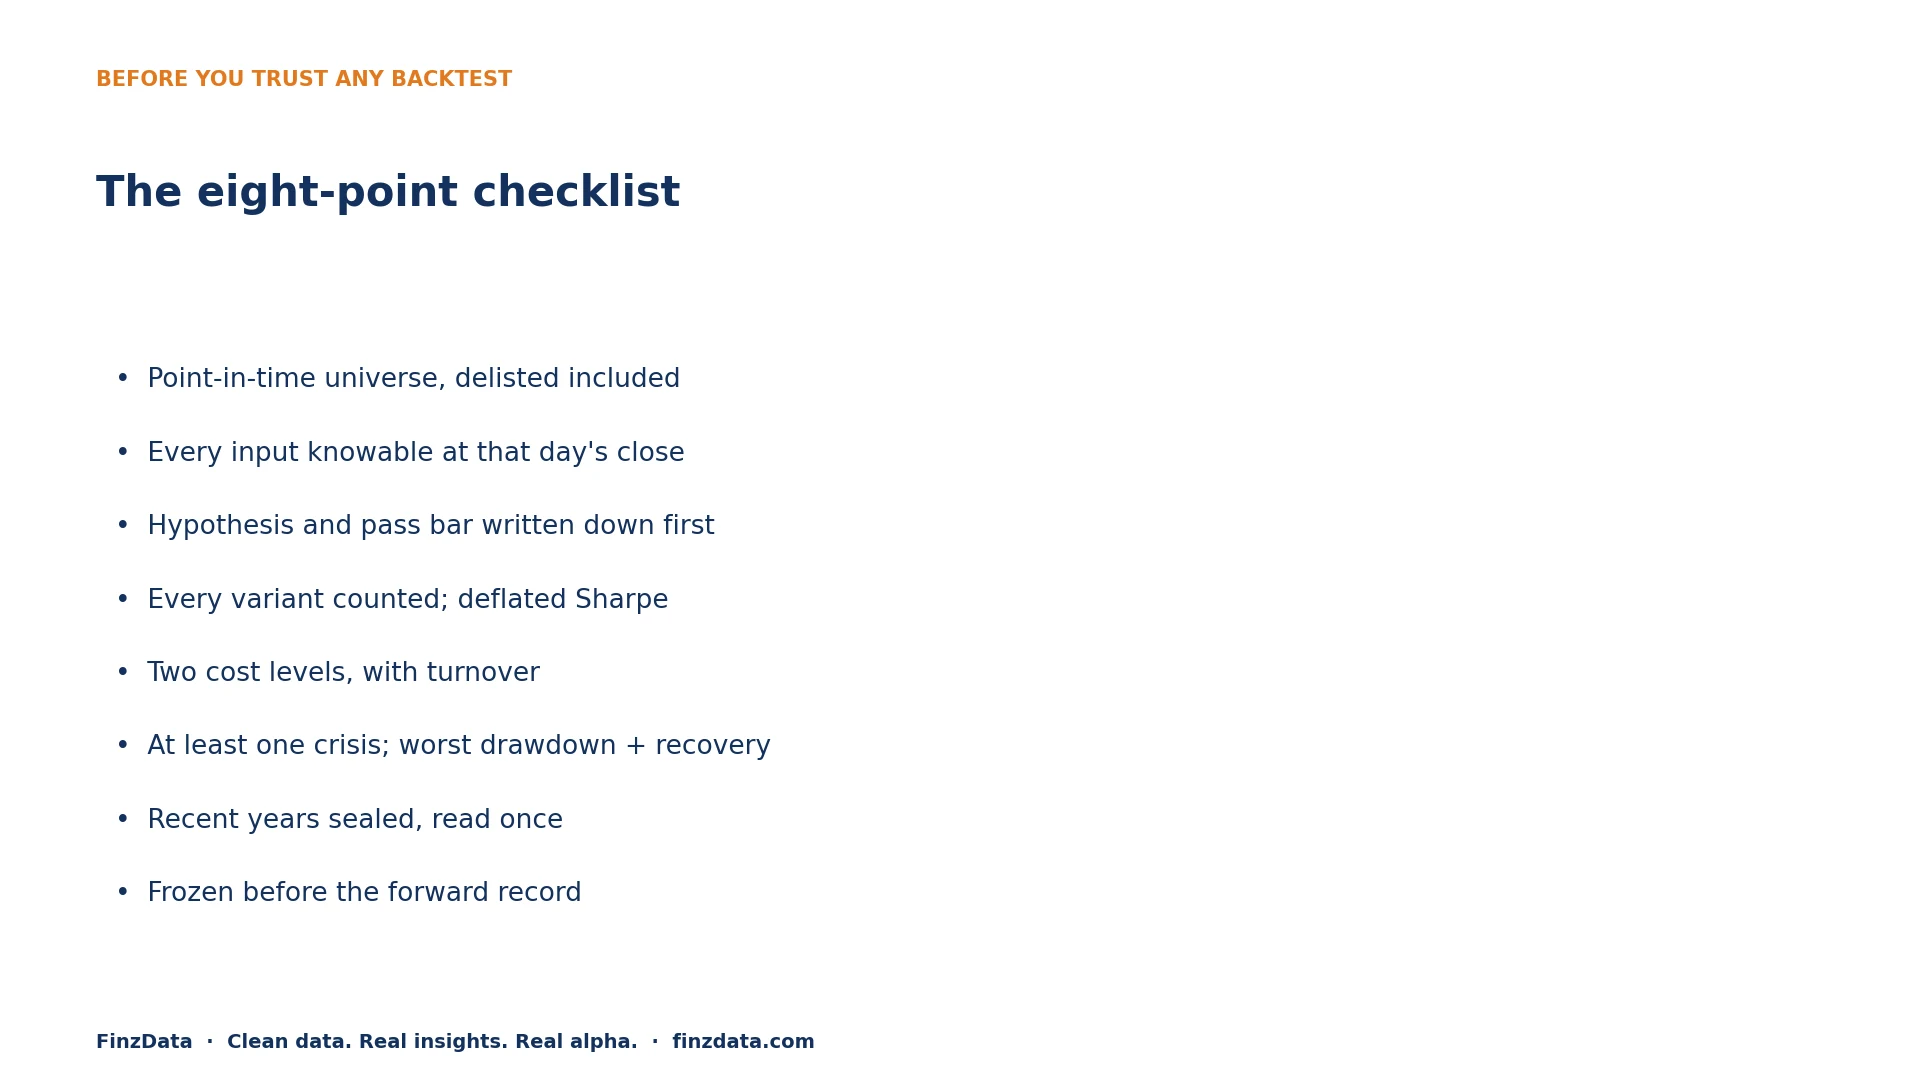
Eight checks before you trust any backtest, ours included.
- ☐ The universe is point-in-time, delisted companies included
- ☐ Every input was knowable at the close of the day it is used
- ☐ The hypothesis, parameters and pass bar were written down before the run
- ☐ Every variant tried is counted, and the deflated Sharpe is reported
- ☐ Results are shown at two cost levels, with turnover
- ☐ The test spans at least one crisis and reports worst drawdown and recovery time
- ☐ The most recent years were sealed and read once
- ☐ The strategy was frozen before its forward record started
Frequently asked questions
Is a high Sharpe ratio proof of skill?
No. Among 546 strategies with zero skill, luck alone produces a best 3-month Sharpe near 6 and about 87 strategies above 2. Judge a strategy on its deflated Sharpe, a t-statistic above about 3, a test through at least one crisis, and a forward record that starts after it was frozen.
What is survivorship bias in a backtest?
Testing on today's list of companies removes every company that went bankrupt, was delisted or was bought out, so long strategies look better than they were. FinzData covers 16,000+ US stocks that have traded on NYSE and Nasdaq since January 2000, delisted included, point in time.
What trading costs should a backtest use?
Run it at two levels, for example 0.20% and 0.60% per round trip, and report turnover. If the edge disappears at the higher level, it was never safe to trade.
How does FinzData count the variants I try?
A trial ledger counts every backtest per API key, and results report the deflated Sharpe for that count.
Download the deck (PDF, 10 slides) More research
Download the full research paper (PDF, 9 pages, with charts)
Related guides
- Survivorship-bias-free stock data
- Delisted stocks data for backtesting
- Point-in-time fundamentals for backtesting
- Historical stock data API
Sources
- McLean, R. D. and Pontiff, J. (2016). Does Academic Research Destroy Stock Return Predictability? Journal of Finance. doi.org/10.1111/jofi.12365
- Harvey, C. R., Liu, Y. and Zhu, H. (2016). …and the Cross-Section of Expected Returns. Review of Financial Studies. NBER w20592
- Bailey, D. H. and López de Prado, M. (2014). The Deflated Sharpe Ratio. Journal of Portfolio Management. SSRN 2460551
- Novy-Marx, R. and Velikov, M. (2016). A Taxonomy of Anomalies and Their Trading Costs. Review of Financial Studies. NBER w20721
- Strategy statistics: public statistics of 546 community strategies on a retail backtesting platform, read 21 October 2026.
Backtest it honestly yourself: pip install finzdata · 16,000+ US stocks since 2000, delisted included, point in time; 139 futures markets; options gamma (GEX) for single stocks, ETFs and the major indexes; 18,000+ macro series with every vintage; 1/5/15/30-minute, hourly and daily bars. From $19 a ticker.
Built for AI, quants, data scientists and financial analysts who backtest. Clean data. Real insights. Real alpha. finzdata.com. This material is for information only and is not investment advice.
Get FinzData research free, every morning
The daily brief: what moved, the macro releases that matter, positioning and liquidity, with charts. One email a day, free, unsubscribe anytime.
Topics and related searches
Backtesting and research integrity Quant models and market regimes Equity strategy and factors AI trading and forecasting
People also search
- why do backtests fail in live trading
- how to avoid overfitting a backtest
- what is survivorship bias in backtesting
- what is look-ahead bias
- is a high sharpe ratio luck
- what is the deflated sharpe ratio
- how much trading cost to use in a backtest
- how many trials before a backtest is significant
- best data for backtesting stocks with delisted companies
- how to tell if a trading strategy is real
- backtest checklist
- do published trading strategies stop working