
FinzData Research · Published 16 October 2026 · Updated 17 October 2026
Margin debt: is the fuel of the bull market running out?
FINRA margin debt set a record $1.502 trillion in June 2026 and its growth is now rolling over. An 18-slide study of three decades of margin debt: how it moves with the S&P 500, whether it leads, what it says about risk appetite, what happened after every margin peak since 1998, and what that implies for the S&P 500 today.
Get FinzData research free, every morning
The daily brief: what moved, the macro releases that matter, positioning and liquidity, with charts. One email a day, free, unsubscribe anytime.
Contents
- Key findings
- Margin debt is gas in a bull run
- Risk appetite is at a record
- Thirty years of margin debt
- Margin debt moves with the market
- Heavy borrowing weighs on later returns
- The signal is the rollover, not the level
- Margin debt peaked before each major bear market
- Where the signal failed
- Today: peaked and rolling
- After margin debt peaks: when does the market top?
- Two kinds of margin peak
- Mapping history onto the S&P 500 today
- What would confirm the peak
- The cycle cross-check
- Methodology and limitations
- Track it yourself
1. Margin debt: leverage, risk appetite and the S&P 500
A study of FINRA margin debt from January 1997 to September 2026 against S&P 500 (SPY) returns and drawdowns: what it measures, whether it leads, and where it stands now.
2. Key findings
Executive summary
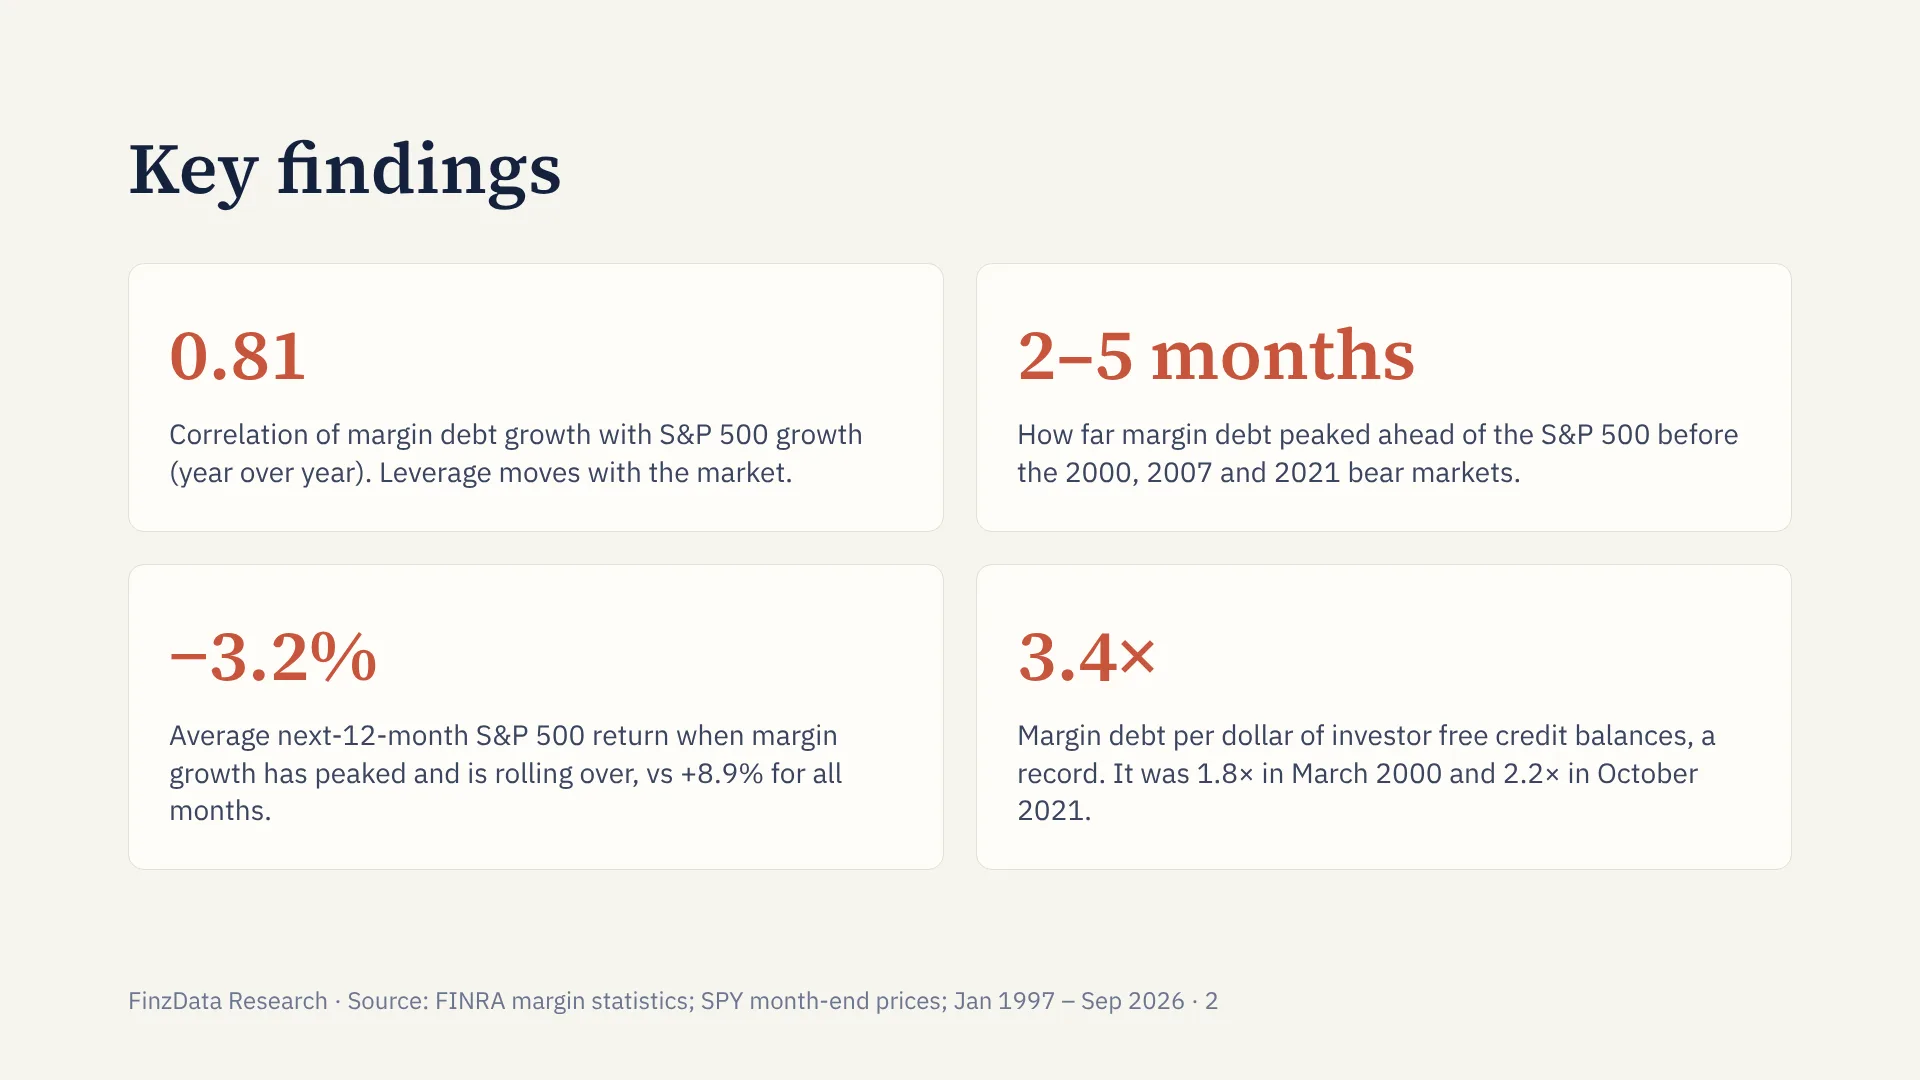
Margin debt moves with the market (0.81 correlation), but its rollover after a surge has marked higher drawdown risk, and leverage relative to investors’ cash is at a record 3.4×.
Four results frame the study. Margin debt is mostly a coincident indicator: its year-over-year growth moves with the S&P 500’s. Its warning value comes from the rollover after a surge, not from the level. Investor leverage measured against cash balances is at a record. And after every margin debt peak since 1998, the market high has come quickly, a median of 2.2 months later.
None of these is a timing signal on its own. Together they describe a late-cycle leverage profile that has, historically, come with higher drawdown risk over the following year.
3. Margin debt is gas in a bull run
What it measures
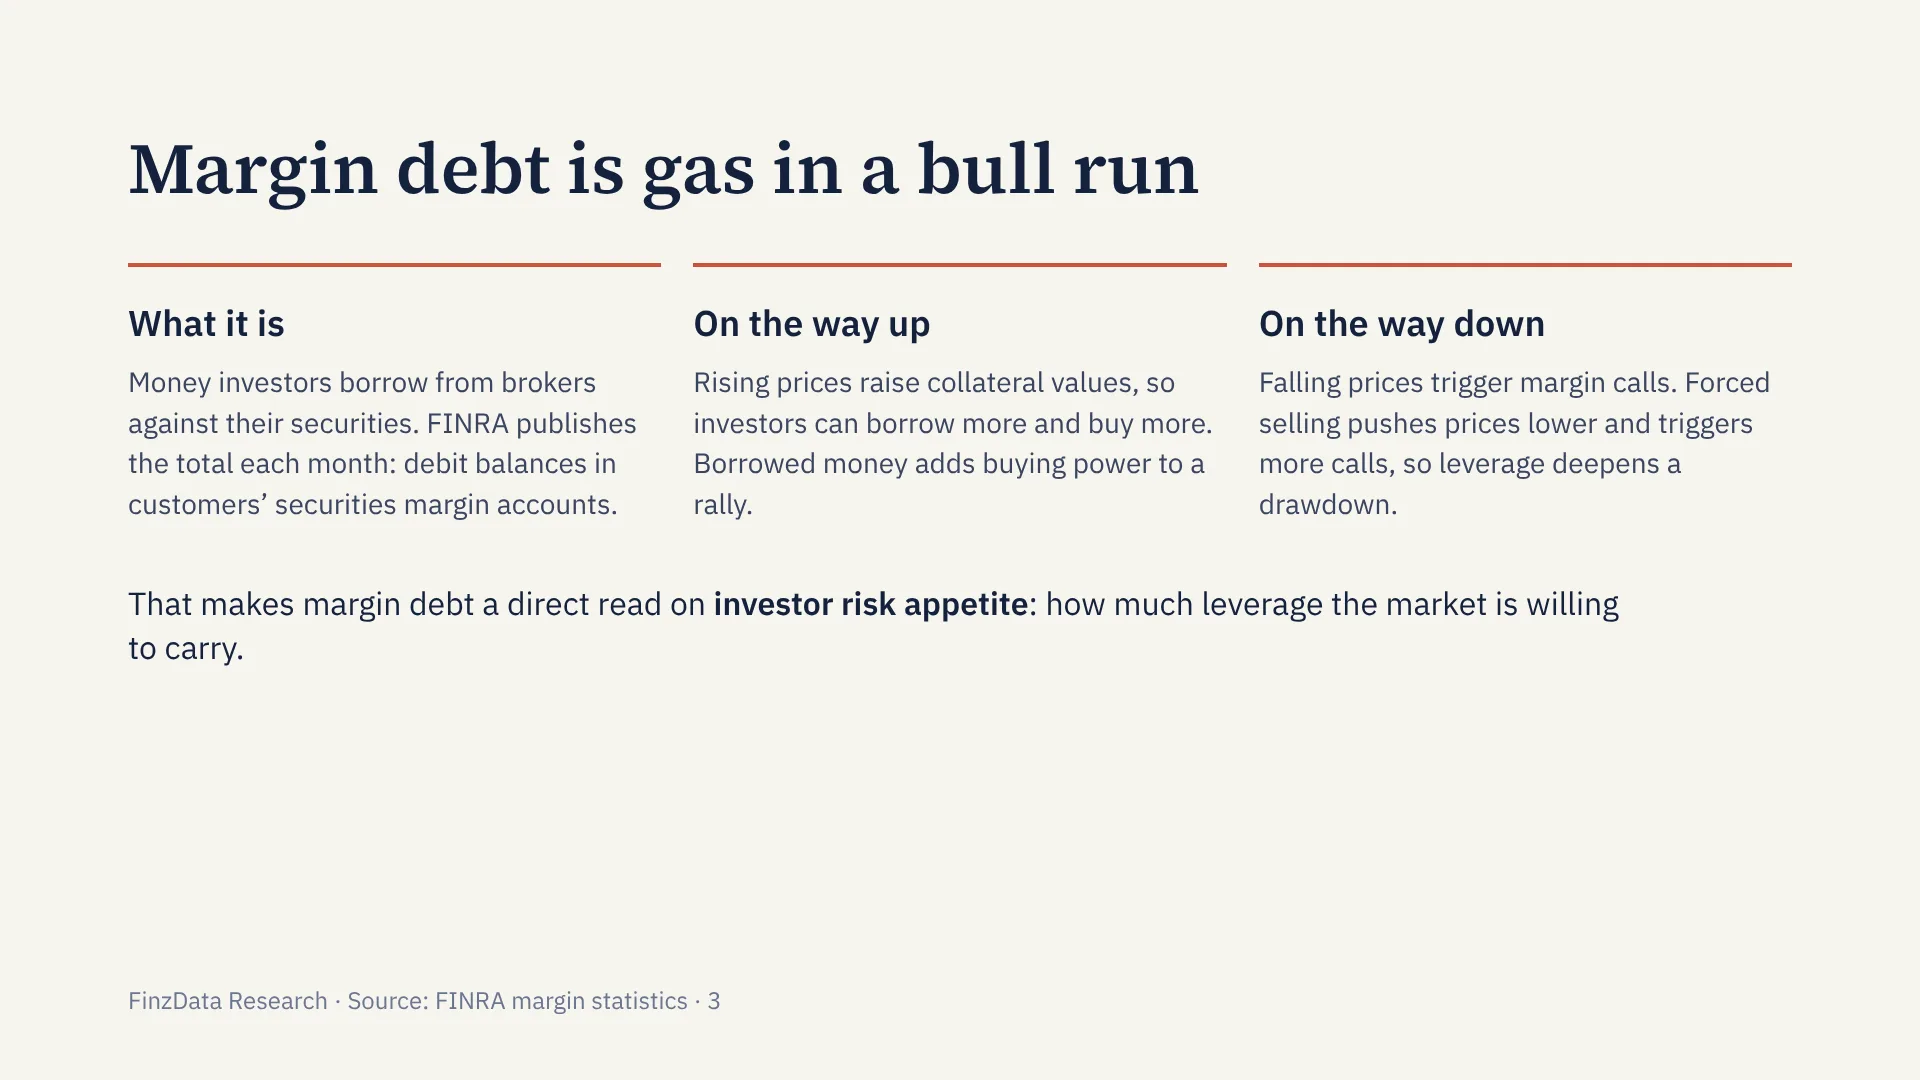
Borrowed money adds buying power on the way up; margin calls force selling on the way down. That makes margin debt a direct read on investor risk appetite.
Margin debt is FINRA debit balances in customers’ securities margin accounts. It is the amount investors borrow from brokers to purchase securities on margin. The series is published monthly by FINRA as part of its margin statistics and is widely used as a proxy for investor leverage in U.S. equities.
Leverage amplifies rallies. When prices rise, margin capacity expands, collateral values increase, and investors can add exposure with borrowed funds. That dynamic can accelerate upside moves and extend bull markets. The reverse is also true. When prices fall, leveraged positions face margin calls, forcing sales into a declining market. Forced deleveraging can amplify drawdowns and turn orderly corrections into sharper declines.
Because of this asymmetry, margin debt has long been discussed in the context of margin debt and stock market crashes, investor leverage, and the margin debt chart/history. The question is whether the series provides a reliable leading signal or whether it is simply a coincident measure of market sentiment.
4. Risk appetite is at a record
Risk appetite
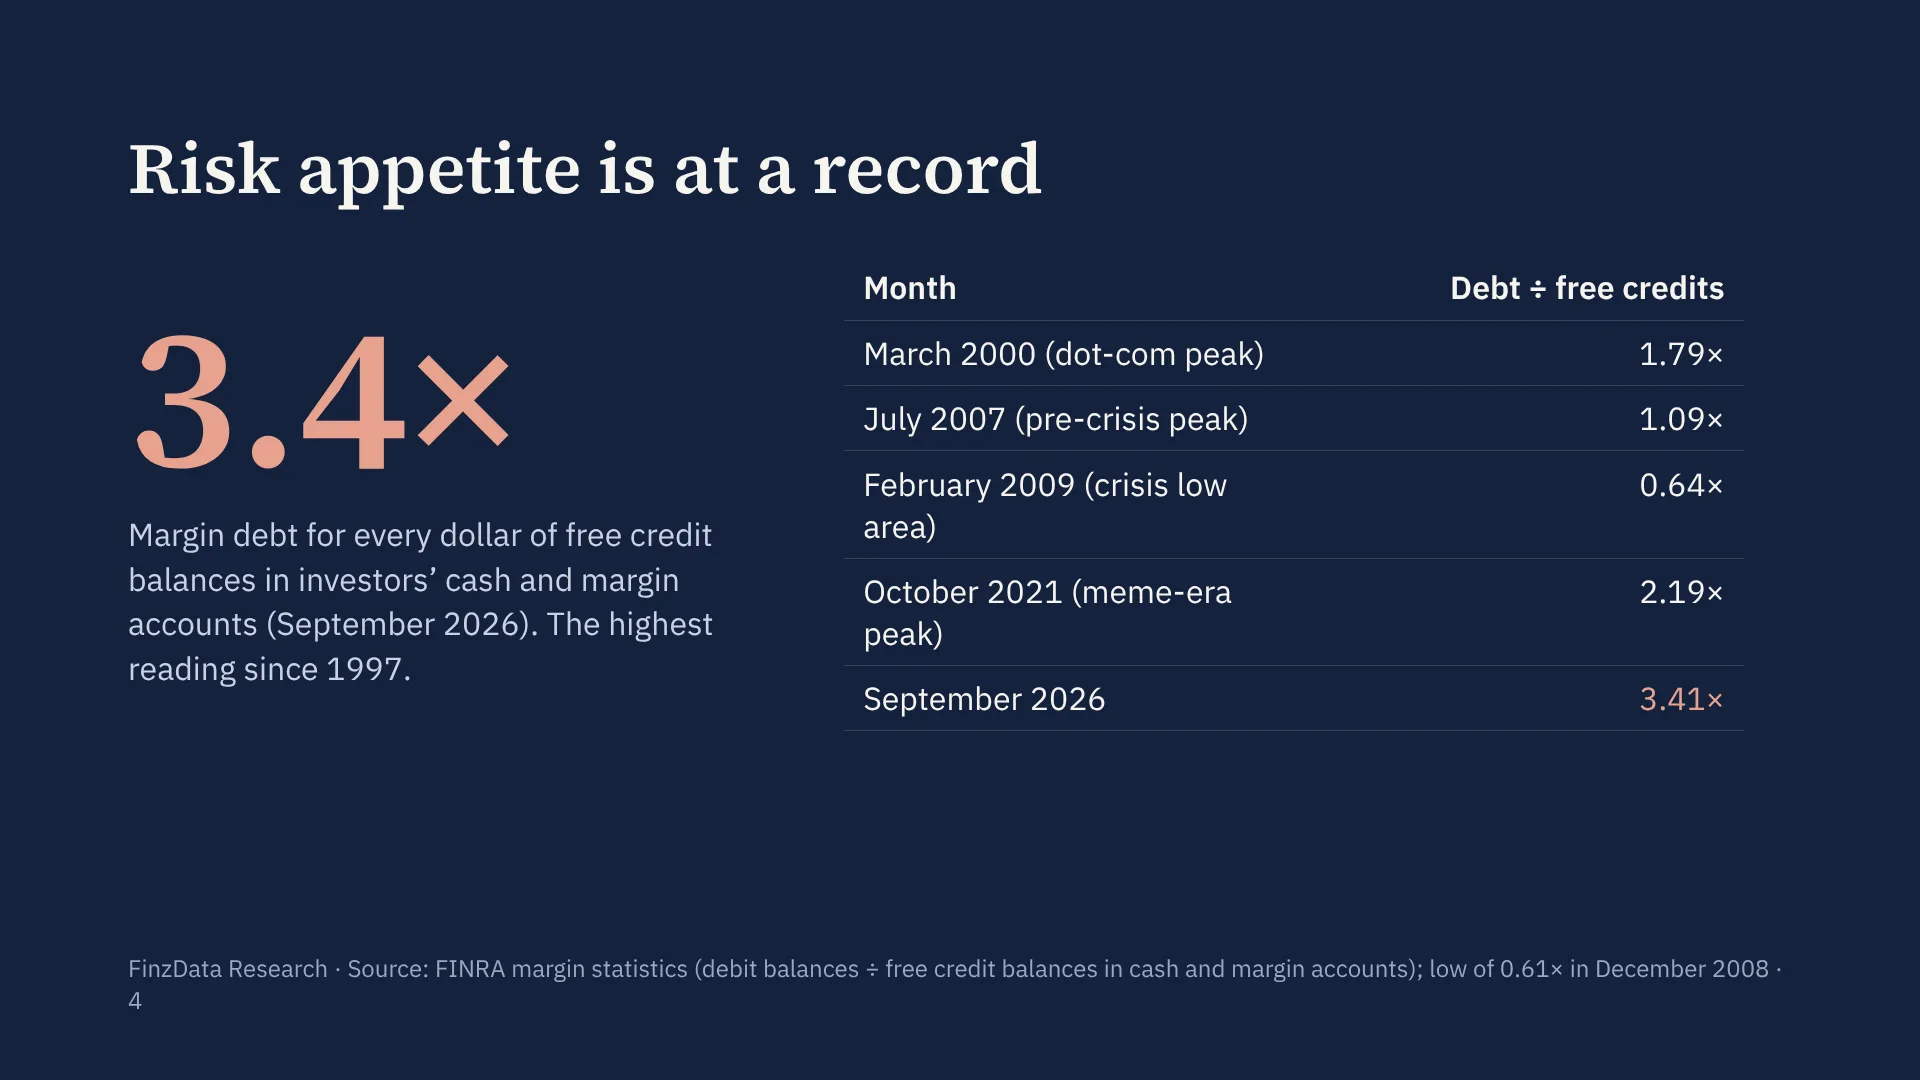
Margin debt is 3.4× investors’ free credit balances, the highest since 1997, versus 1.8× at the March 2000 peak and 2.2× in October 2021.
FINRA also publishes the free credit balances investors hold in cash and margin accounts: the idle cash at brokers that can absorb losses or fund new purchases. Dividing margin debt by those balances gives a simple measure of risk appetite: how much borrowed money sits against each dollar of cushion.
That ratio reached 3.41× in September 2026, the highest since the series began in 1997. It was 1.79× at the March 2000 peak, 1.09× in July 2007 and 2.19× in October 2021, and bottomed at 0.61× in December 2008. Investors are carrying more leverage relative to their cash than at any previous peak. The ratio is nominal and is not scaled to market value.
5. Thirty years of margin debt
History
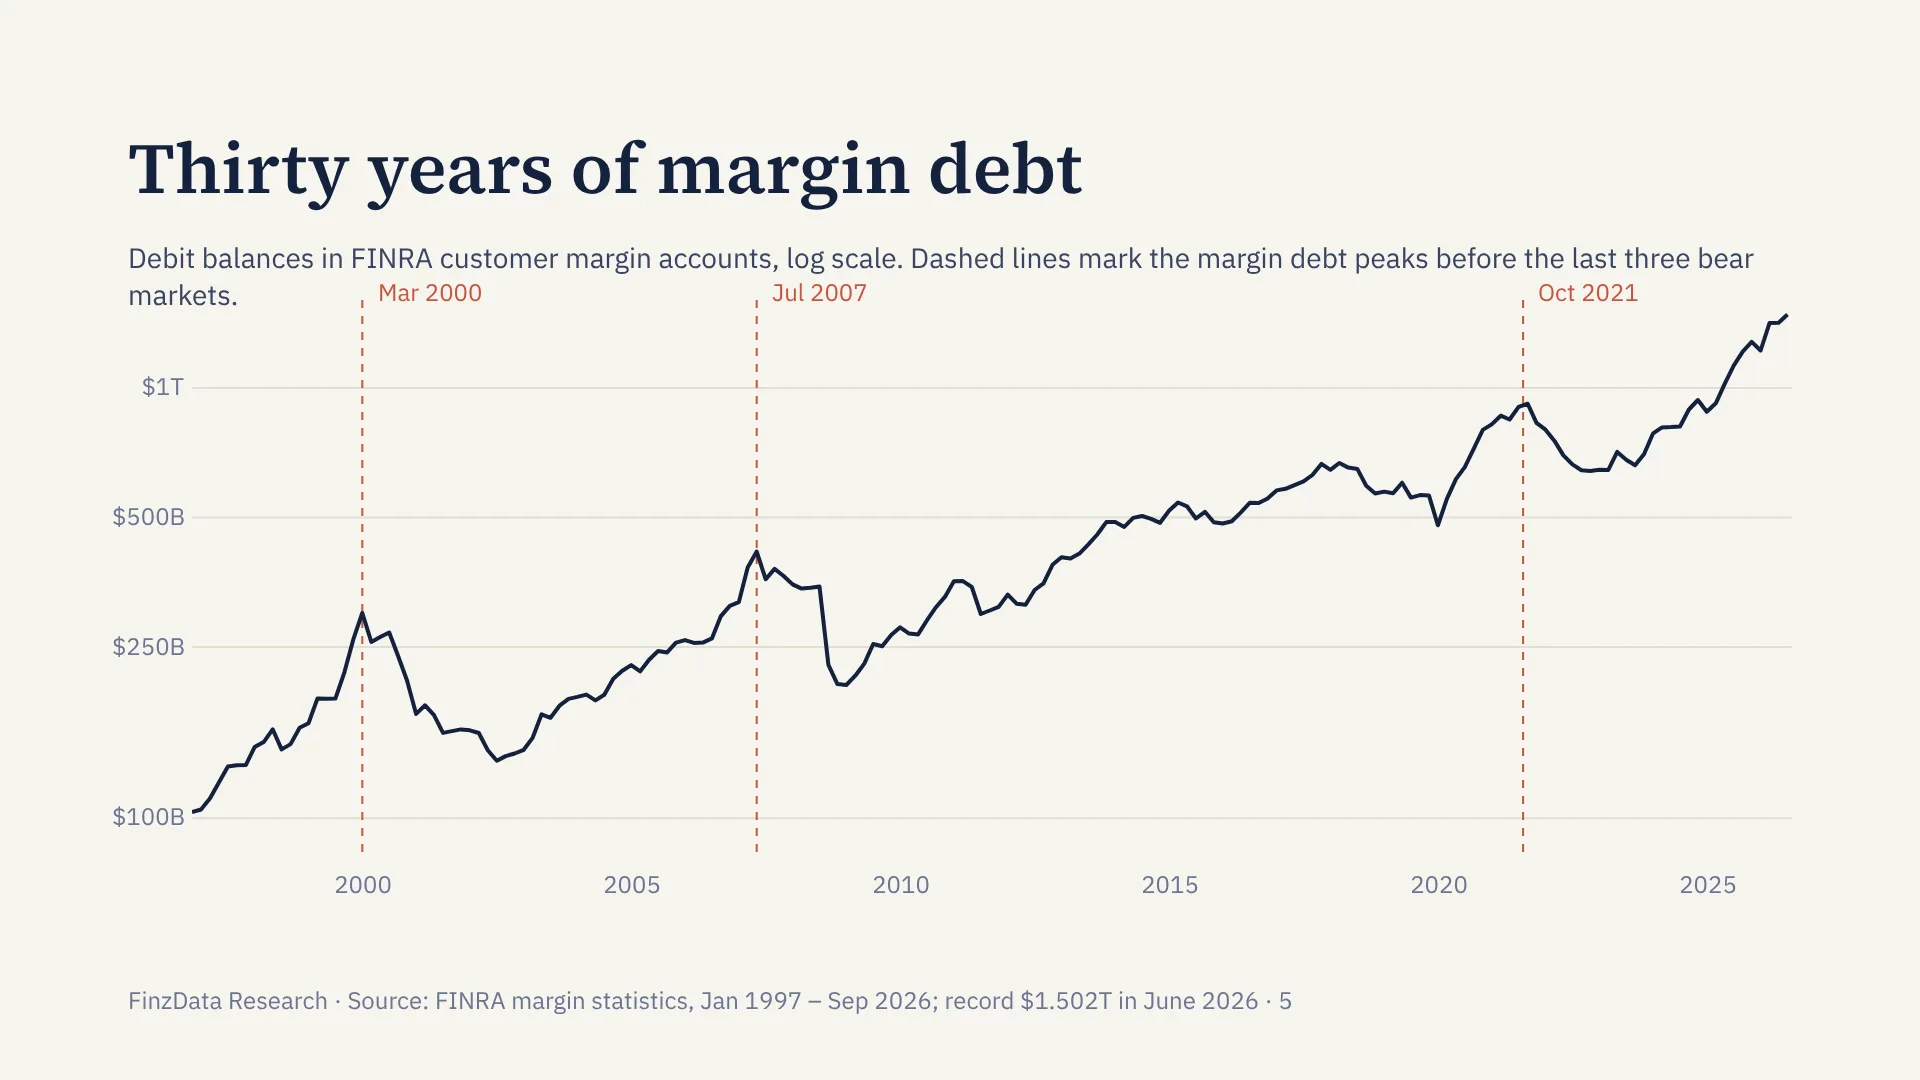
Margin debt rose from about $100B to a record $1.502T in June 2026. Each prior surge ended with margin debt falling 35–54% from its peak.
Margin debt has grown roughly fifteen-fold since 1997, from about $100 billion to a record $1.502 trillion in June 2026. Much of that growth reflects higher asset values, but the path is not smooth: each prior surge in borrowing ended in a sharp deleveraging.
Margin debt fell 55% after March 2000, 52% after July 2007 and 35% after October 2021. Those declines ran alongside the bear markets that followed, as falling prices triggered margin calls and forced selling.
6. Margin debt moves with the market
Finding 1 · Coincident
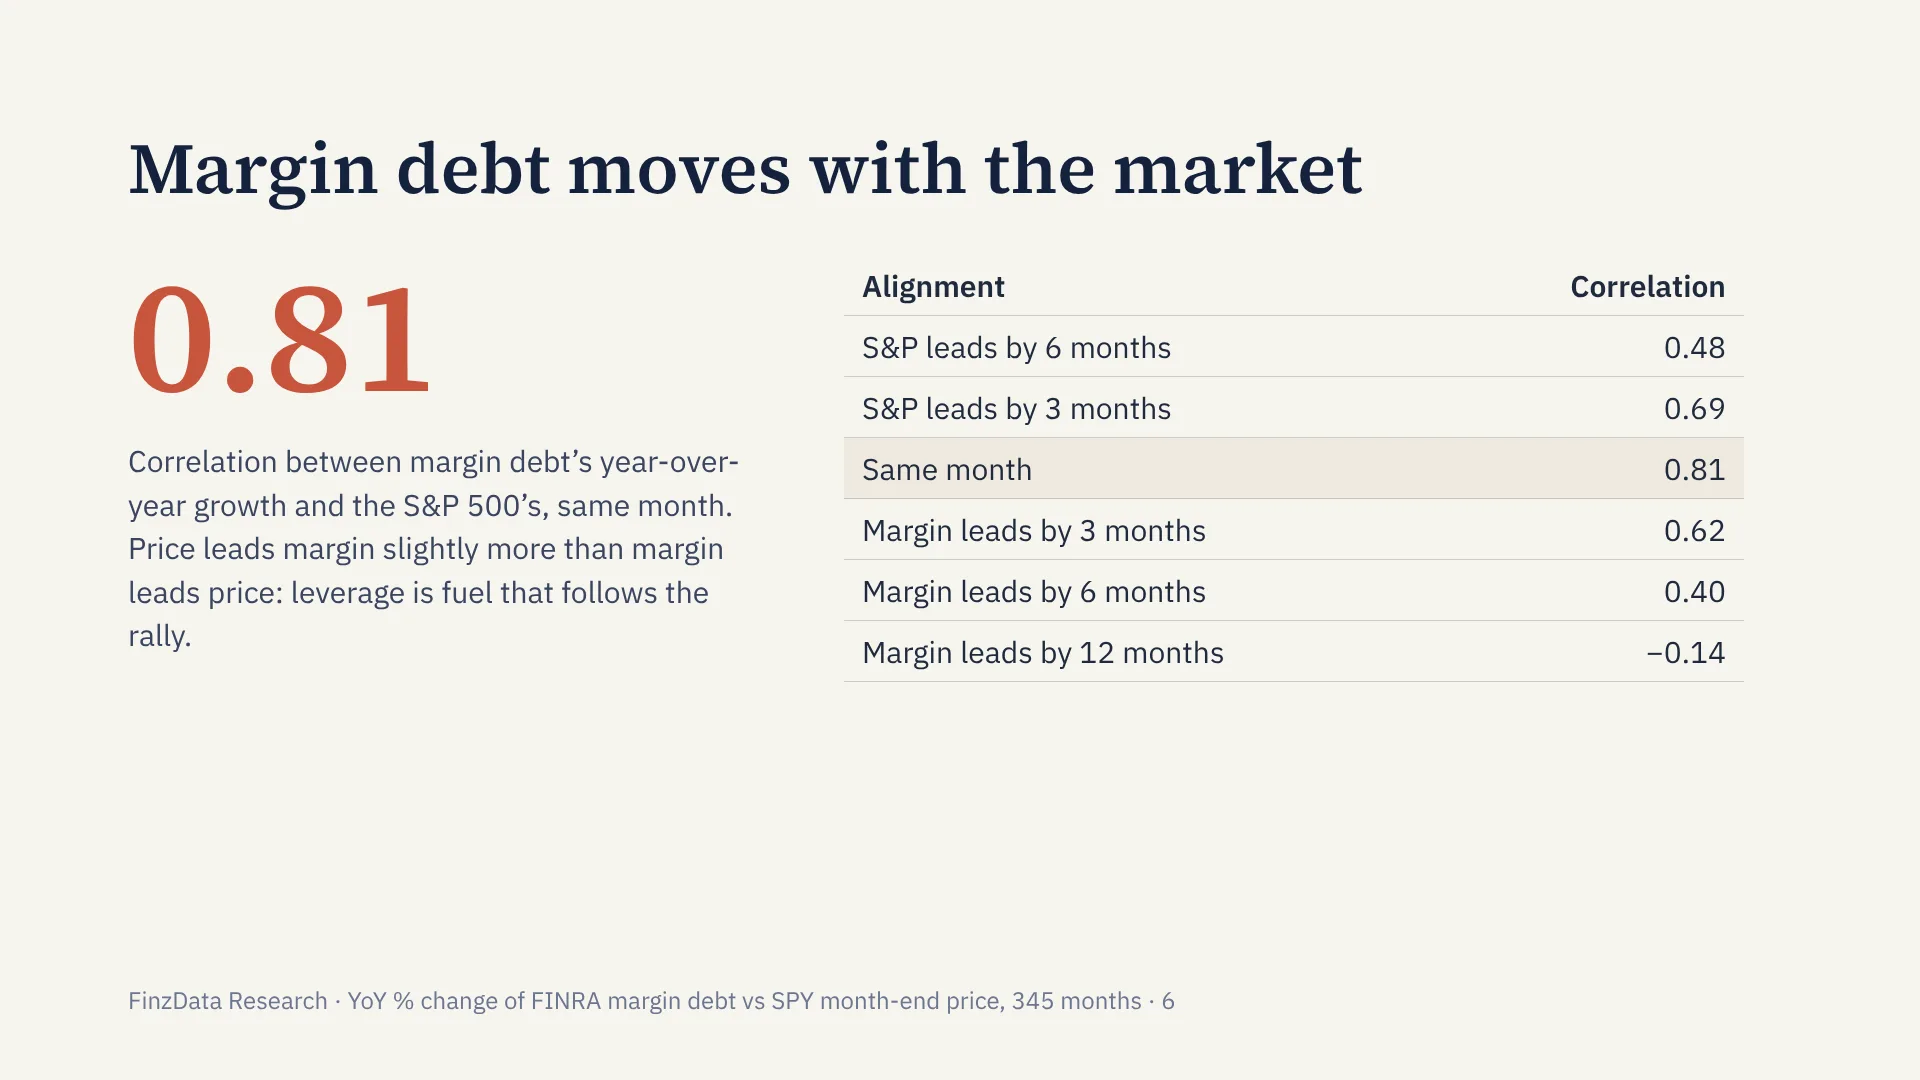
Year-over-year margin growth tracks S&P 500 growth with a 0.81 correlation in the same month. Price leads margin slightly more than the reverse: leverage is fuel that follows the rally.
Year-over-year margin growth and SPY year-over-year returns move together closely. The contemporaneous correlation is 0.806 with n=345. That is a strong coincident relationship, consistent with margin debt rising in bull markets and falling in bear markets.
Lead-lag analysis shows how the relationship shifts with timing. The sign convention used here is positive lag = margin leads. The table below summarizes correlations of margin YoY versus SPY YoY at different lags.
| Lag months | Correlation |
|---|---|
| -6 | 0.484 |
| -3 | 0.691 |
| 0 | 0.806 |
| 3 | 0.621 |
| 6 | 0.402 |
| 12 | -0.14 |
The correlation peaks at zero lag and declines as the horizon moves away. A negative lag means SPY leads margin. The pattern indicates prices lead margin slightly more than the reverse. In practice, margin debt is fuel that follows price action rather than a clean leading indicator at short horizons. The correlation falls to -0.14 at a 12 month lag, consistent with mean reversion over longer periods.
7. Heavy borrowing weighs on later returns
Finding 2 · Horizon
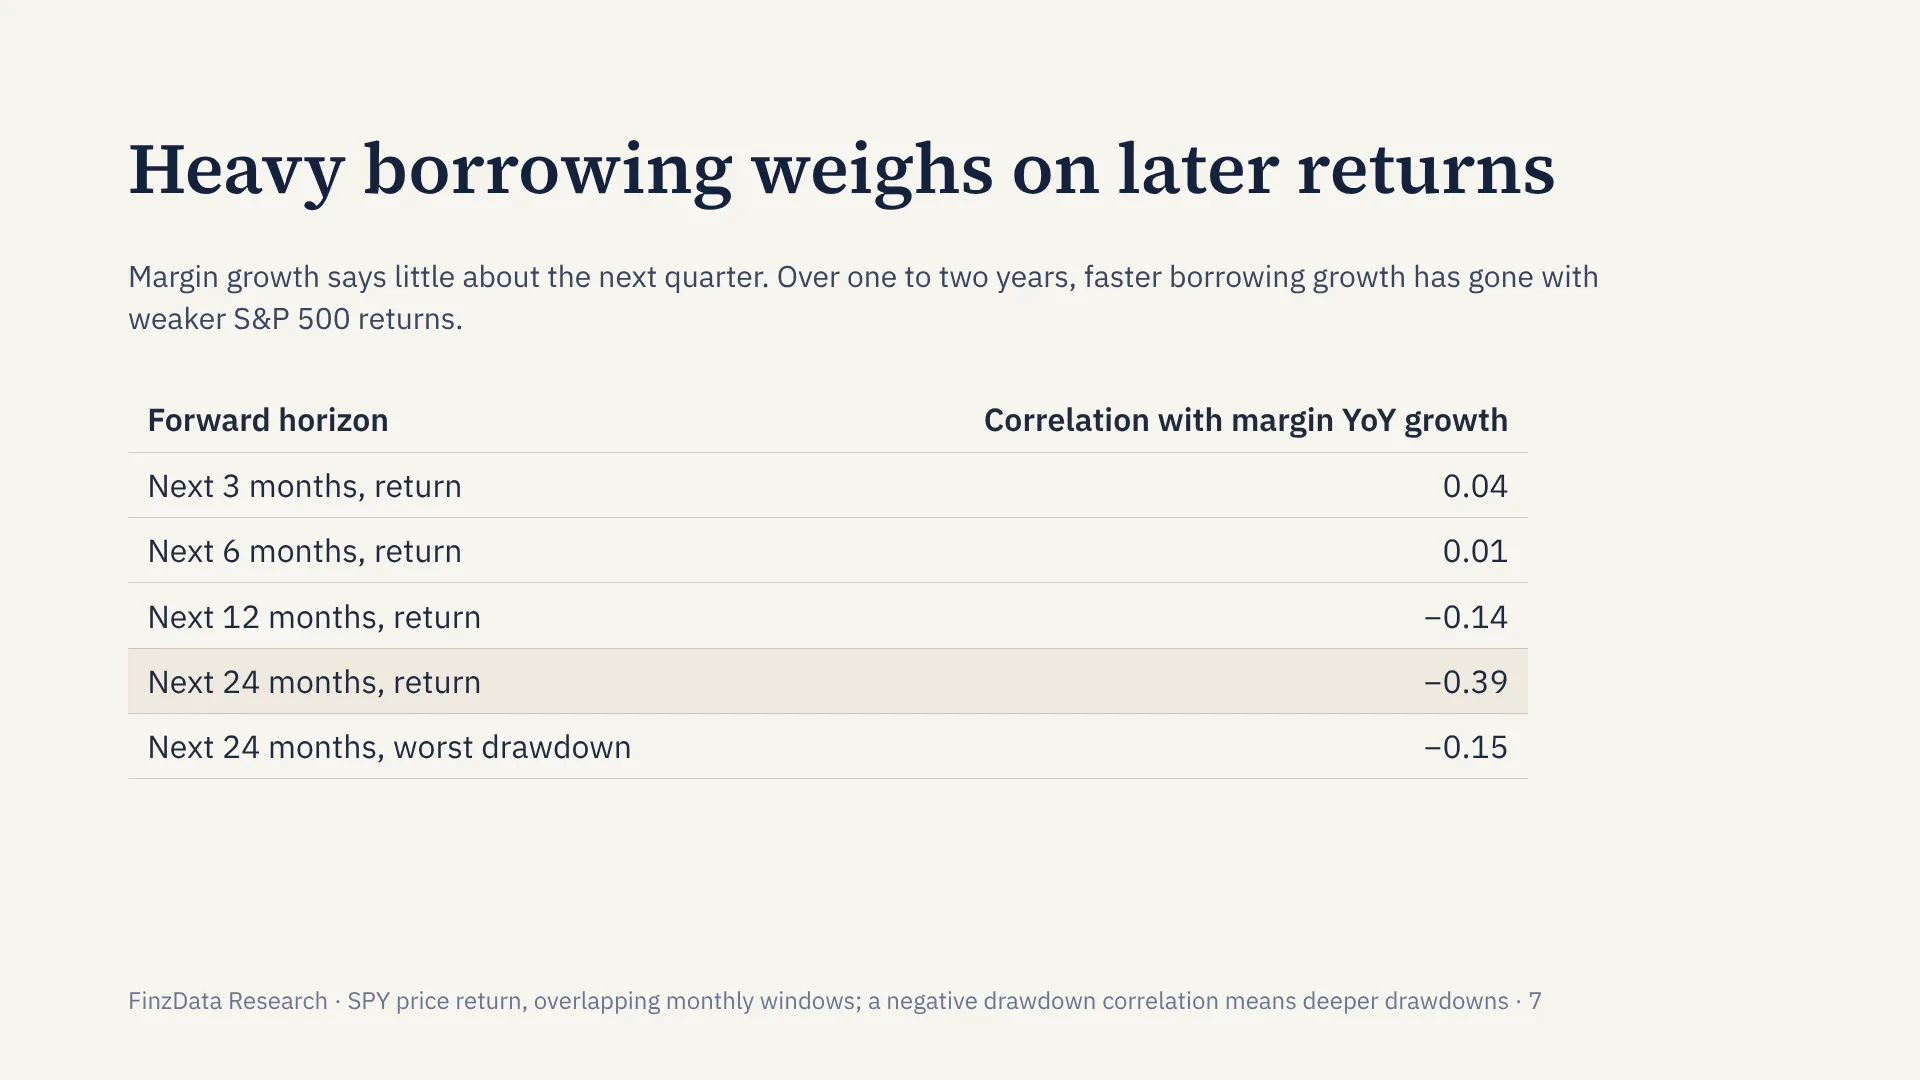
Margin growth says little about the next quarter, but over 24 months faster borrowing growth has gone with weaker returns (correlation −0.39).
Short-term predictive power is weak. Correlations of margin YoY with forward returns are near zero at 3 and 6 months: forward 3m 0.035, n=342; forward 6m 0.005, n=339. Forward max drawdown correlations are modestly positive at 3m 0.19 and 6m 0.169.
At longer horizons the sign flips. Forward 12m return correlation is -0.14, n=333, and forward 24m return correlation is -0.385, n=321. Forward max drawdown correlation at 24m is -0.154. The negative sign suggests that very high margin growth today is associated with weaker returns over the following one to two years. This is consistent with the idea that extreme leverage builds late in cycles and is vulnerable to reversals.
The result does not imply timing precision. It reflects a statistical tendency across many months, with overlapping samples and a small number of independent episodes.
8. The signal is the rollover, not the level
Finding 3 · Regimes
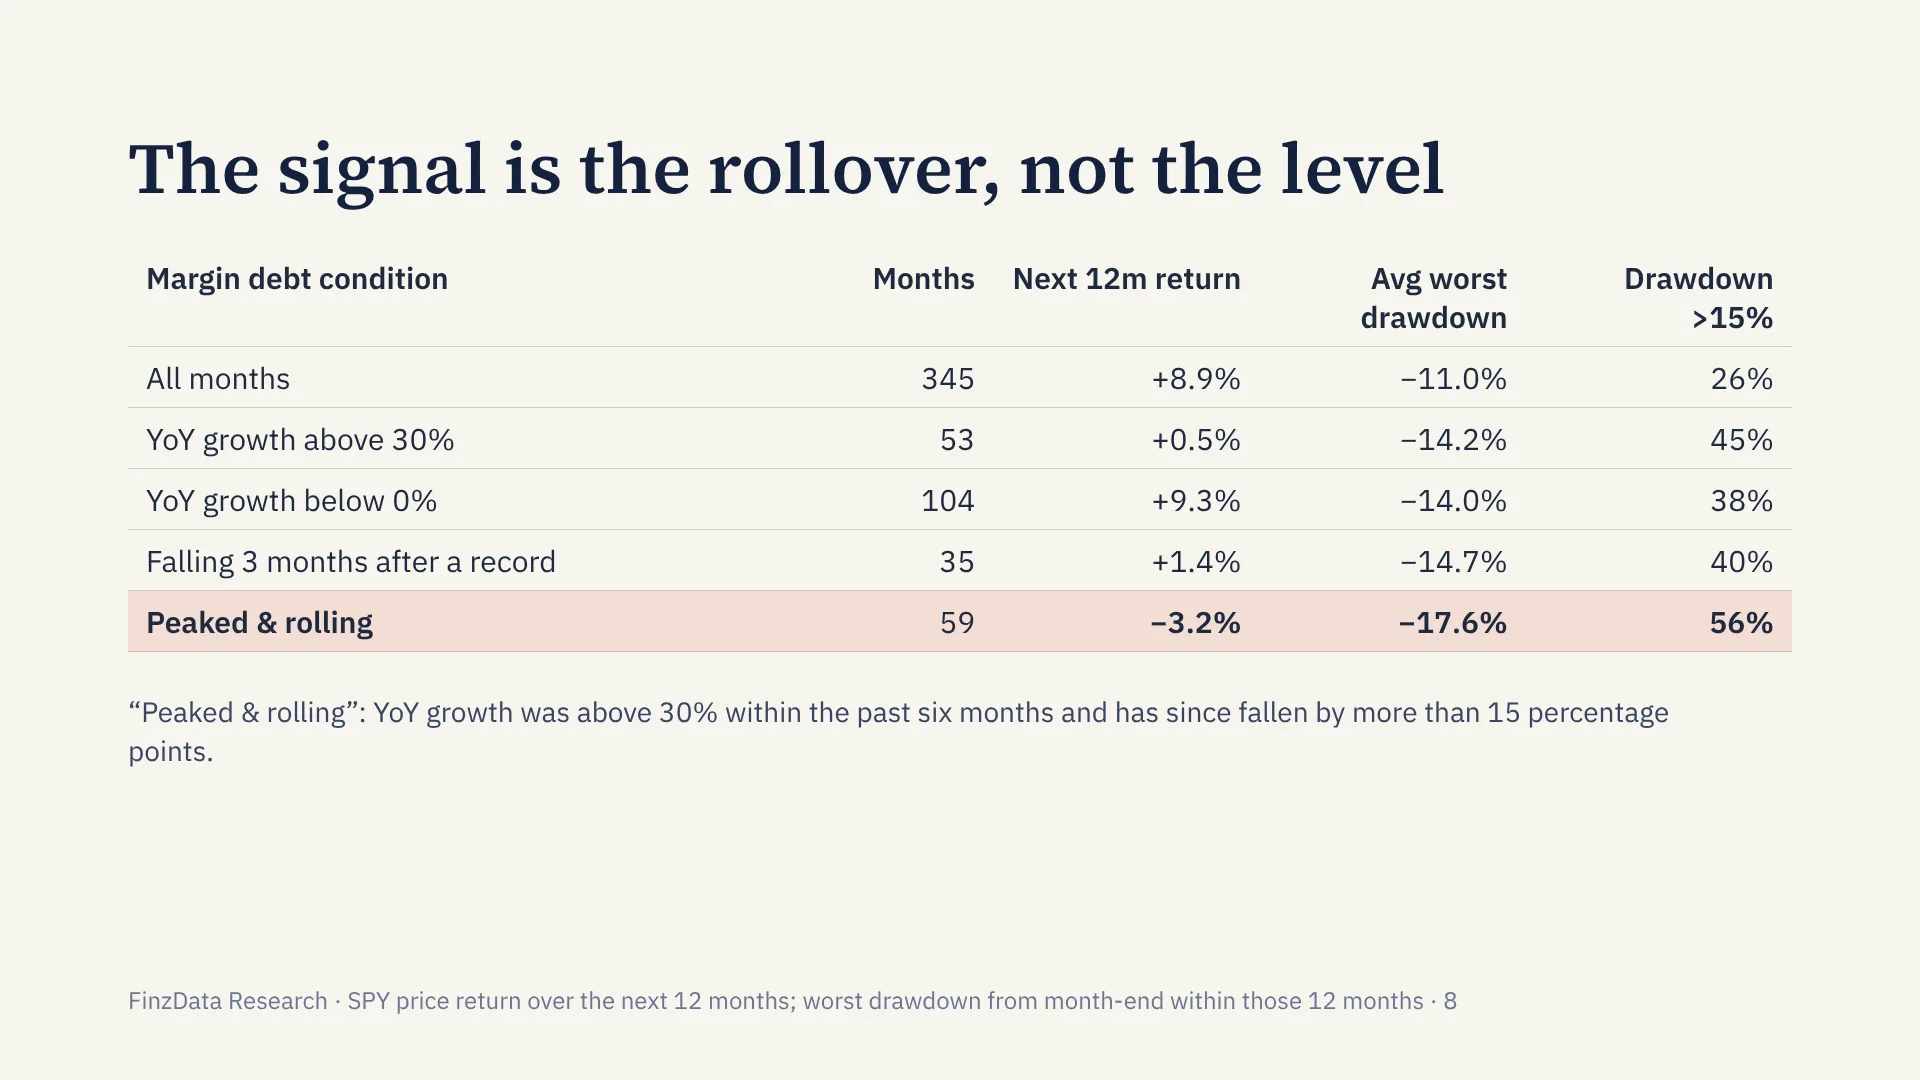
When YoY growth topped 30% and then fell more than 15 points, the next 12 months averaged −3.2% (vs +8.9% for all months) and 56% saw a drawdown worse than 15% (vs 26%).
Regime analysis conditions forward outcomes on the state of margin growth. The table below summarizes average forward 12 month return, average maximum drawdown over 12 months, and the share of months with a drawdown worse than -15%.
| Regime | n | Avg fwd 12m % | Avg max DD 12m % | % DD <-15% |
|---|---|---|---|---|
| All months | 345 | 8.9 | -11.0 | 26 |
| YoY >30% | 53 | 0.5 | -14.2 | 45 |
| YoY <0% | 104 | 9.3 | -14.0 | 38 |
| Peaked & rolling | 59 | -3.2 | -17.6 | 56 |
| Debit 3m down after record | 35 | 1.4 | -14.7 | 40 |
The peaked & rolling regime is defined as YoY was greater than 30% within the prior 6 months and has since fallen by more than 15 percentage points. This regime captures rollovers from elevated leverage. Average next-12m return is -3.2% versus +8.9% for all months. The average maximum drawdown over 12 months is -17.6% versus -11.0% unconditional. Fifty-six percent of months in this regime see a drawdown worse than -15%, compared with 26% unconditional.
High YoY growth alone, YoY >30%, also shows deterioration: average forward 12m return 0.5% and 45% of cases with a drawdown worse than -15%. Negative YoY, YoY <0%, shows a higher average forward return 9.3% but still elevated drawdown risk at 38%, reflecting the mixed nature of deleveraging periods.
9. Margin debt peaked before each major bear market
Finding 4 · Bear markets
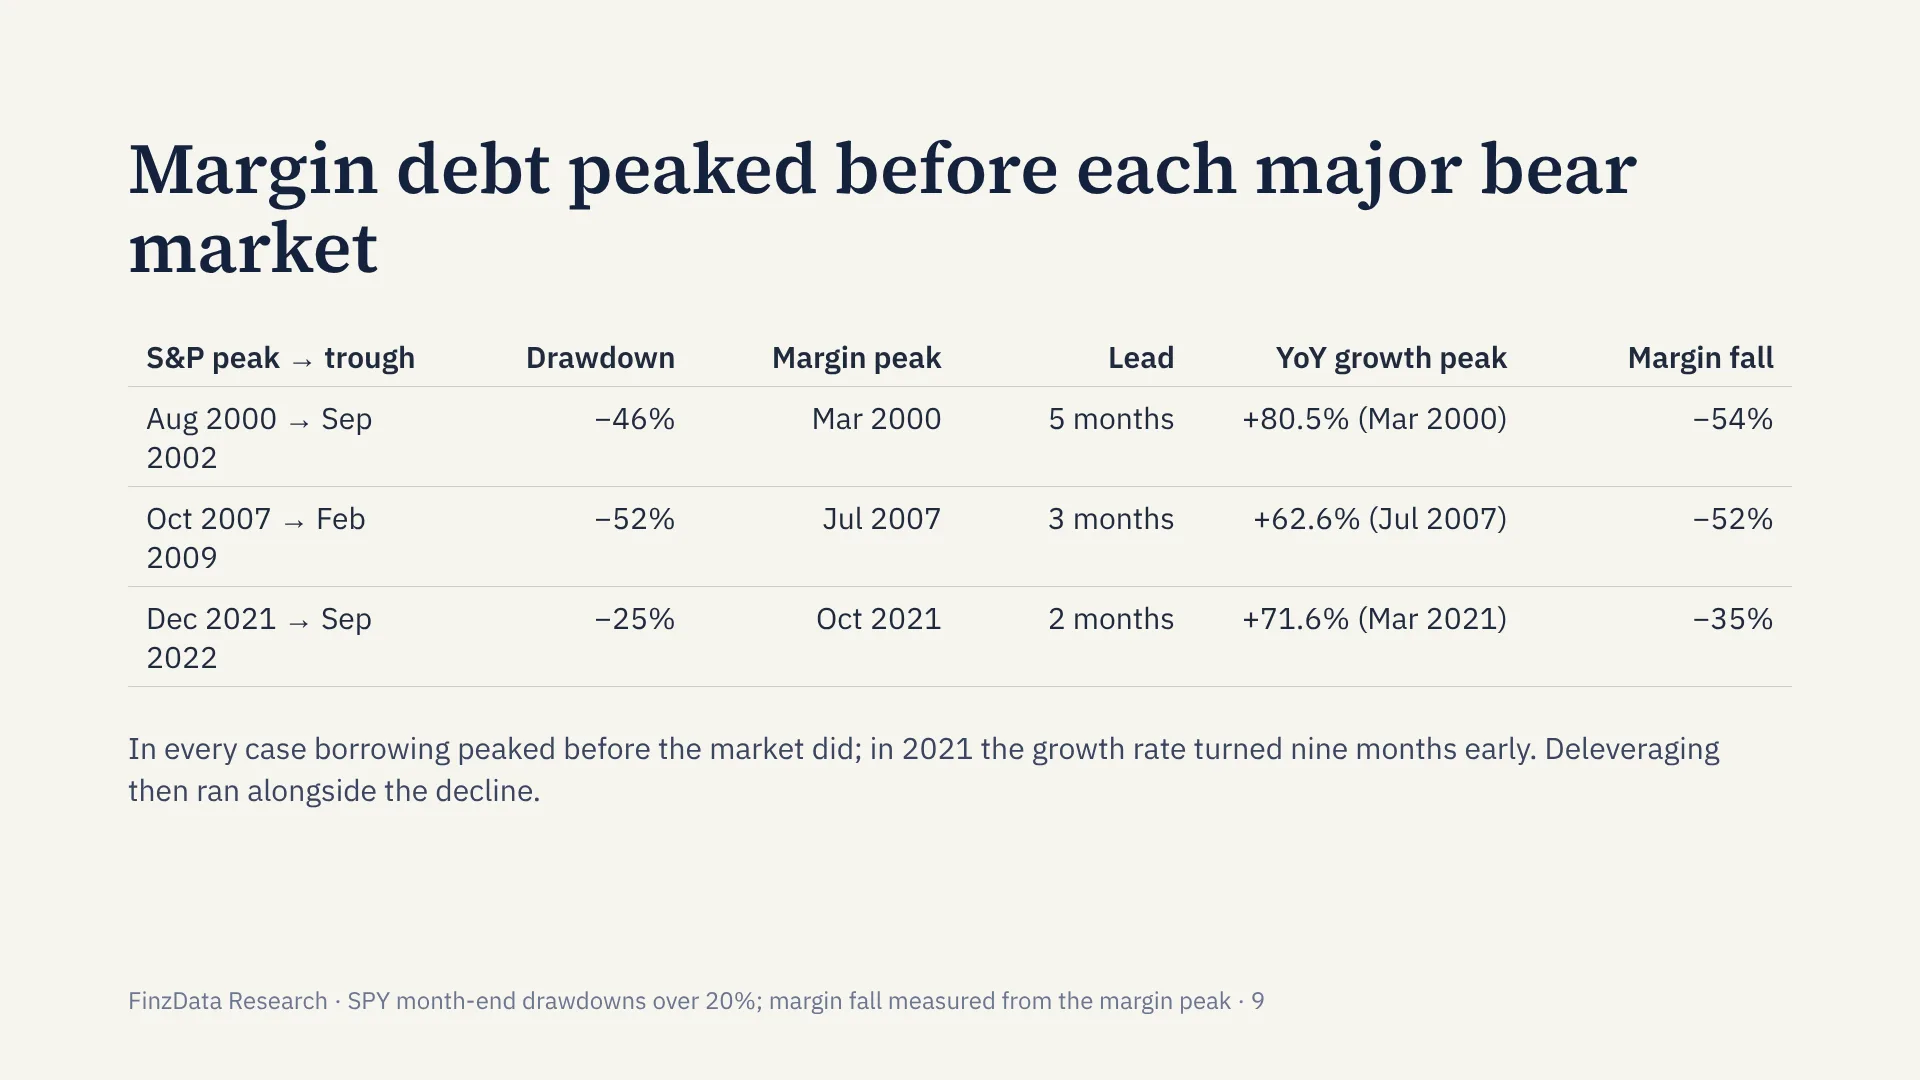
Margin debt peaked 2–5 months before the S&P 500 in 2000, 2007 and 2021; in 2021 the growth rate turned nine months early.
Margin debt peaked before the SPY peaks in the three largest drawdowns since 1997. The table summarizes SPY peak, trough, maximum drawdown, margin peak, lead time, YoY peak, and margin decline from peak to trough.
| SPY peak | Trough | Max DD | Margin peak | Lead months | YoY peak | YoY peak val | Margin drop % |
|---|---|---|---|---|---|---|---|
| 2000-08 | 2002-09 | -46.3 | 2000-03 | 5 | 2000-03 | 80.5 | -53.6 |
| 2007-10 | 2009-02 | -52.2 | 2007-07 | 3 | 2007-07 | 62.6 | -52.1 |
| 2021-12 | 2022-09 | -24.8 | 2021-10 | 2 | 2021-03 | 71.6 | -35.2 |
Margin debt peaked 2 to 5 months before each SPY peak. In 2000, margin peaked in March 2000 with YoY 80.5%, five months before the August 2000 SPY peak. In 2007, margin peaked in July 2007 with YoY 62.6%, three months before the October 2007 SPY peak. In 2021-2022, margin peaked in October 2021, two months before the December 2021 SPY peak, with YoY peaking earlier in March 2021 at 71.6%.
The subsequent margin declines were large: -53.6% from peak to trough in the dot-com bust, -52.1% in the financial crisis, and -35.2% in 2022. These episodes illustrate how margin debt and stock market crashes can coincide with forced deleveraging after peaks.
10. Where the signal failed
Limits
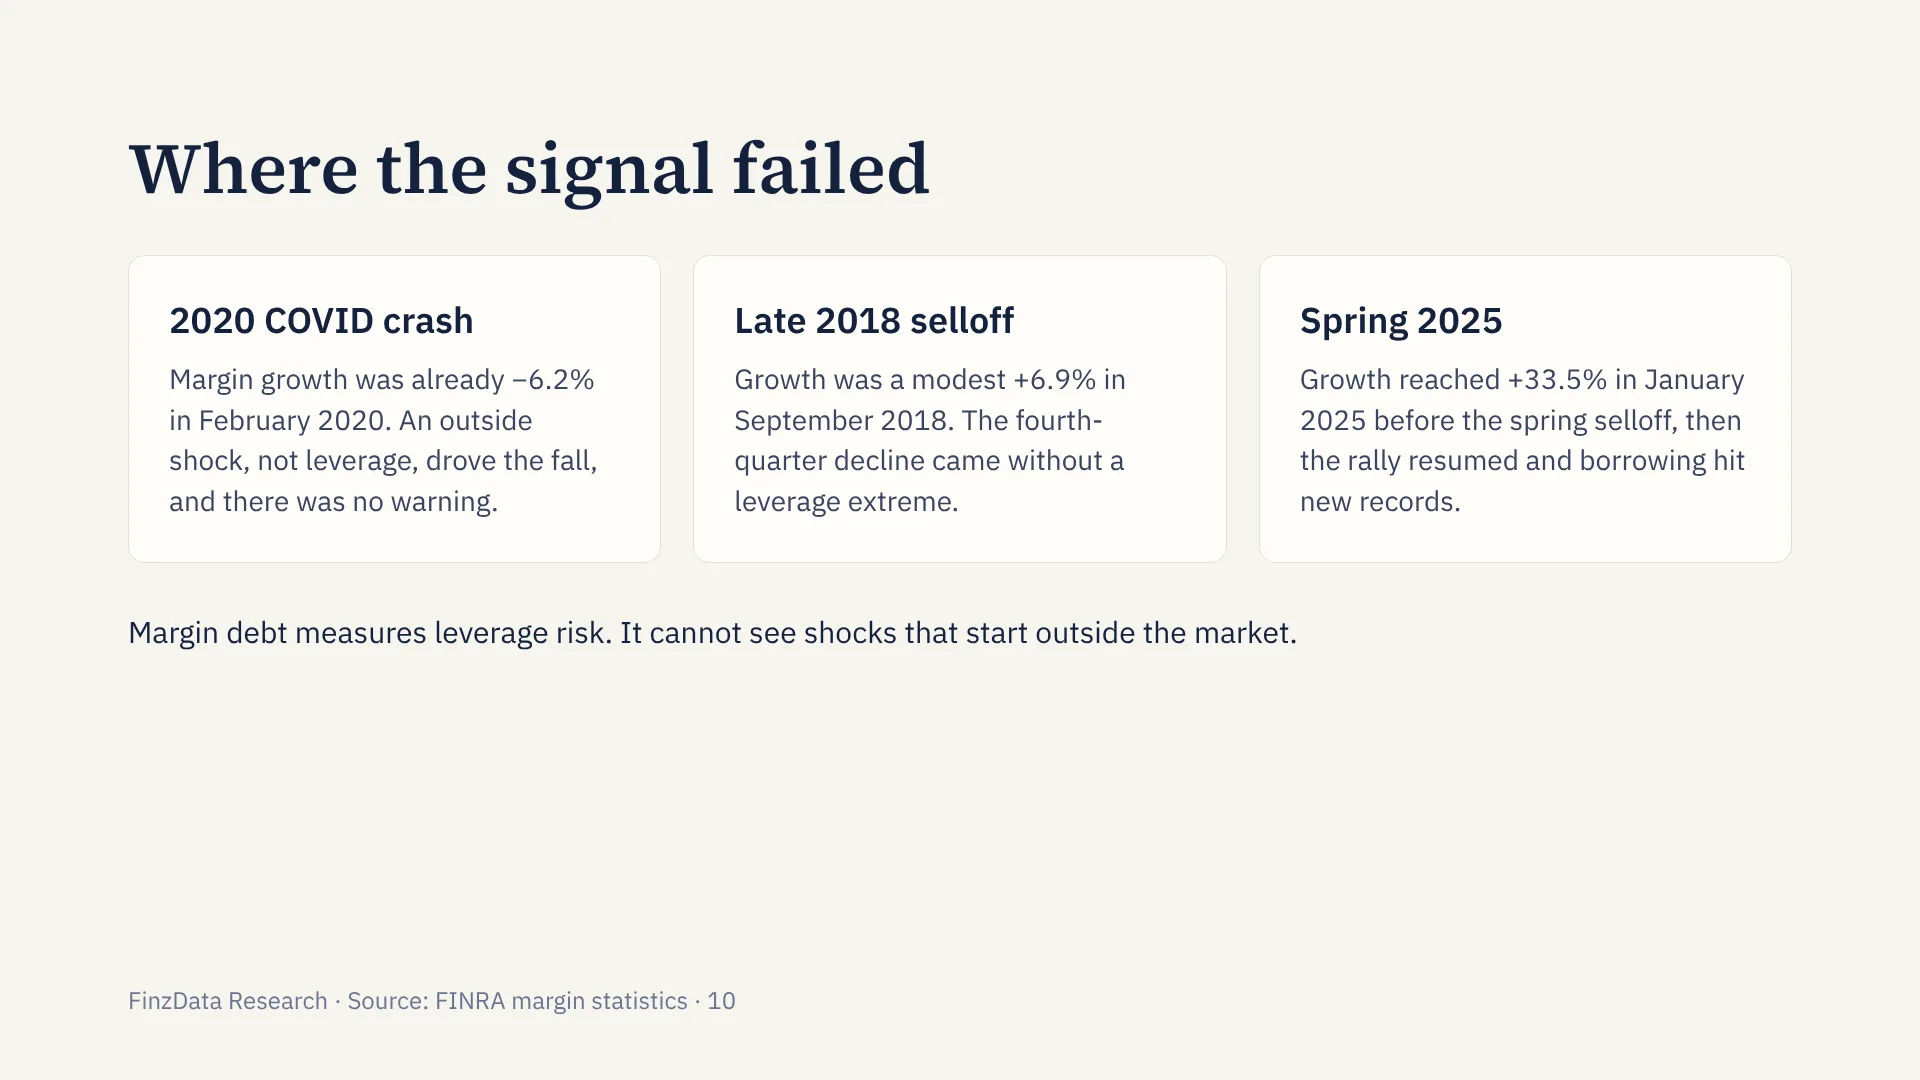
It gave no warning of the 2020 COVID crash or the late-2018 selloff, and the January 2025 surge was followed by a correction and then new highs. Margin debt measures leverage risk, not outside shocks.
Margin debt is not a universal early warning system. Exogenous shocks can override leverage dynamics.
The 2020 COVID crash is a clear example. Margin YoY was already negative at -6.2% in February 2020, so the signal gave no warning of the abrupt drawdown that followed. The shock was external and rapid, not driven by a leverage build-up.
The 2018 Q4 selloff also shows limited signal. YoY margin growth in September 2018 was +6.9%, not extreme, and the subsequent decline was modest relative to major bear markets.
Early 2025 provides a more recent illustration. YoY margin growth reached +33.5% in January 2025 before the spring 2025 selloff. The level was elevated but not unprecedented, and the timing was not precise.
These cases reinforce that margin debt leading indicator properties are statistical tendencies, not deterministic rules.
11. Today: peaked and rolling
September 2026
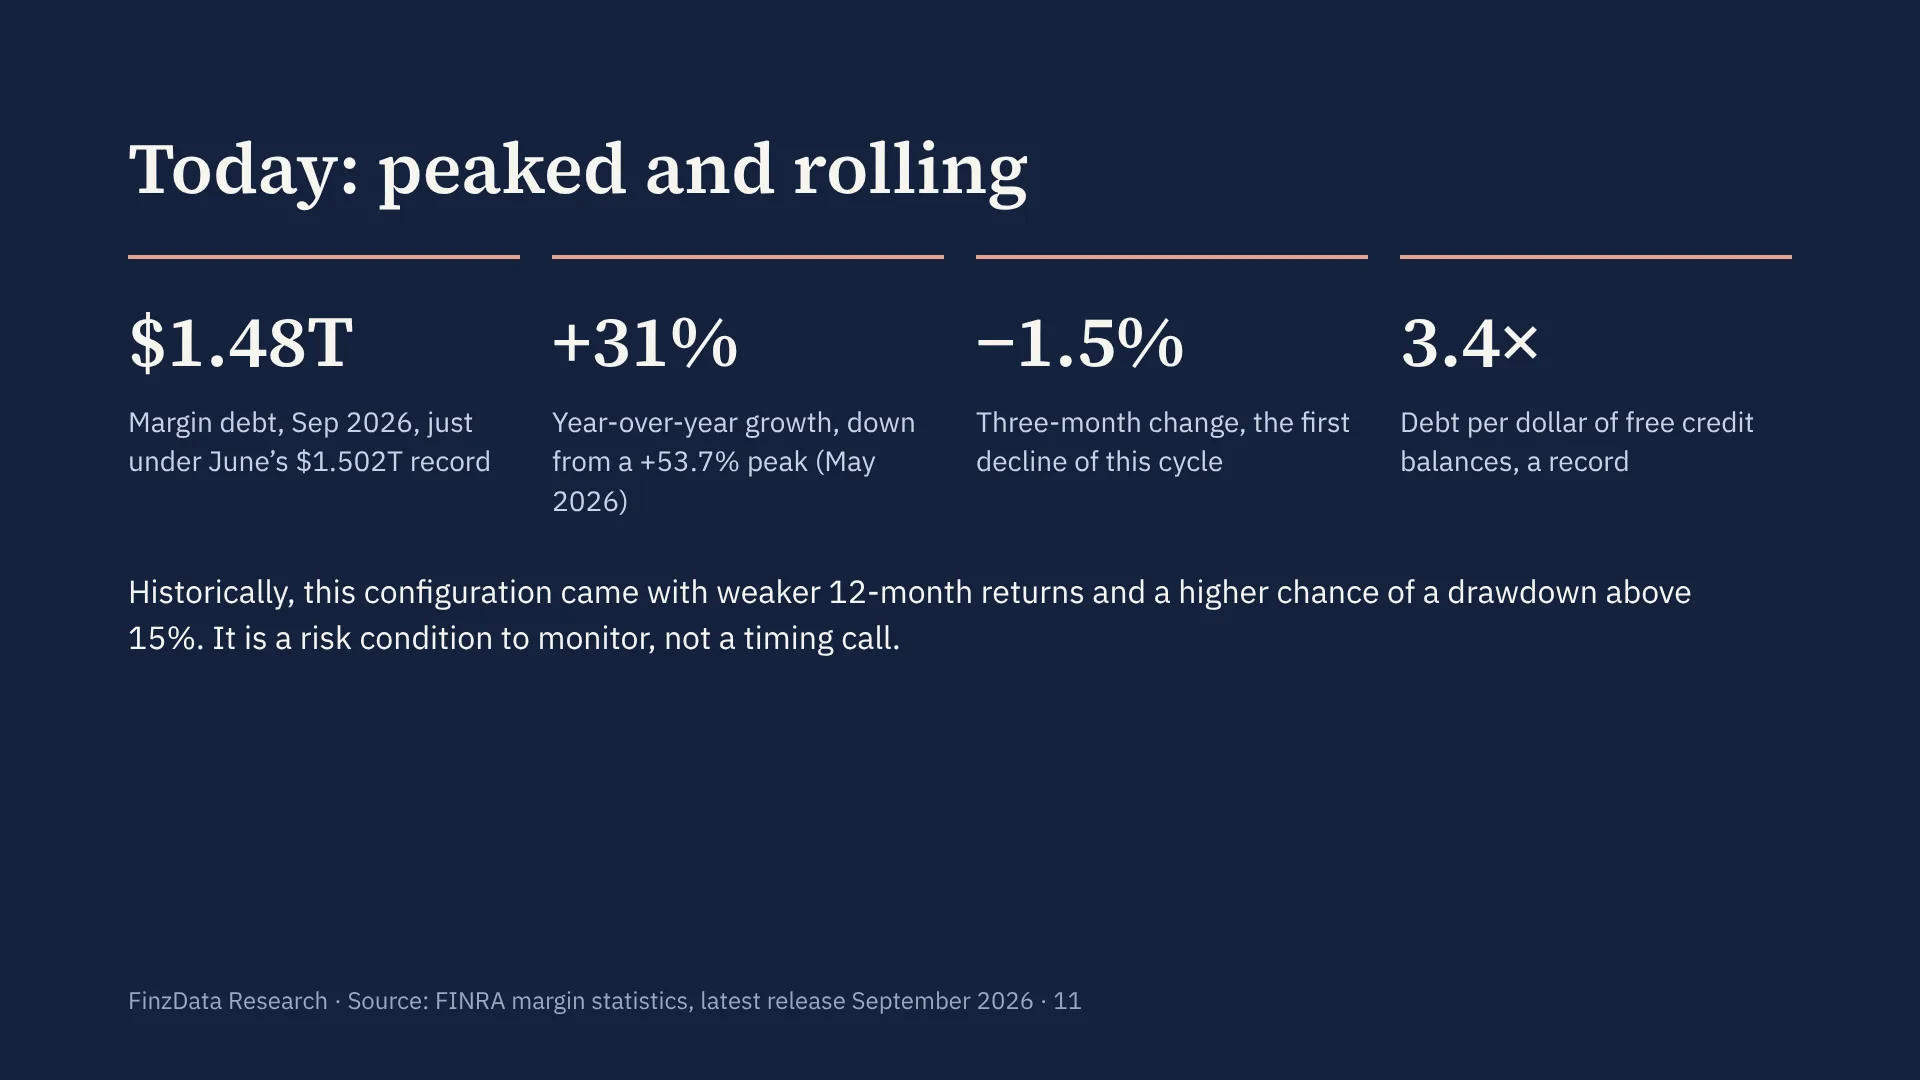
$1.48T, just under June’s record; growth +31%, down from +53.7%; the 3-month change negative for the first time this cycle. A risk condition to monitor, not a timing call.
As of September 2026, margin debt stands at $1.48 trillion. Year-over-year growth is +31.4%, down from a +53.7% YoY peak in the last 12 months. The record nominal level was $1.502 trillion in June 2026. The three-month change has turned negative at -1.5%.
This configuration matches the peaked & rolling regime described above: a prior surge in YoY growth above 30% followed by a meaningful deceleration. Historically, such rollovers have been associated with weaker forward returns and higher drawdown incidence, with average next-12m return -3.2% and 56% of cases experiencing a drawdown worse than -15%.
It is important to state the limitations plainly. The historical tendency is based on a small number of independent episodes. Monthly samples overlap, which inflates statistical significance. Margin debt is reported in nominal dollars and is not scaled by market capitalization or adjusted for inflation. The series is not a timing signal on its own and should not be used in isolation for decisions.
12. After margin debt peaks: when does the market top?
Event study
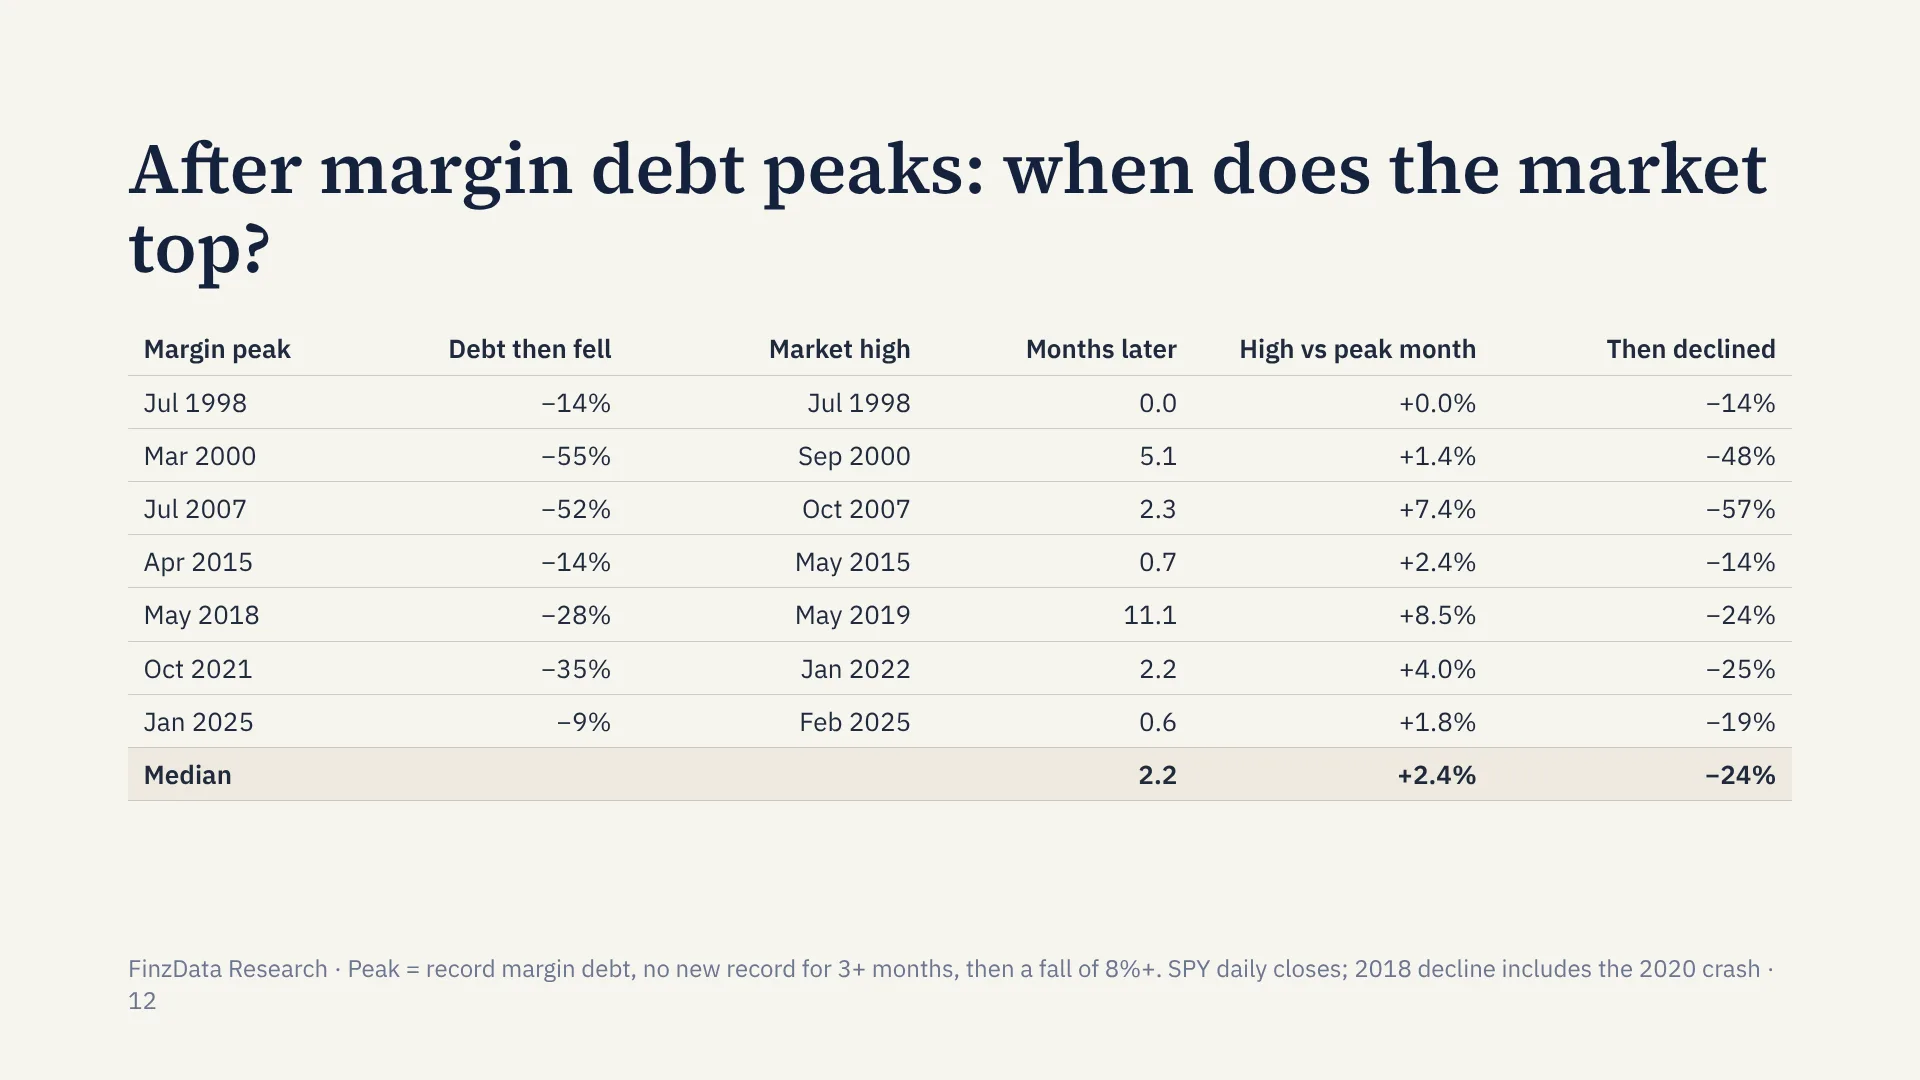
Across seven margin peaks since 1998, the market high came a median 2.2 months later (range 0–11), a median 2.4% above the peak-month level, followed by a median 24% decline.
To test what happens after a margin debt peak, we identified every record high that was followed by at least three months without a new record and a decline of at least 8%. Since 1998 that gives seven episodes. For each we measured when the S&P 500 (SPY) made its final high, how far above the peak-month level it got, and how far it fell afterwards.
The pattern is consistent on timing and loose on magnitude. The market high came 0 to 11 months after the margin peak (median 2.2 months) and never more than 8.5% above the peak-month level (median +2.4%). The decline that followed ranged from 14% to 57%, with a median of 24%. In 2018 the measured decline includes the 2020 crash, which came after the market recovered.
13. Two kinds of margin peak
Terminal vs mid-cycle
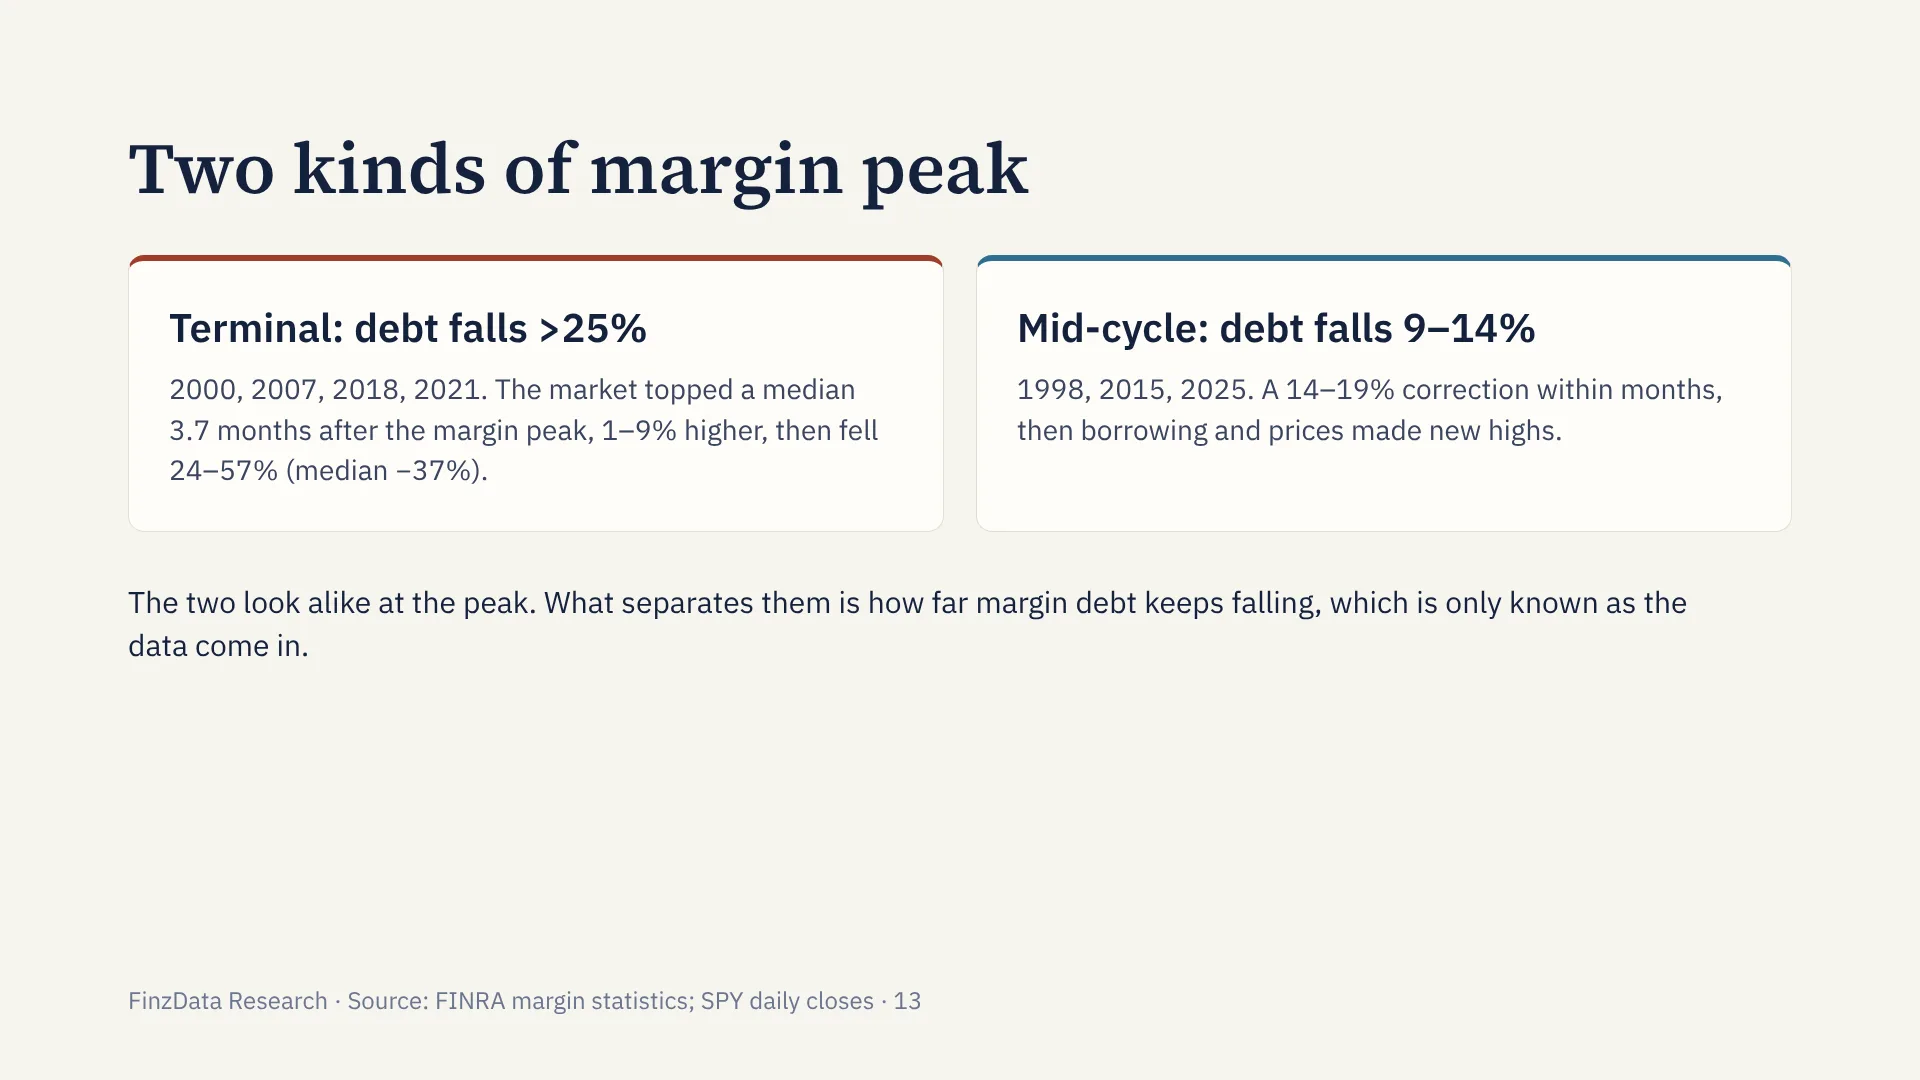
When margin debt went on to fall more than 25%, the market fell 24–57%. When it fell 9–14%, the market corrected 14–19% and recovered. The difference is only visible as the data arrive.
The seven episodes split into two groups. In four of them (2000, 2007, 2018 and 2021) margin debt went on to fall more than 25% from its peak. The market topped a median 3.7 months after the margin peak, 1–9% higher, and then fell 24–57%, with a median decline of 37%.
In the other three (1998, 2015 and 2025) margin debt fell only 9–14%. The market corrected 14–19% within months and then, as borrowing resumed, made new highs. At the moment of the peak the two groups look the same. The difference becomes visible only as successive monthly FINRA releases show how far deleveraging goes.
14. Mapping history onto the S&P 500 today
Scenarios
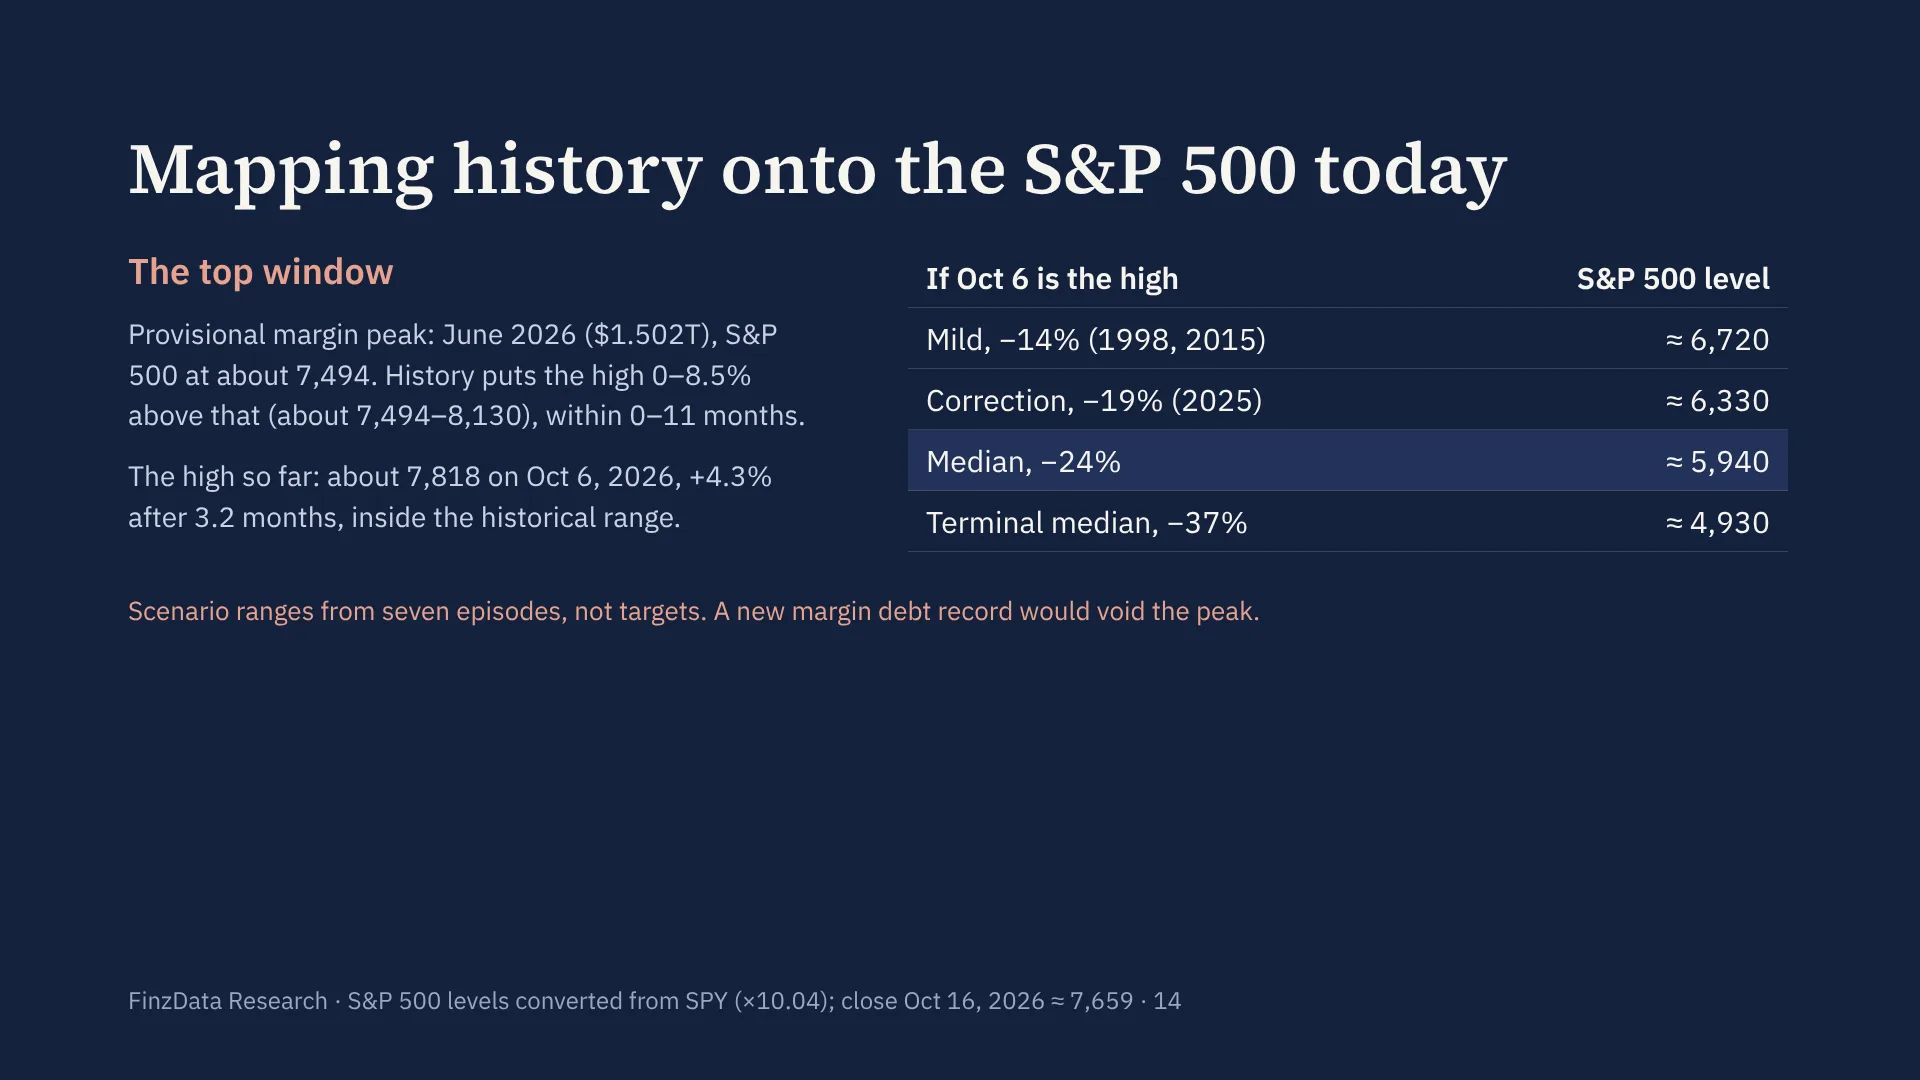
History puts the top window at about 7,494–8,130; the high so far is about 7,818 (Oct 6). Scenario levels: ≈6,720 (−14%), ≈6,330 (−19%), ≈5,940 (median −24%), ≈4,930 (terminal median).
Applying the historical ranges to the S&P 500 (converted from SPY): the provisional margin peak is June 2026, when the index closed the month near 7,494. History puts the market high 0–8.5% above that level, about 7,494–8,130, within 0–11 months. The high so far is about 7,818 on 6 October 2026, 4.3% above the June level after 3.2 months, inside the historical range.
If 6 October proves to be the high, the historical declines translate to about 6,720 (−14%, the mild cases), 6,330 (−19%, as in 2025), 5,940 (the −24% median) and 4,930 (the −37% median of the terminal episodes). These are scenario ranges from seven episodes, not forecasts. A new margin debt record would void the peak.
15. What would confirm the peak
Watch list
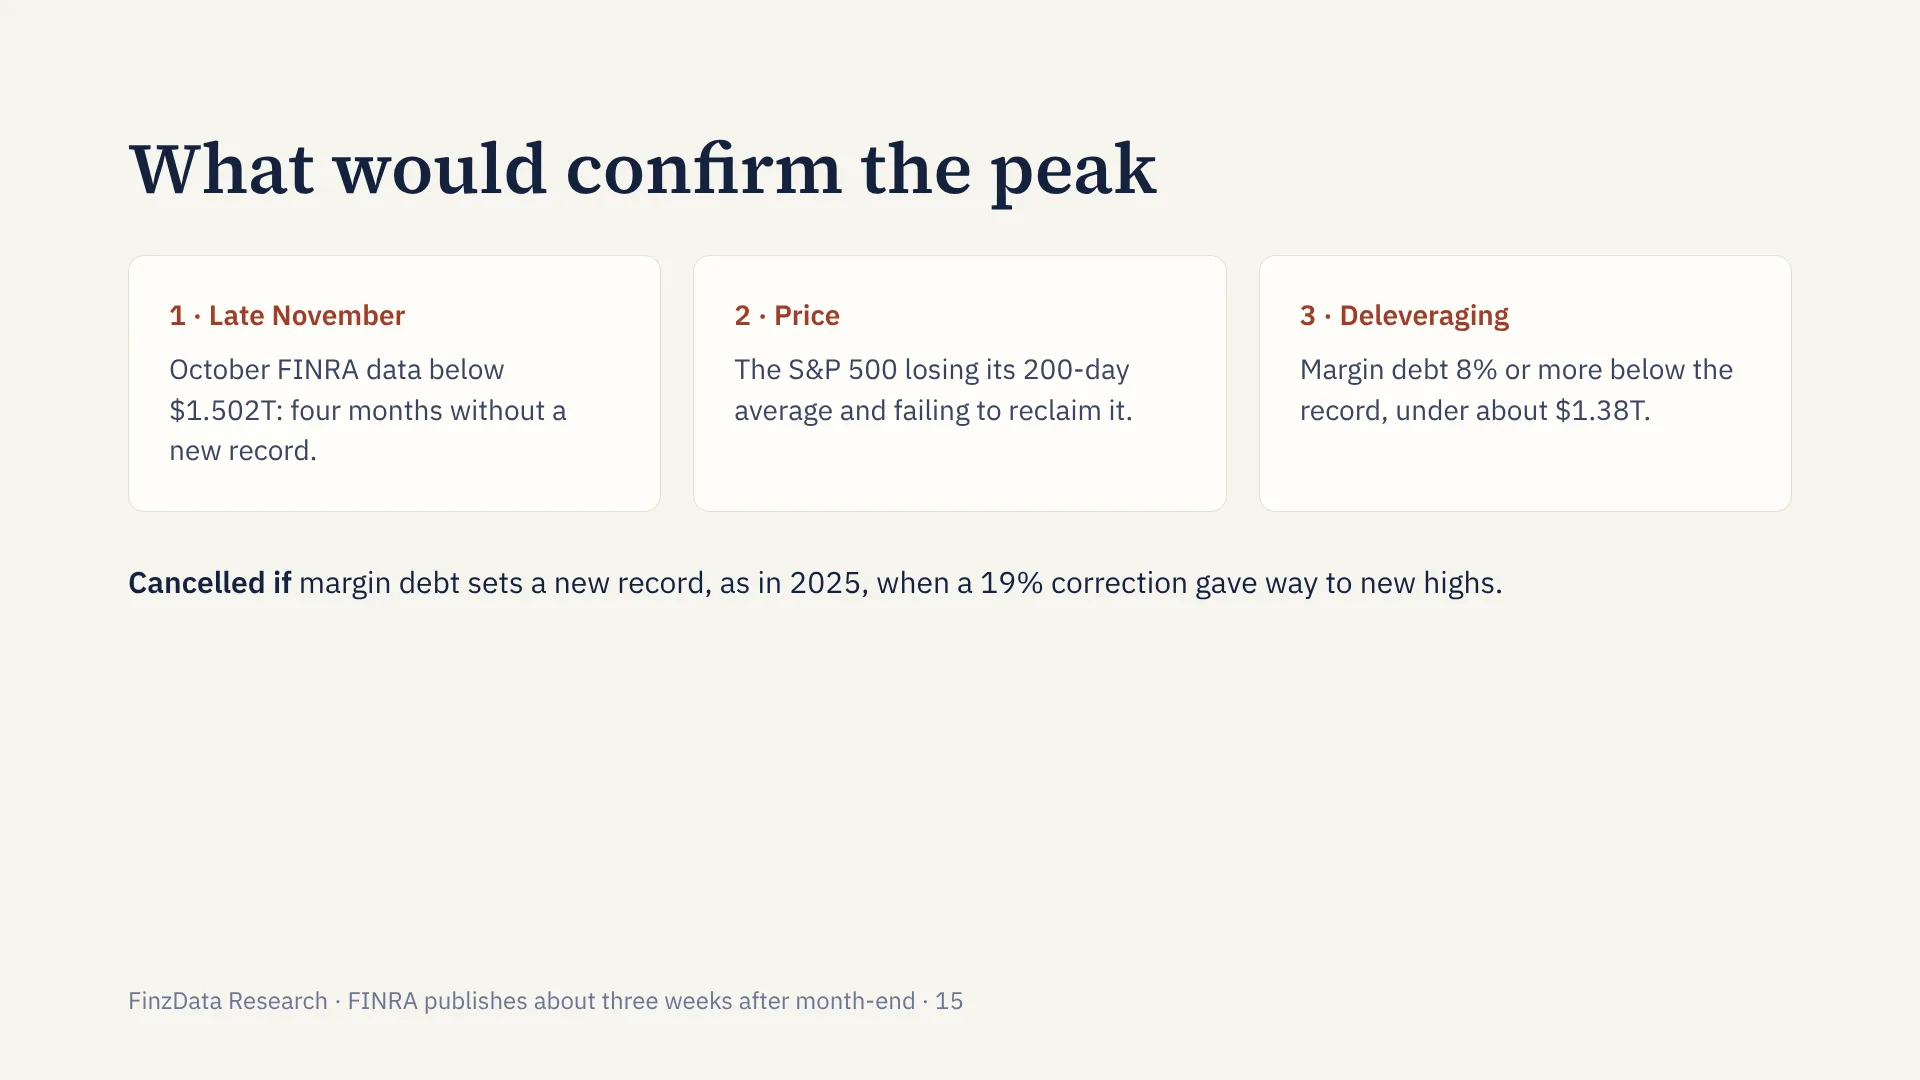
October FINRA data below the June record, the S&P 500 losing its 200-day average, and margin debt 8%+ below the record (under about $1.38T). A new record would void the signal.
Three observations would confirm the peak. First, the October FINRA release, due in late November, coming in below the June record of $1.502 trillion: four months without a new record. Second, the S&P 500 losing its 200-day moving average and failing to recover it. Third, margin debt falling 8% or more from the record, below about $1.38 trillion, the threshold used to define the peaks in this study.
The signal is cancelled if margin debt sets a new record. That is what happened in 2025: the January peak was followed by a 19% correction, then borrowing and prices both made new highs.
16. The cycle cross-check
Cycle context
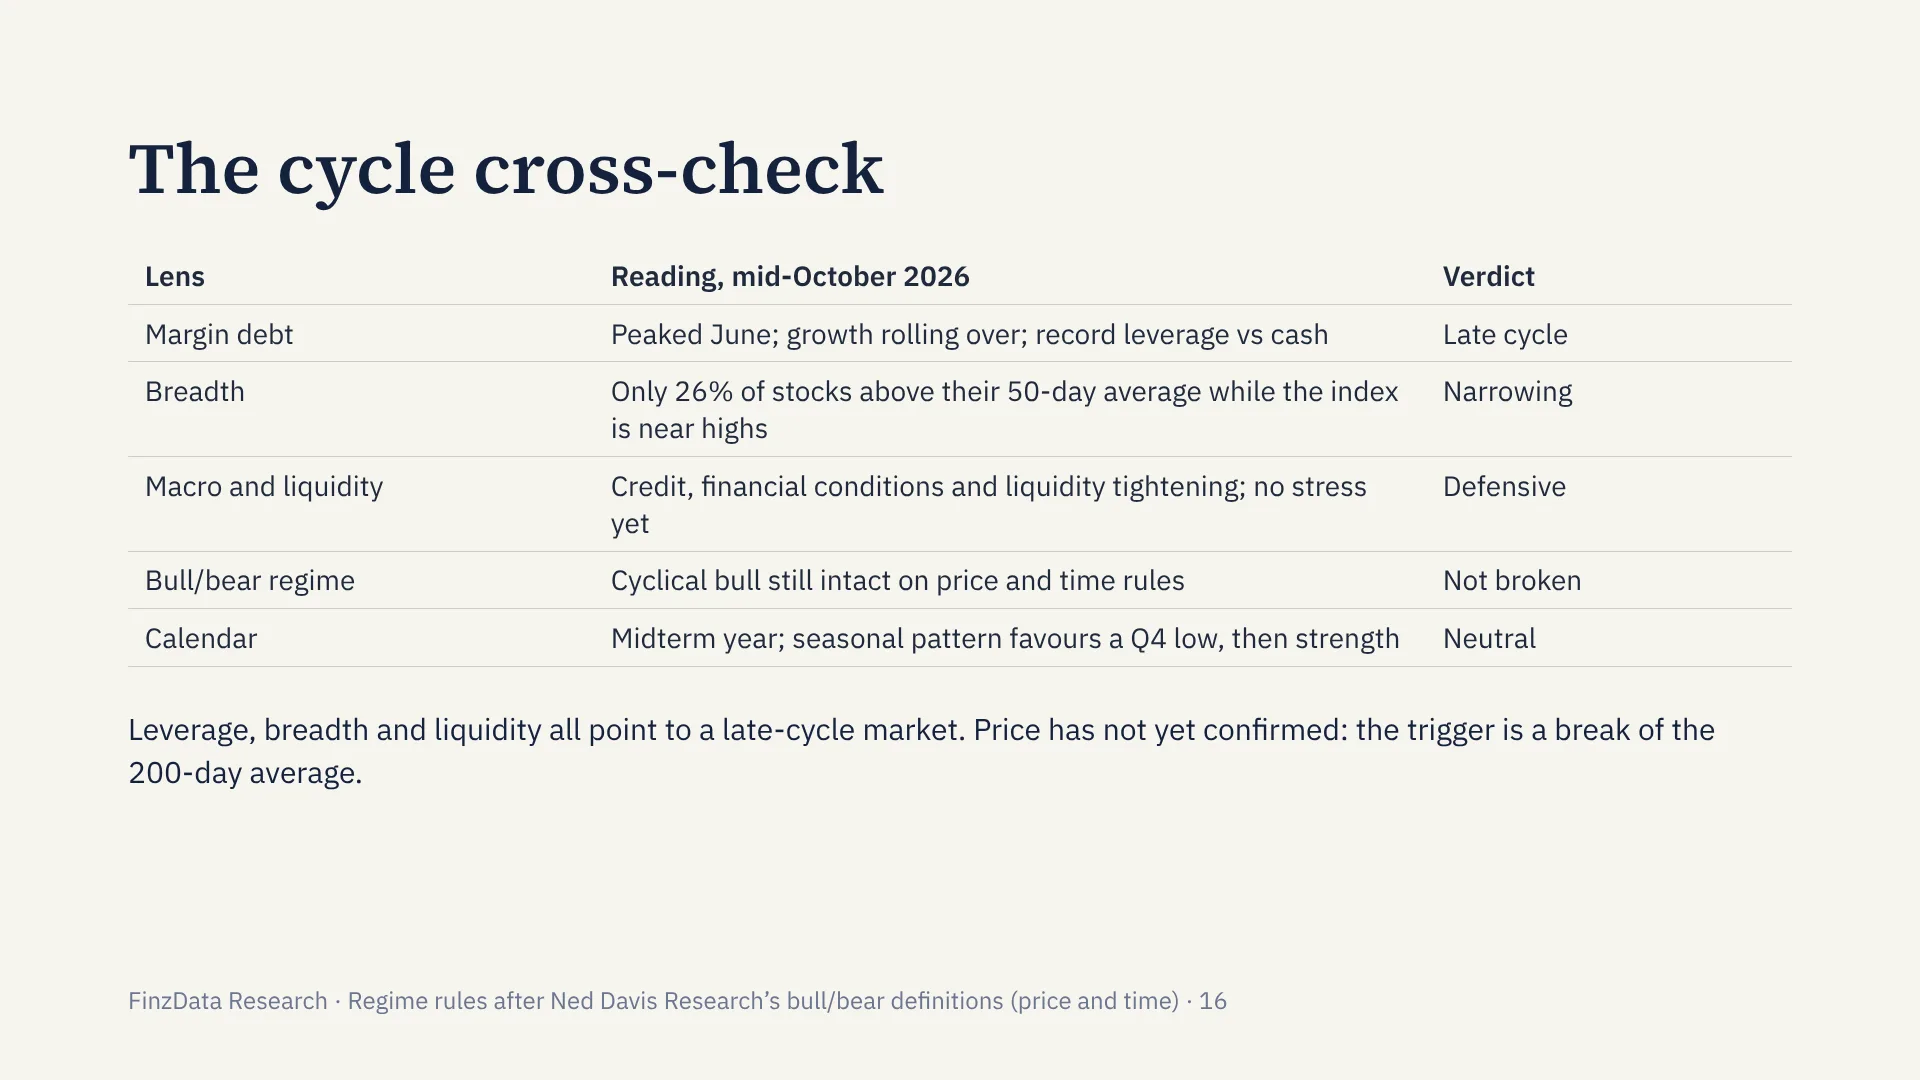
Leverage, breadth and liquidity point to a late-cycle market; the bull/bear regime is not broken and the calendar is neutral. Price has not yet confirmed.
Margin debt is one lens. We cross-check it against breadth, macro and liquidity conditions, a bull/bear regime model and the calendar. In mid-October 2026, leverage, breadth and liquidity point the same way: margin debt has peaked and its growth is rolling over, only about a quarter of stocks trade above their 50-day averages while the index sits near highs, and credit, financial conditions and liquidity are tightening without signs of stress.
The bull/bear regime, defined on price and time following Ned Davis Research’s rules, has not broken, and the midterm-year calendar is neutral. The combination describes a late-cycle market whose price trend has not yet confirmed the leverage warning. A break of the 200-day average would be that confirmation.
17. Methodology and limitations
Methods
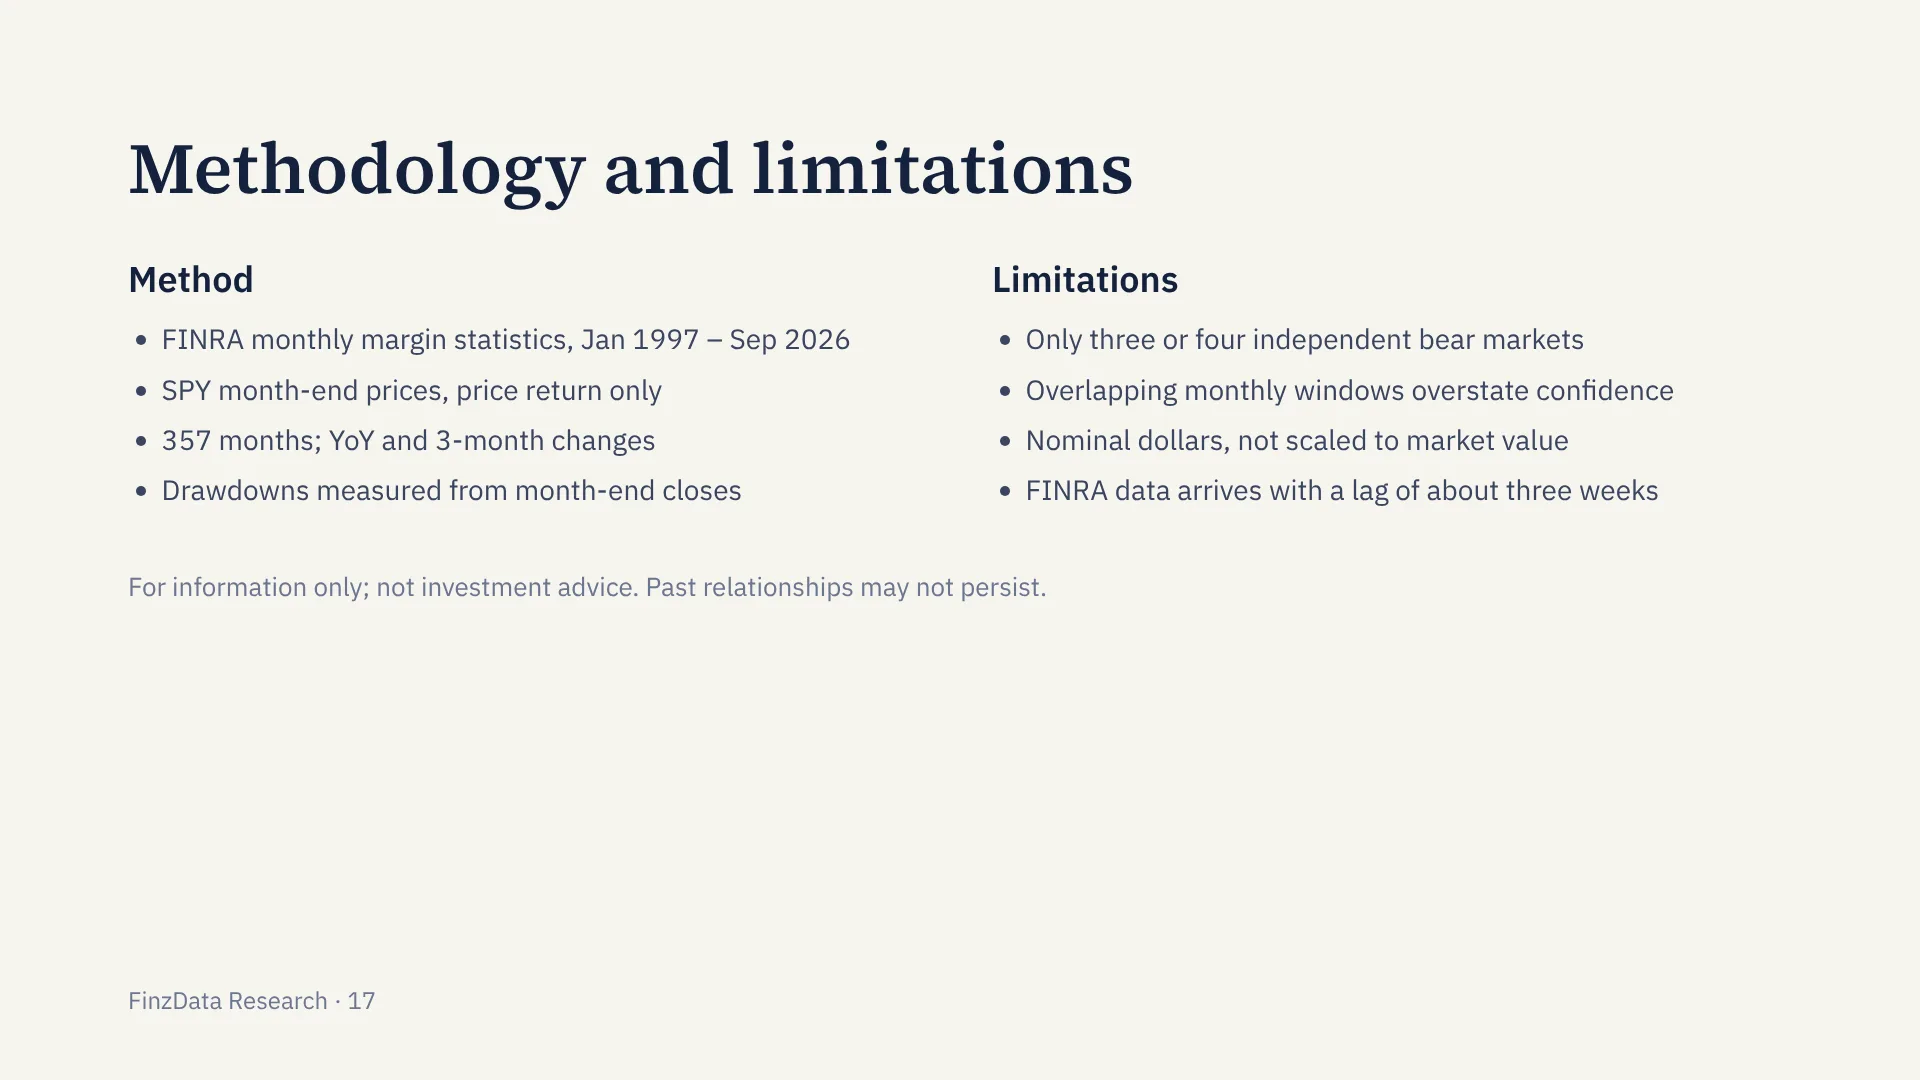
FINRA monthly statistics and SPY month-end prices (price return), 357 months. Three or four independent bear markets, overlapping windows and nominal dollars limit confidence.
This study uses monthly FINRA margin statistics from January 1997 through September 2026, paired with SPY month-end prices for price return calculations. The sample covers 357 months. All correlations and regime statistics are computed on year-over-year changes in margin debt versus SPY year-over-year returns, unless otherwise noted.
The analysis focuses on margin debt leading indicator properties, lead-lag relationships, and regime-dependent forward outcomes. The data are nominal and not scaled by market capitalization or inflation. The period includes multiple bull and bear cycles, including the dot-com peak, the global financial crisis, the COVID shock, and the 2022 drawdown.
- Monthly FINRA margin statistics from January 1997 to September 2026, paired with SPY month-end price returns. Sample size 357 months.
- Correlations are sample statistics and do not imply causation.
- Margin debt is nominal and not adjusted for market cap, inflation, or changes in reporting coverage.
- Regime definitions are ex-post and may be subject to look-ahead bias in practice.
- Overlapping monthly observations increase serial correlation and can overstate precision.
- Results are specific to U.S. equities and FINRA margin statistics. They do not generalize to other markets or leverage measures.
Disclaimer: This is research for informational purposes only and does not constitute investment advice.
18. Track it yourself
Built on FinzData
The full FINRA margin debt history with leverage signals via API, JSON or CSV. The last 12 months are free.
Frequently asked questions
What is margin debt?
Margin debt is money investors borrow from brokers against their securities. FINRA publishes it monthly as debit balances in customers’ securities margin accounts.
Is margin debt a leading indicator?
Mostly it is coincident: year-over-year margin growth tracks S&P 500 growth with a 0.81 correlation. What has led is the rollover: after growth peaks above 30% and falls back, the next 12 months averaged −3.2% versus +8.9% for all months since 1997.
How long after margin debt peaks does the stock market top?
Across seven margin debt peaks since 1998, the S&P 500 high came a median 2.2 months later (range 0–11 months), a median 2.4% above the peak-month level.
What is margin debt today?
FINRA margin debt was $1.48 trillion in September 2026, just below the record $1.502 trillion set in June 2026; year-over-year growth was +31%, down from +53.7%.
Where can I get FINRA margin debt data?
FinzData serves the full FINRA margin debt history since 1997 with leverage signals via API at finzdata.com/margin-debt; the last 12 months are free.
Download the deck (PDF, 18 slides) Get the margin debt data · More research
curl "https://api.finzdata.com/v1/margin/history?start=1997-01&format=csv" -H "X-API-Key: YOUR_KEY"
curl "https://api.finzdata.com/v1/margin/latest" -H "X-API-Key: YOUR_KEY"   # latest month + record/peak flags
Margin debt history + signals Get a free API key · All datasets
Built for AI, quants, data scientists and financial analysts who backtest. Clean data. Real insights. Real alpha. finzdata.com. This material is for information only and is not investment advice. Past relationships may not persist. Data sources: FINRA margin statistics (debit balances in customers’ securities margin accounts; free credit balances in cash and margin accounts), FinzData daily ETF prices (SPY). S&P 500 levels converted from SPY.
Get FinzData research free, every morning
The daily brief: what moved, the macro releases that matter, positioning and liquidity, with charts. One email a day, free, unsubscribe anytime.
Topics and related searches
Liquidity, leverage and margin debt Credit markets and debt Equity strategy and factors Recession risk and the business cycle
People also search
- will margin debt predict stock market crash
- is margin debt a leading indicator
- what is margin debt
- how high is margin debt now
- when does market top after margin debt peak
- why does margin debt rollover matter
- does margin debt lead s and p 500
- are margin debt levels at record highs
- what is the margin debt to cash ratio
- how long after margin peak does market peak
- which bear markets were preceded by margin debt peak
- should investors worry about margin debt rollover