
FinzData Research · Published 18 October 2026
The Yield Curve, the Debt Market and CoreWeave
Short rates are pricing another hike, long yields just fell, and the AI borrowing boom met its first real credit test. A 17-slide deck built on nine FinzData datasets: macro vintages, CFTC positioning, liquidity, foreign flows, prices, point-in-time fundamentals, insider trades, 13F holdings and short interest.
Get FinzData research free, every morning
The daily brief: what moved, the macro releases that matter, positioning and liquidity, with charts. One email a day, free, unsubscribe anytime.
Contents
- Nine FinzData datasets, one story
- Four numbers that matter this week
- Short rates up, curve flatter
- Curve spreads are flattening again
- The front end is pricing a hike
- Long yields are real, not inflation
- Funds are deep short Treasuries
- Liquidity is ample and stress is low
- Foreigners kept buying Treasuries
- Junk lagged, Treasuries rallied
- AI infrastructure stocks broke
- CoreWeave's books, as filed
- Who sold CoreWeave, who bought
- The credit market's verdict
- One story: rates, issuance, quality
- Data and method
- Frequently asked questions
1. The Yield Curve, the Debt Market and CoreWeave
Data through October 16, 2026.
A short-rate market pricing another Fed hike, a long end that rallied as risk appetite cracked, and the first real credit test of the AI infrastructure borrowing boom. Every chart in this deck is built from the FinzData database: point-in-time macro vintages, CFTC positioning, Fed liquidity and foreign flows, survivorship-free prices, and CoreWeave's own filings, insider trades, 13F owners and short interest.
2. Nine FinzData datasets, one story
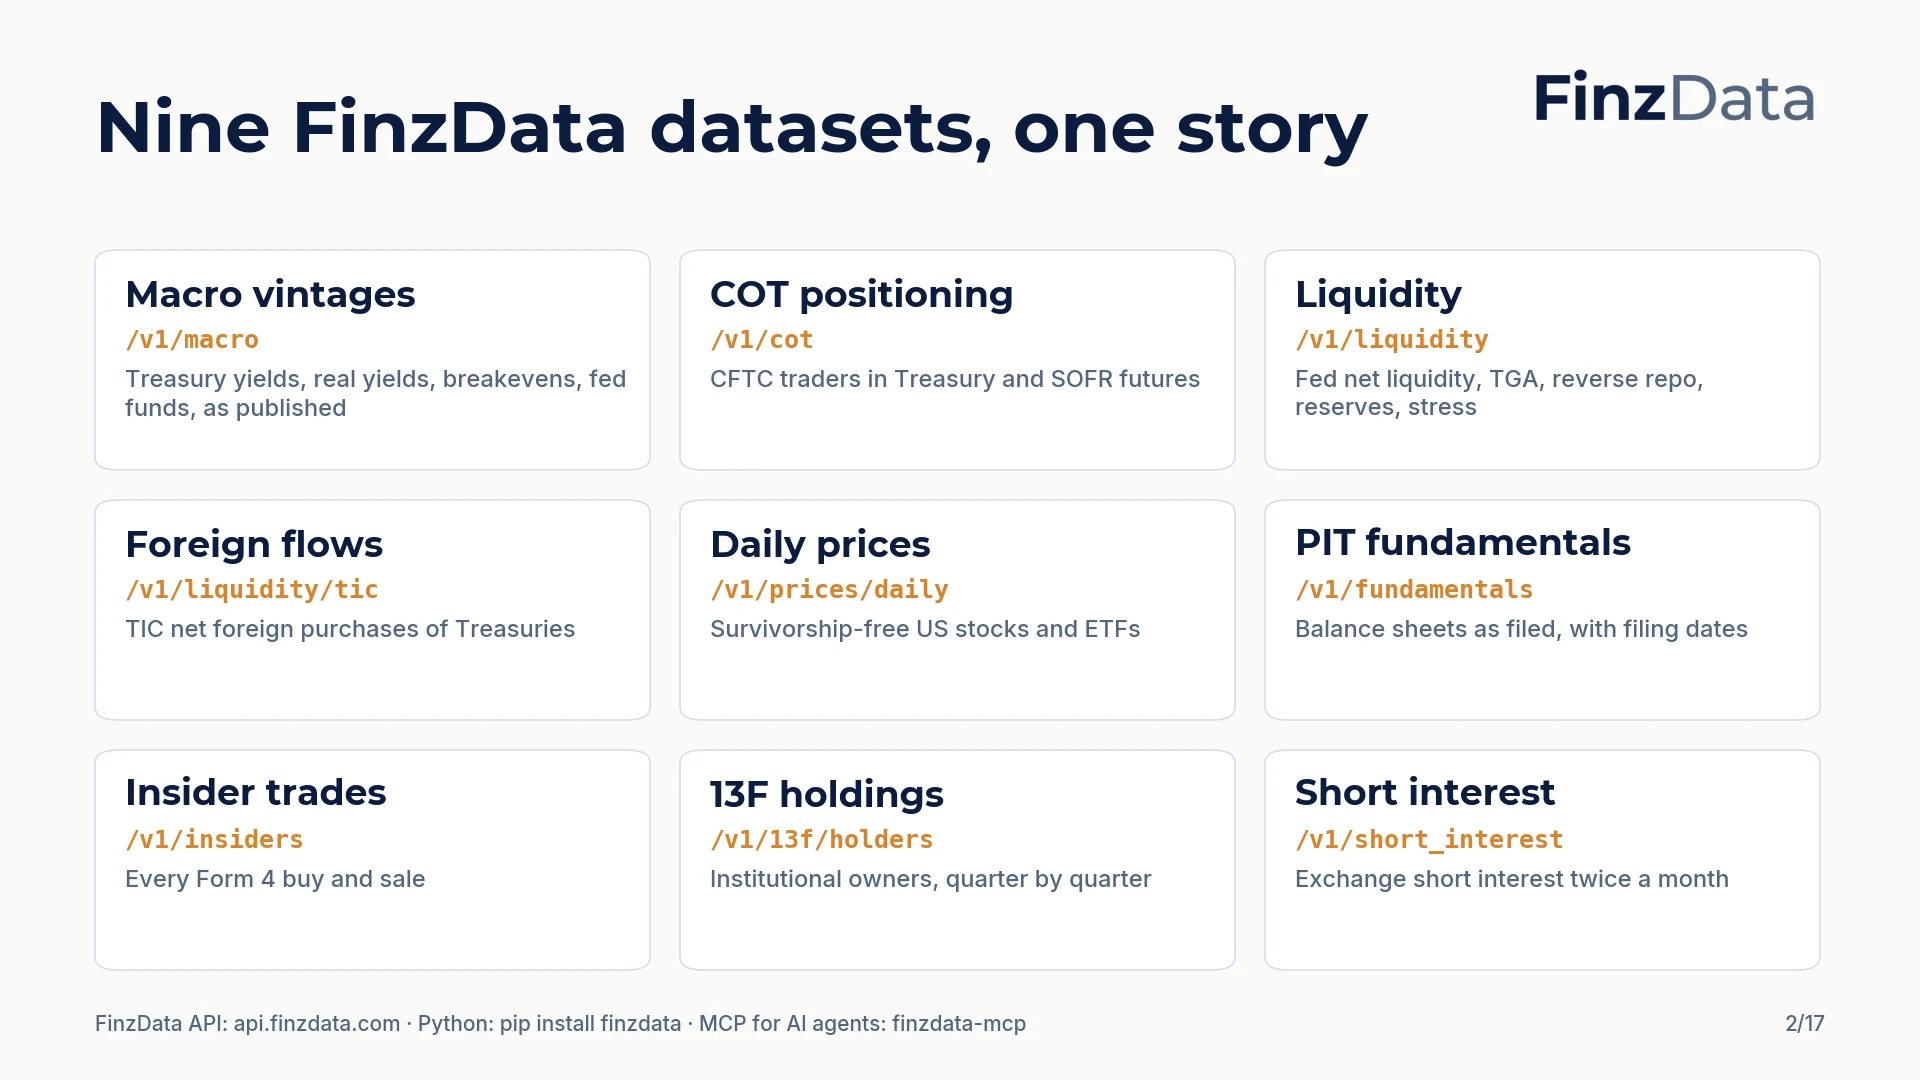
Every chart and number in this deck comes from the FinzData database, through the same API, Python client and MCP server our customers use.
Nine FinzData datasets feed this deck, each available through the same REST API, Python client (pip install finzdata) and MCP server for AI agents that our customers use. The endpoint for each dataset is printed on every slide, so any number here can be pulled and checked in seconds.
3. Four numbers that matter this week
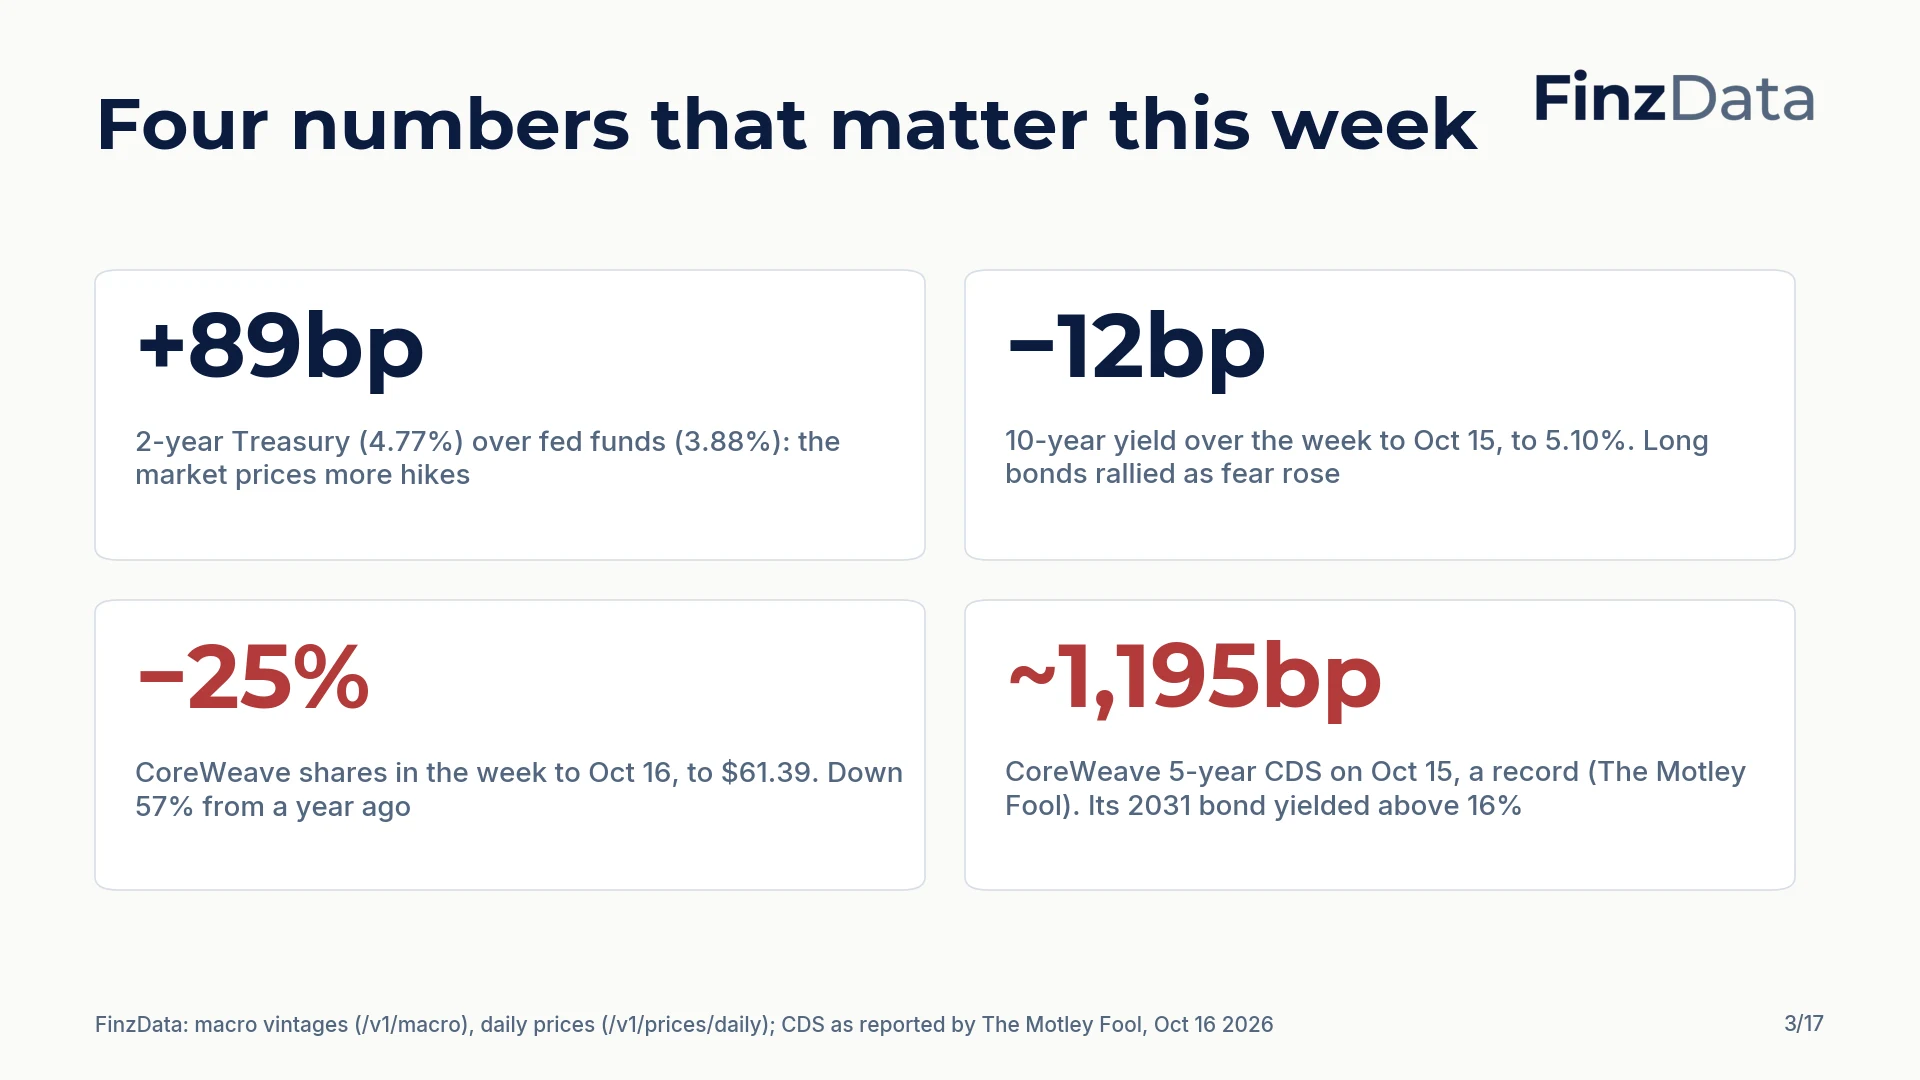
Front-end yields price tightening while the long end rallies; CoreWeave's equity and credit are both in distress territory.
The 2-year Treasury at 4.77% sits 89bp above the 3.88% effective fed funds rate: the market is pricing tighter policy. The 10-year fell 12bp in a week to 5.10%. CoreWeave shares fell 25% in the week to $61.39, and its five-year CDS reached a record near 1,195bp on October 15, according to The Motley Fool.
4. Short rates up, curve flatter
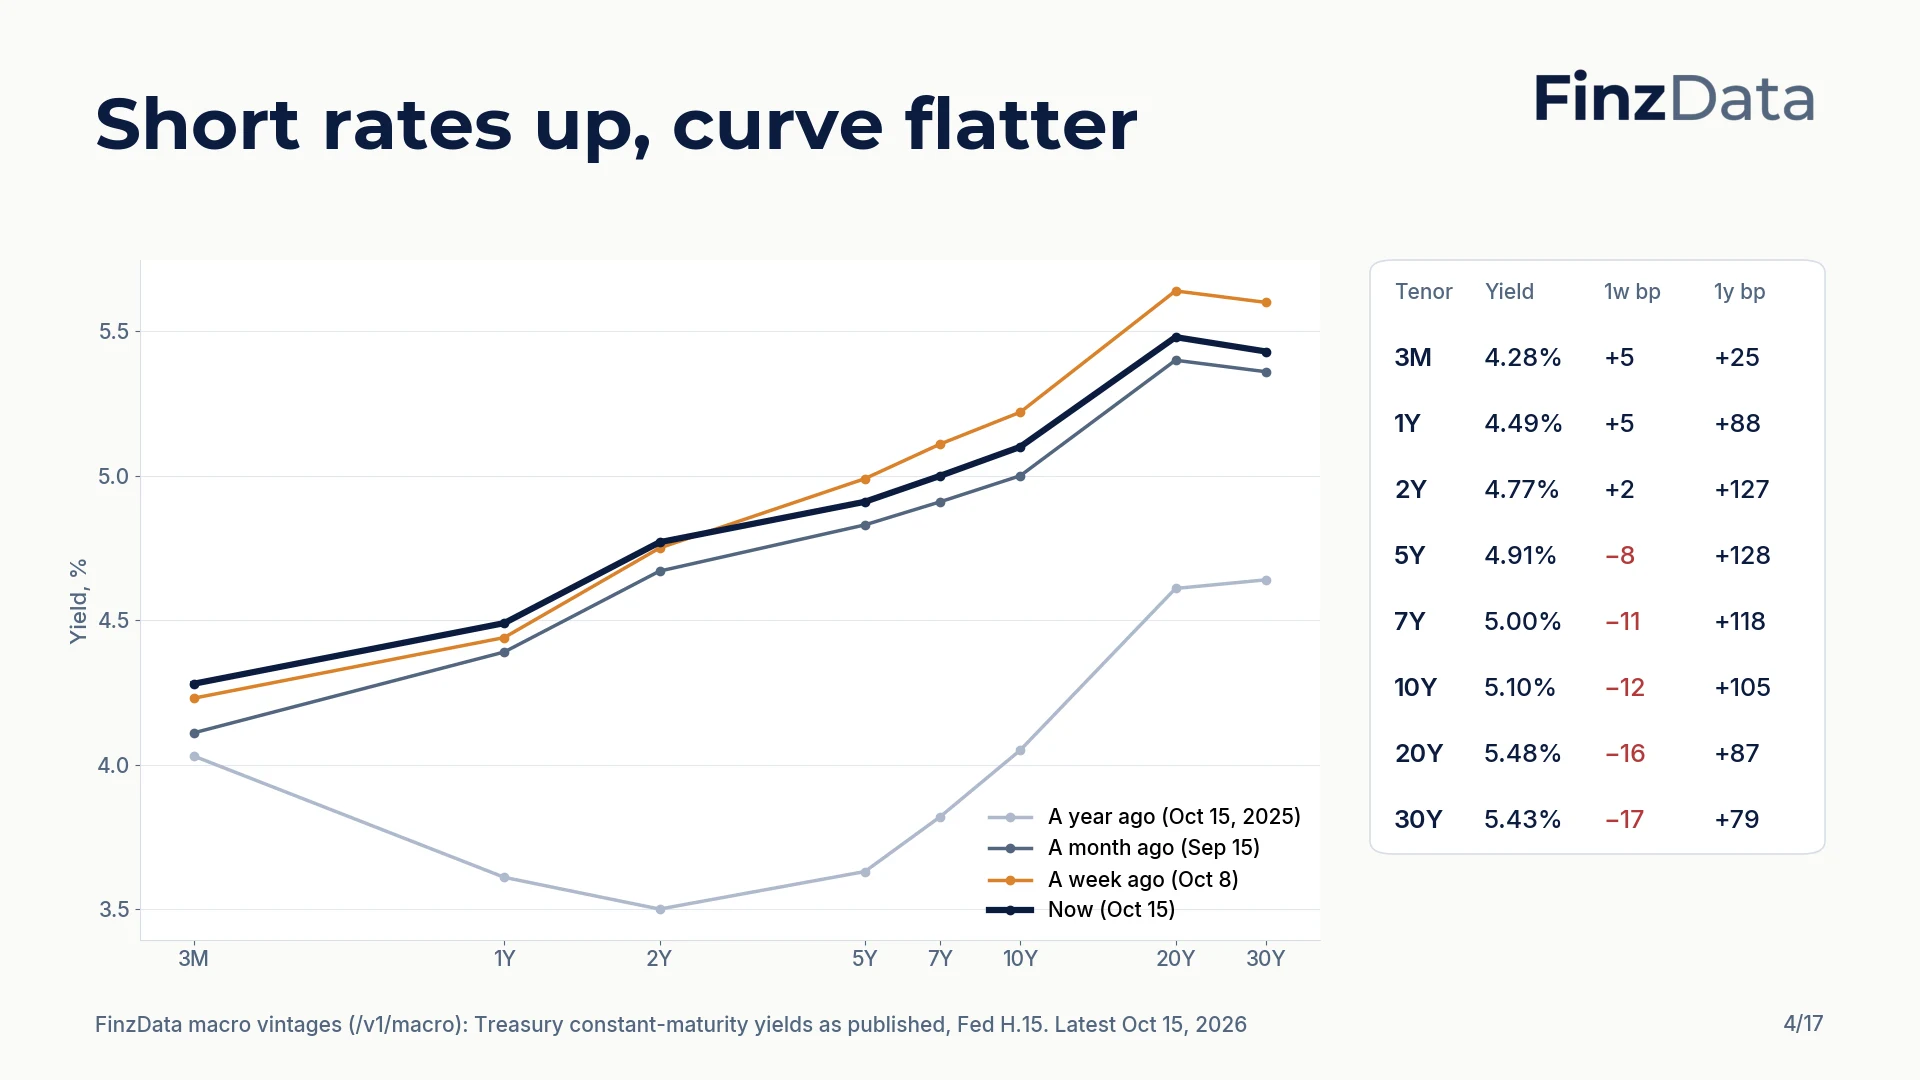
Over a year the 2-year rose 127bp while the 30-year rose 79bp. In the last week the long end fell 12-17bp while bills and the 2-year rose: a flattening led by the long end.
From FinzData macro vintages: over twelve months the 2-year is up 127bp and the 5-year 128bp, while the 30-year is up 79bp. In the latest week bills and the 2-year rose while the 10-year fell 12bp and the 20- and 30-year fell 16-17bp, a flattening led by a falling long end.
5. Curve spreads are flattening again
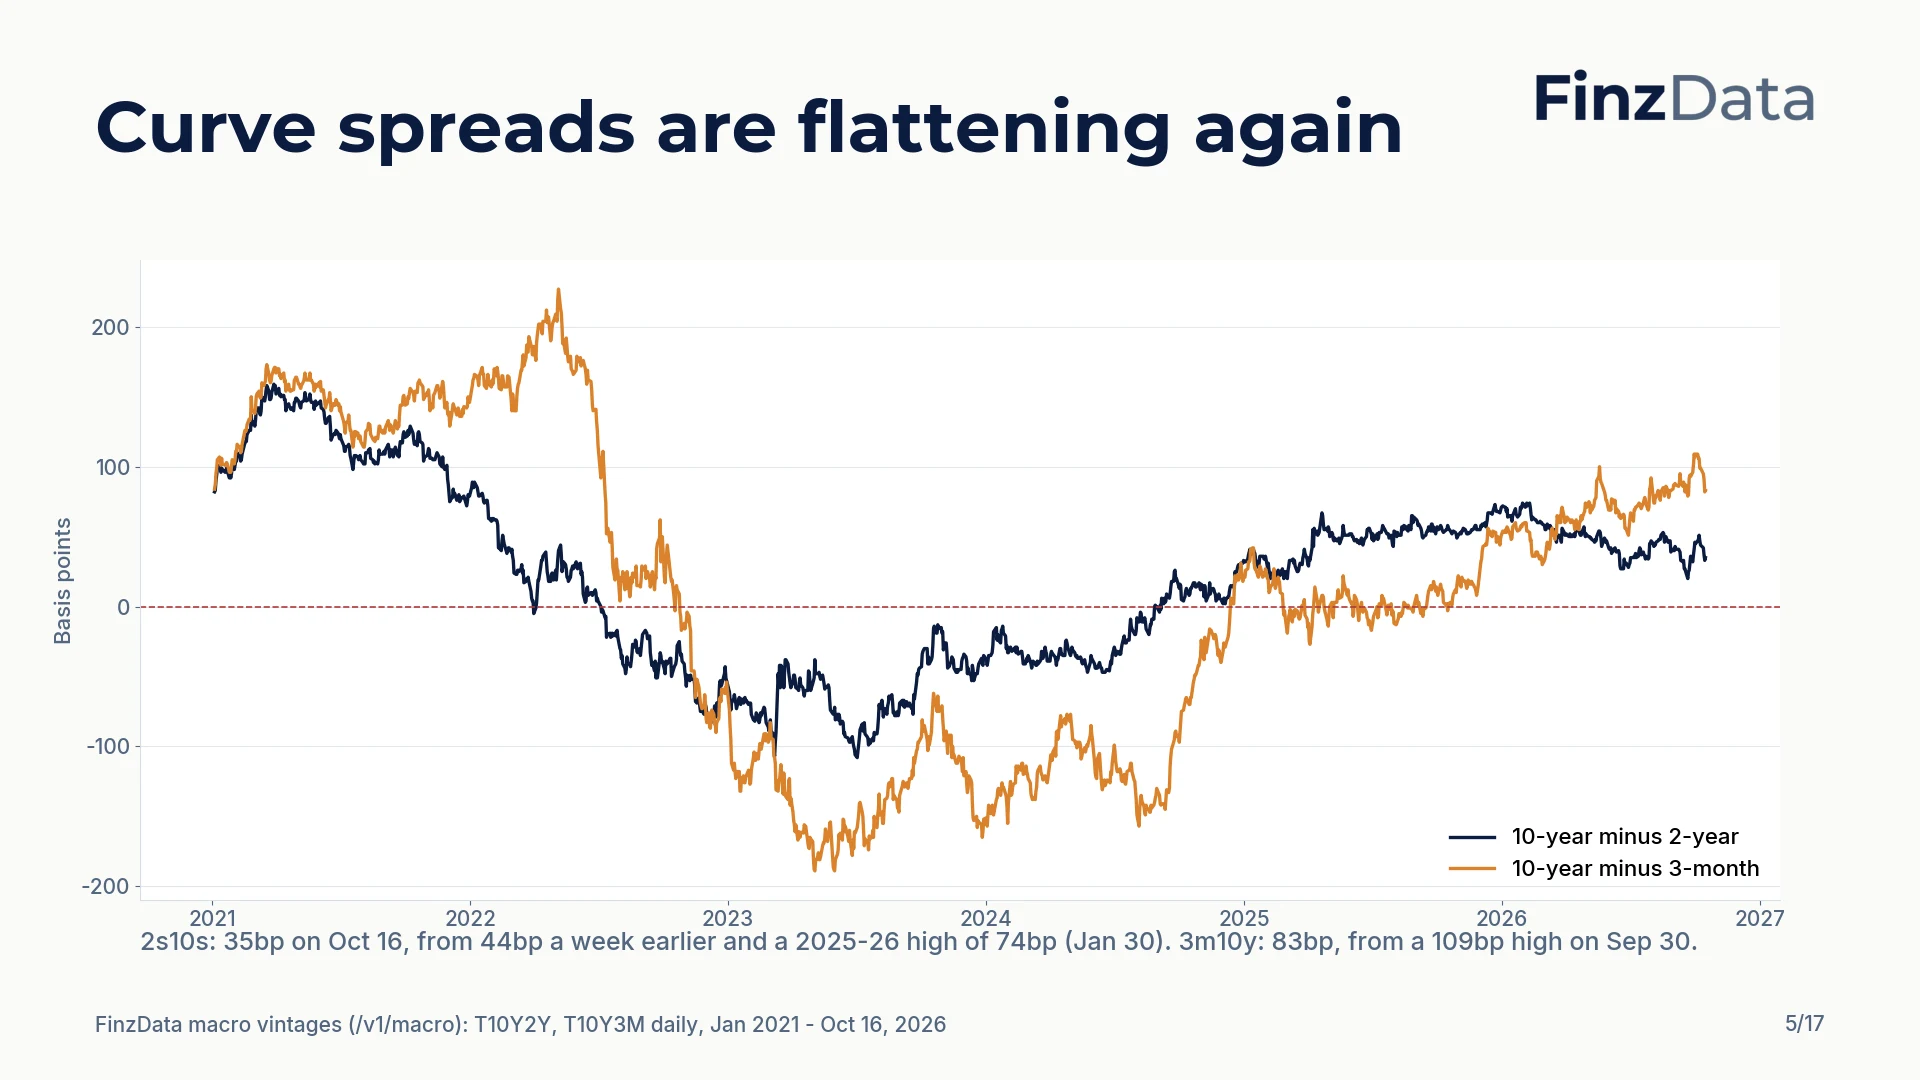
Both spreads un-inverted in 2024-25. They are still positive, but the 2s10s has given back half of its January peak and the 3m10y fell 16bp in a week.
The 10-year minus 2-year spread has narrowed from 74bp on January 30 to 35bp; the 10-year minus 3-month fell 16bp in a week to 83bp. Both are still positive. A flattening curve with hikes priced at the front is the pattern to watch, not yet a recession signal.
6. The front end is pricing a hike
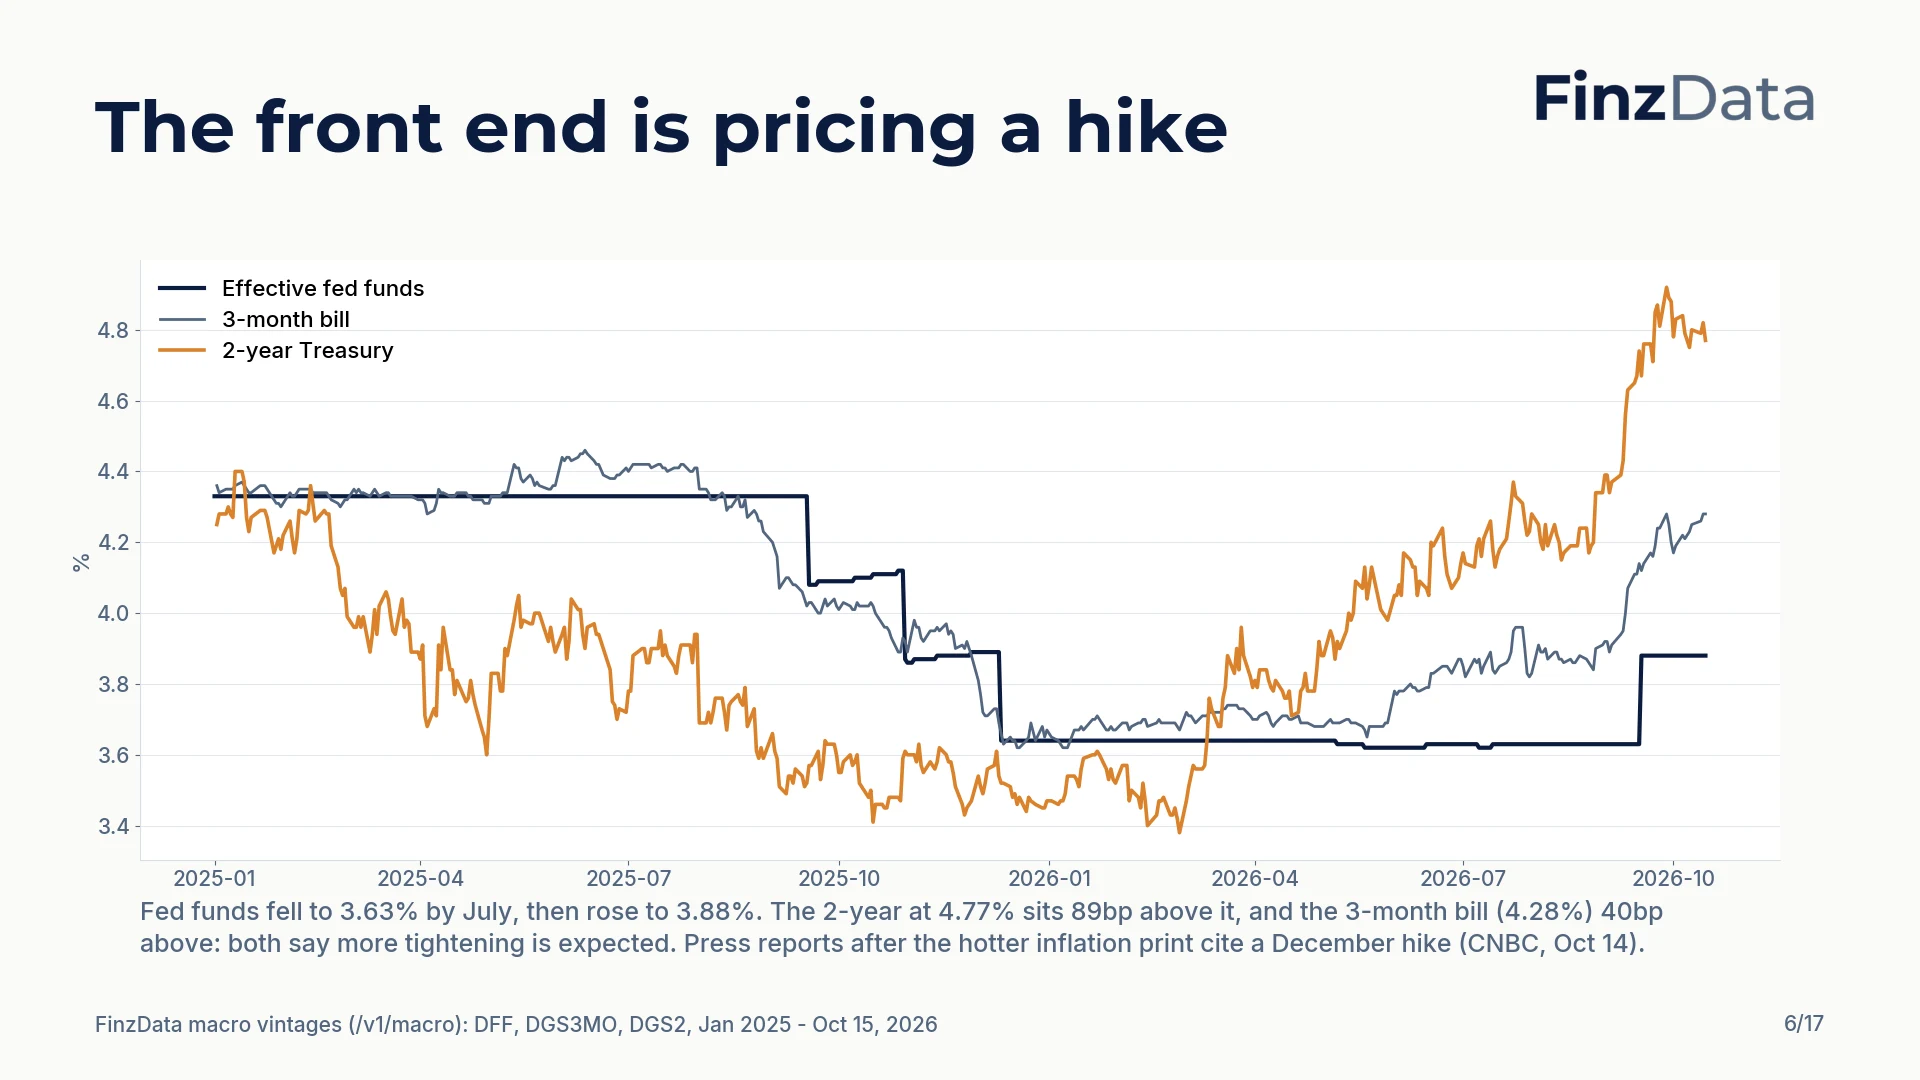
When the 2-year trades this far above the policy rate, the market is pricing hikes, not cuts.
Effective fed funds fell to 3.63% by July and has risen to 3.88%. The 3-month bill (4.28%) and the 2-year (4.77%) both trade well above it. For leveraged borrowers this gap sets the cost of the next loan.
7. Long yields are real, not inflation
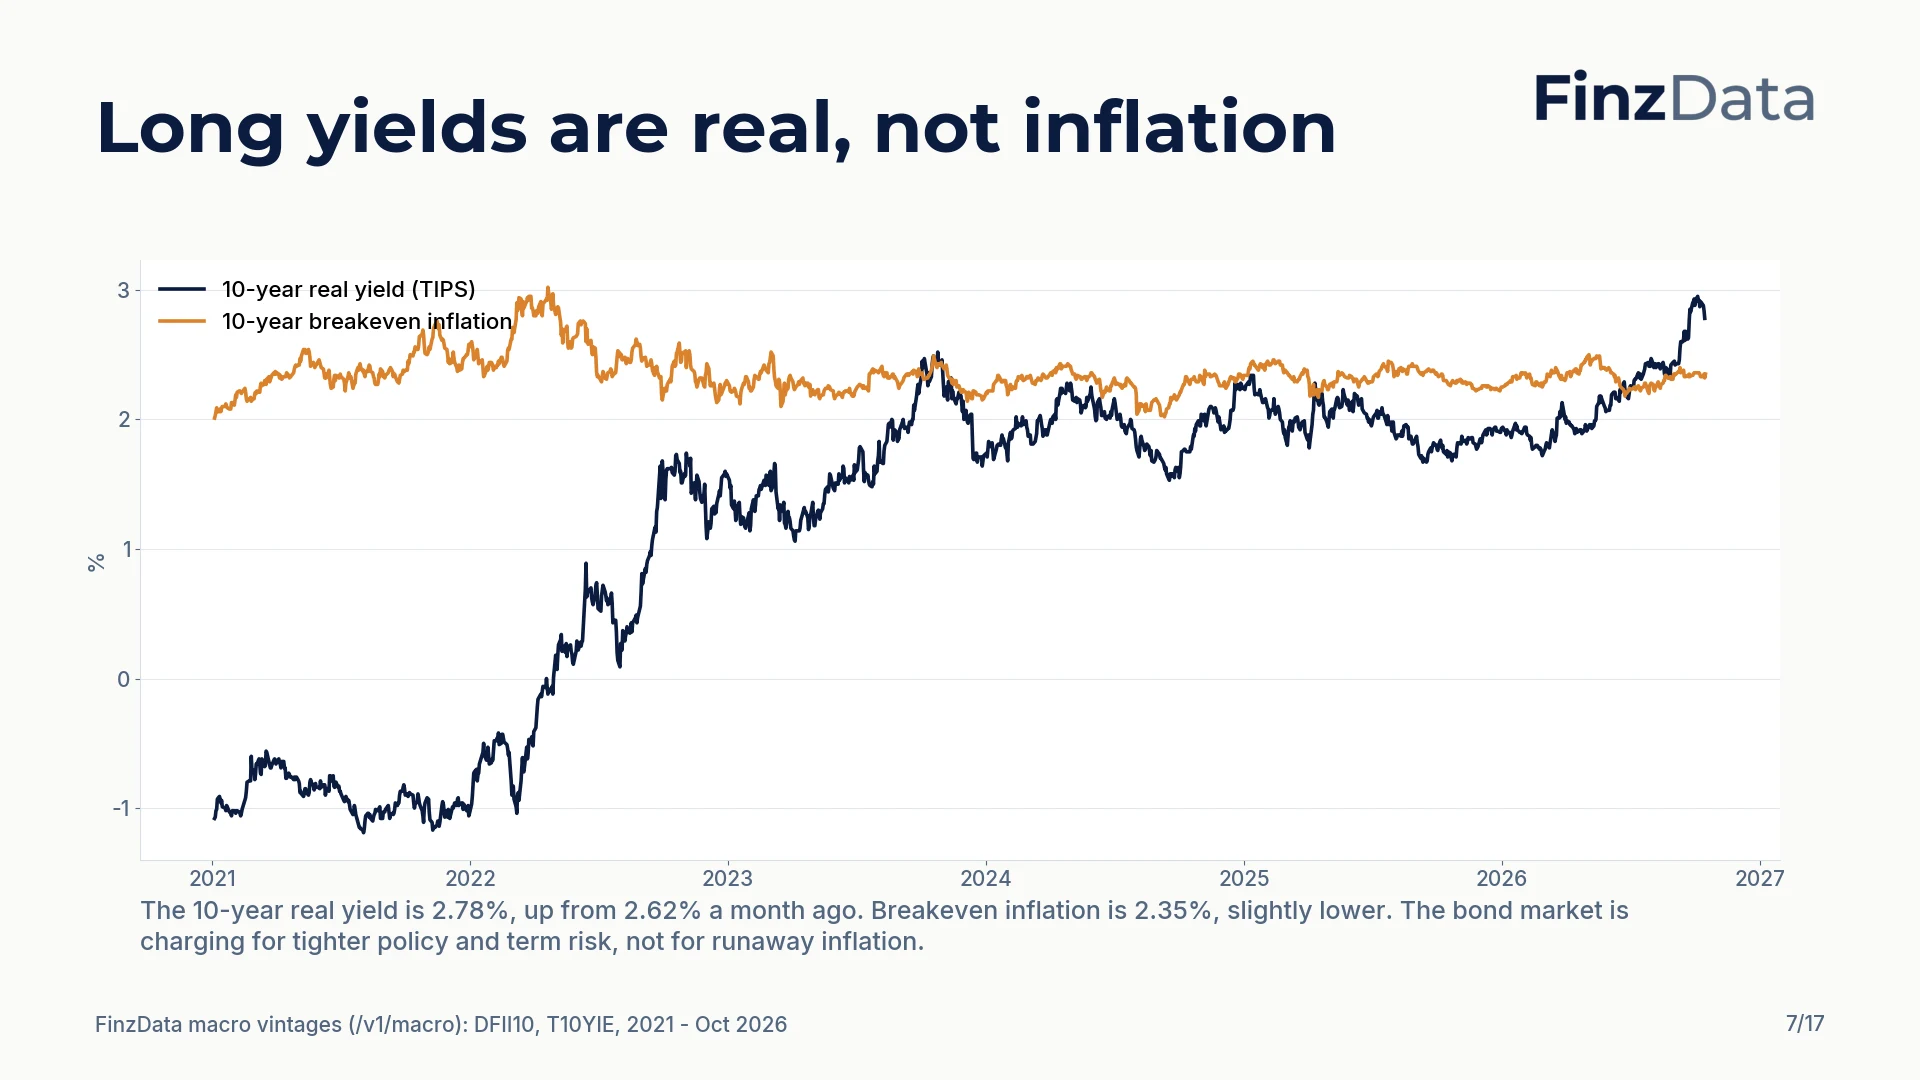
Nearly all of the 10-year yield is real return; breakevens have not moved up with it.
The 10-year TIPS real yield is 2.78%, up from 2.62% a month ago; the 10-year breakeven is 2.35%, slightly lower. Nearly all of the long yield is real return: the market is charging for tighter policy and term risk, not for runaway inflation.
8. Funds are deep short Treasuries
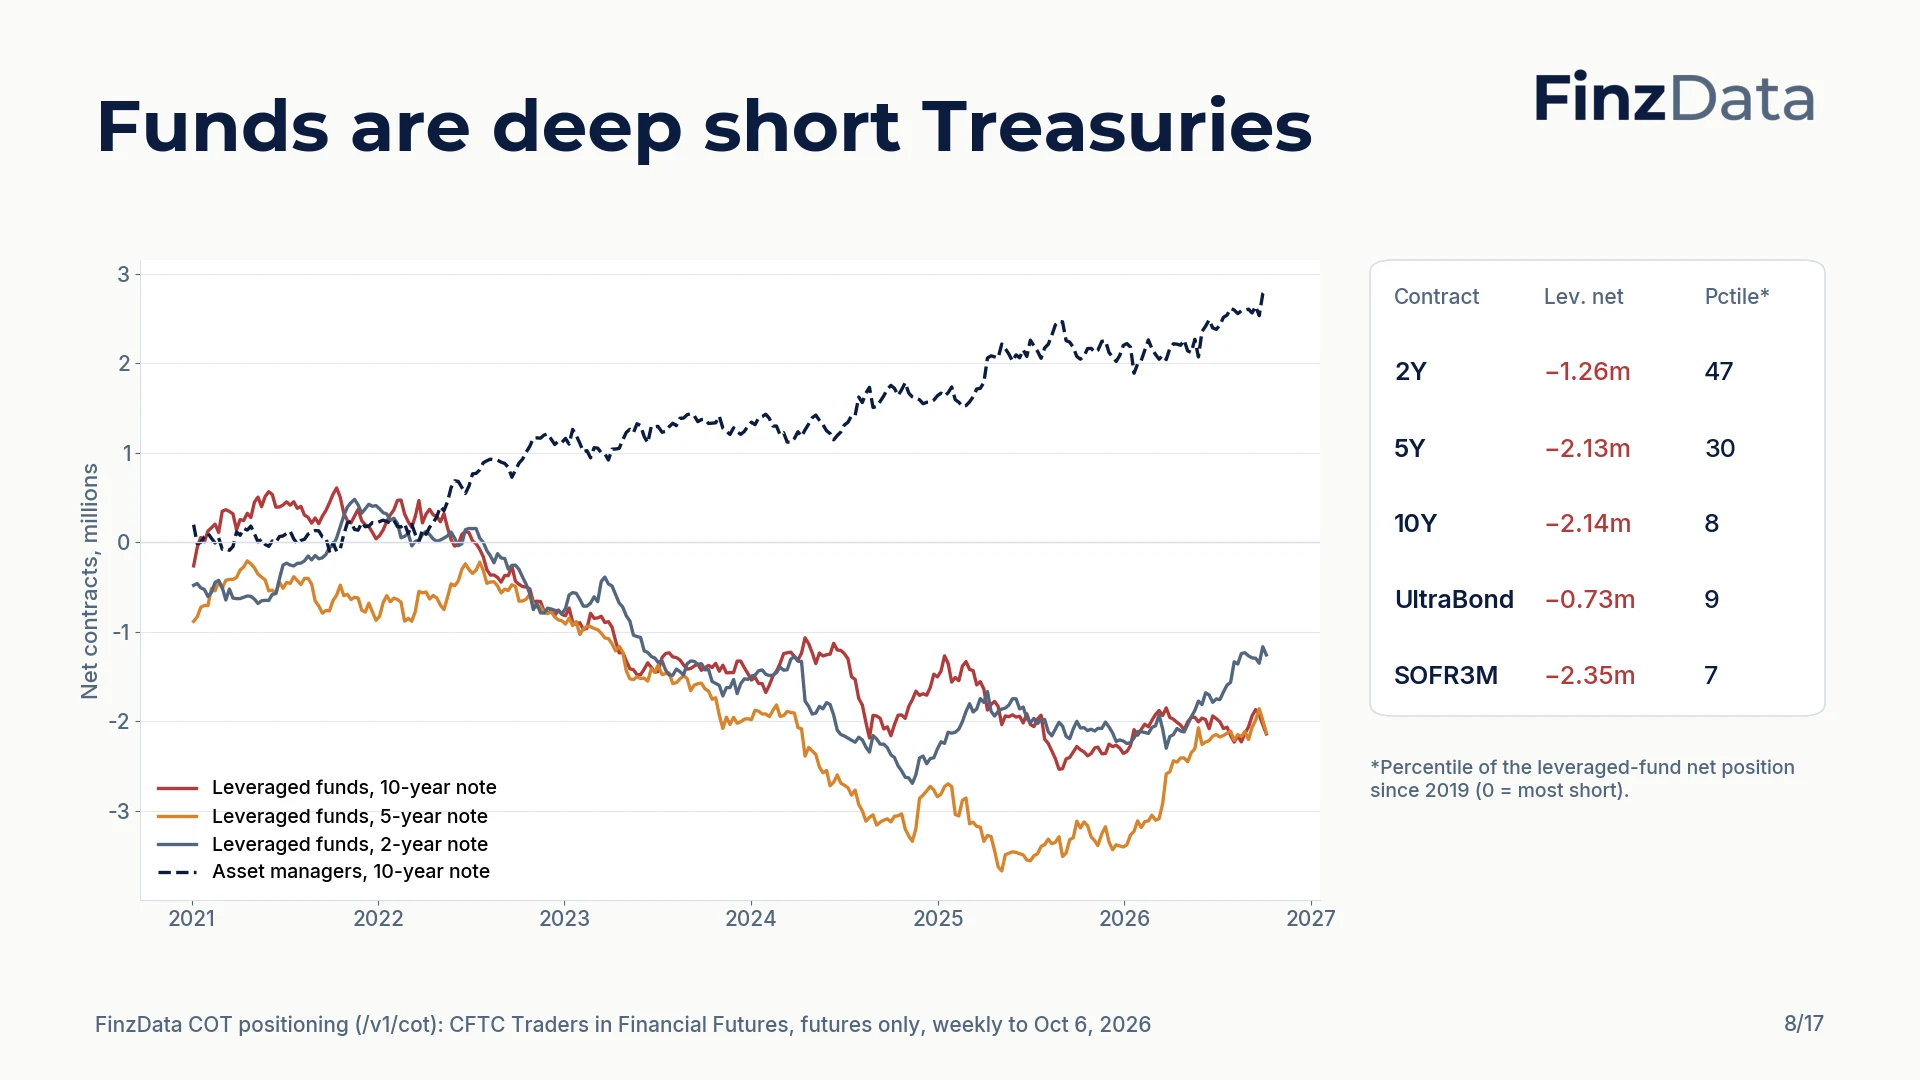
Leveraged funds are net short 2.14m 10-year note contracts, more short than in 92% of weeks since 2019, while asset managers are long 2.83m. That mirror image is the cash-futures basis trade, a leveraged position that is sensitive to funding stress.
FinzData COT data (CFTC Traders in Financial Futures) show leveraged funds net short 2.14m 10-year note contracts on October 6, a position more short than in 92% of weeks since 2019, and 0.73m Ultra Bond contracts (9th percentile). Asset managers are long 2.83m 10-year contracts. That mirror image is the cash-futures basis trade: hedge funds own cash Treasuries financed in repo and short futures. It is a leveraged position, which is why funding conditions on the next slide matter.
9. Liquidity is ample and stress is low
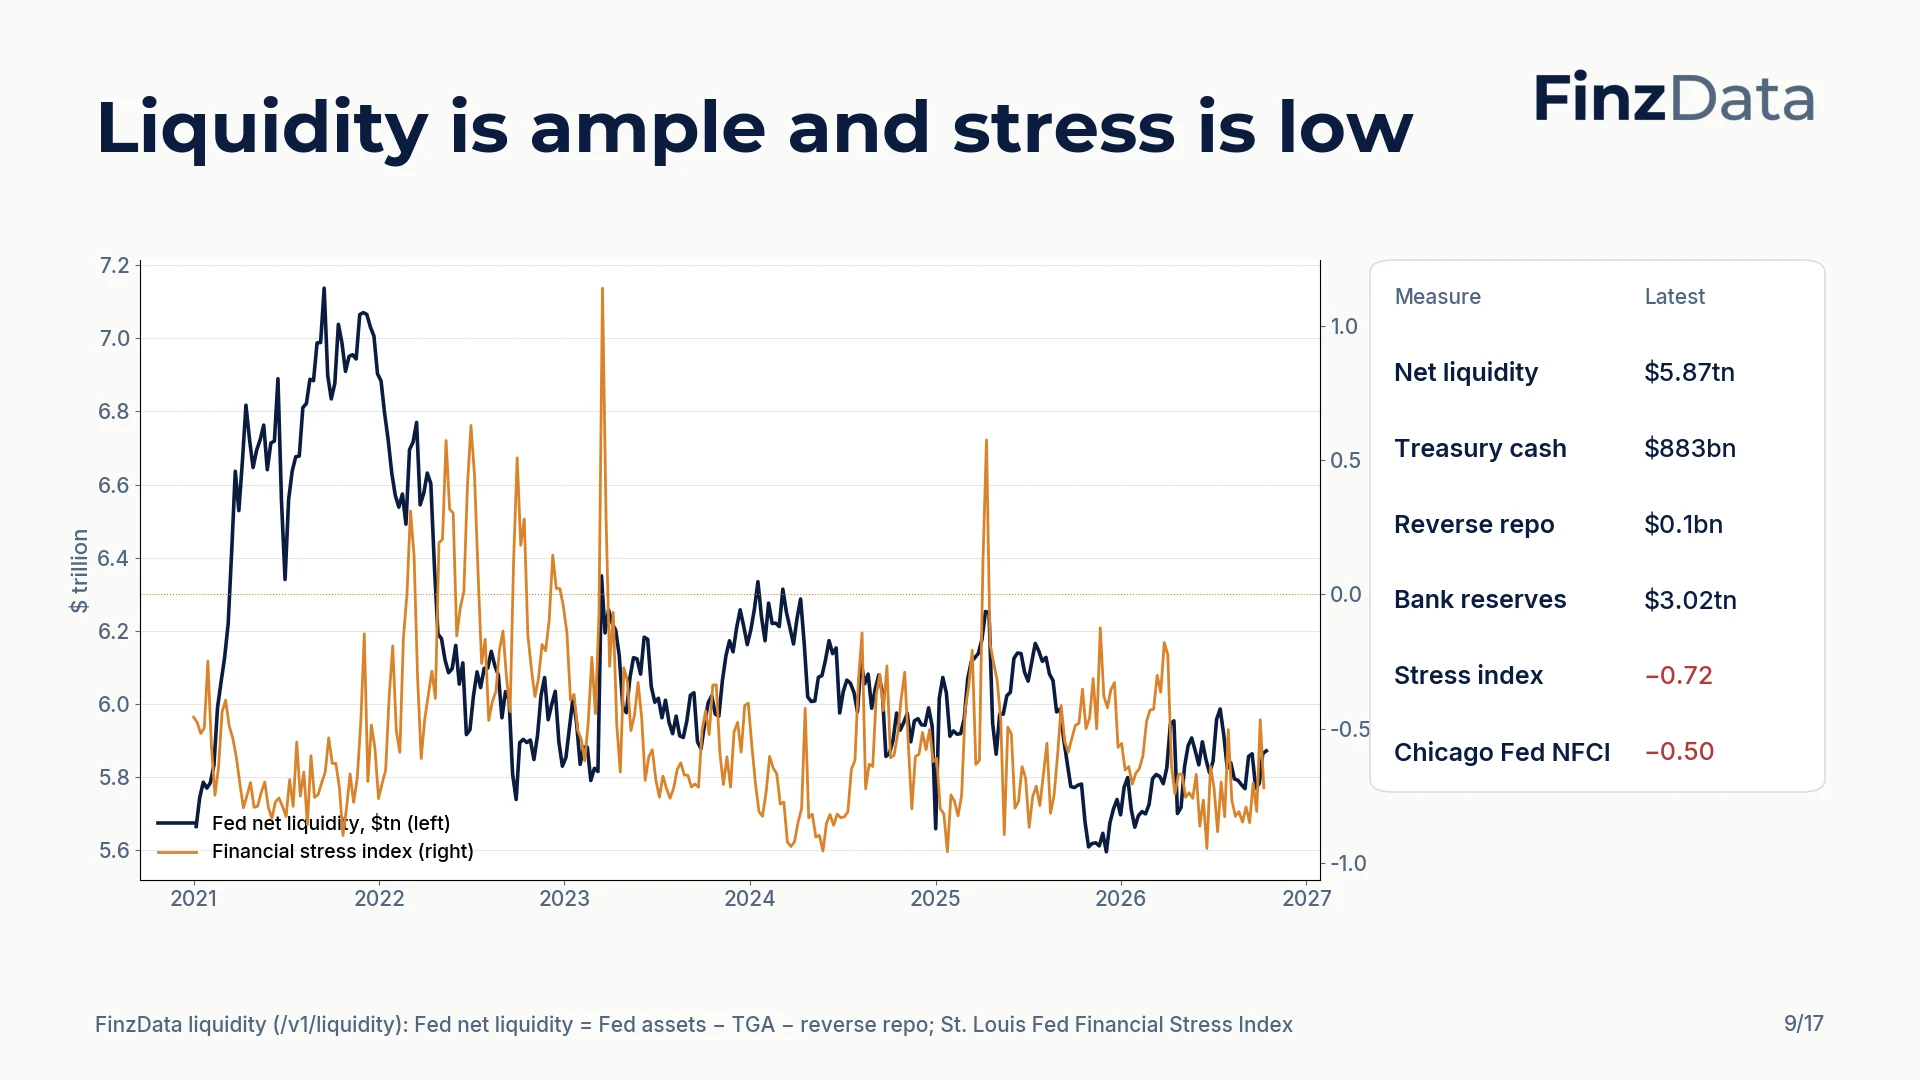
Fed net liquidity is $5.87tn and the reverse repo facility is essentially empty at $0.1bn. Both stress indices are below zero, meaning conditions are looser than average: this is a credit event in one corner of the market, not a system-wide funding squeeze.
FinzData liquidity data: Fed net liquidity (Fed assets minus the Treasury General Account minus reverse repo) is $5.87tn, the reverse repo facility holds just $0.1bn, bank reserves are $3.02tn and the TGA $883bn. The St. Louis Fed stress index (−0.72) and the Chicago Fed NFCI (−0.50) are both below zero, meaning conditions are looser than average. This is a credit event in one corner of the market, not a system-wide funding squeeze.
10. Foreigners kept buying Treasuries
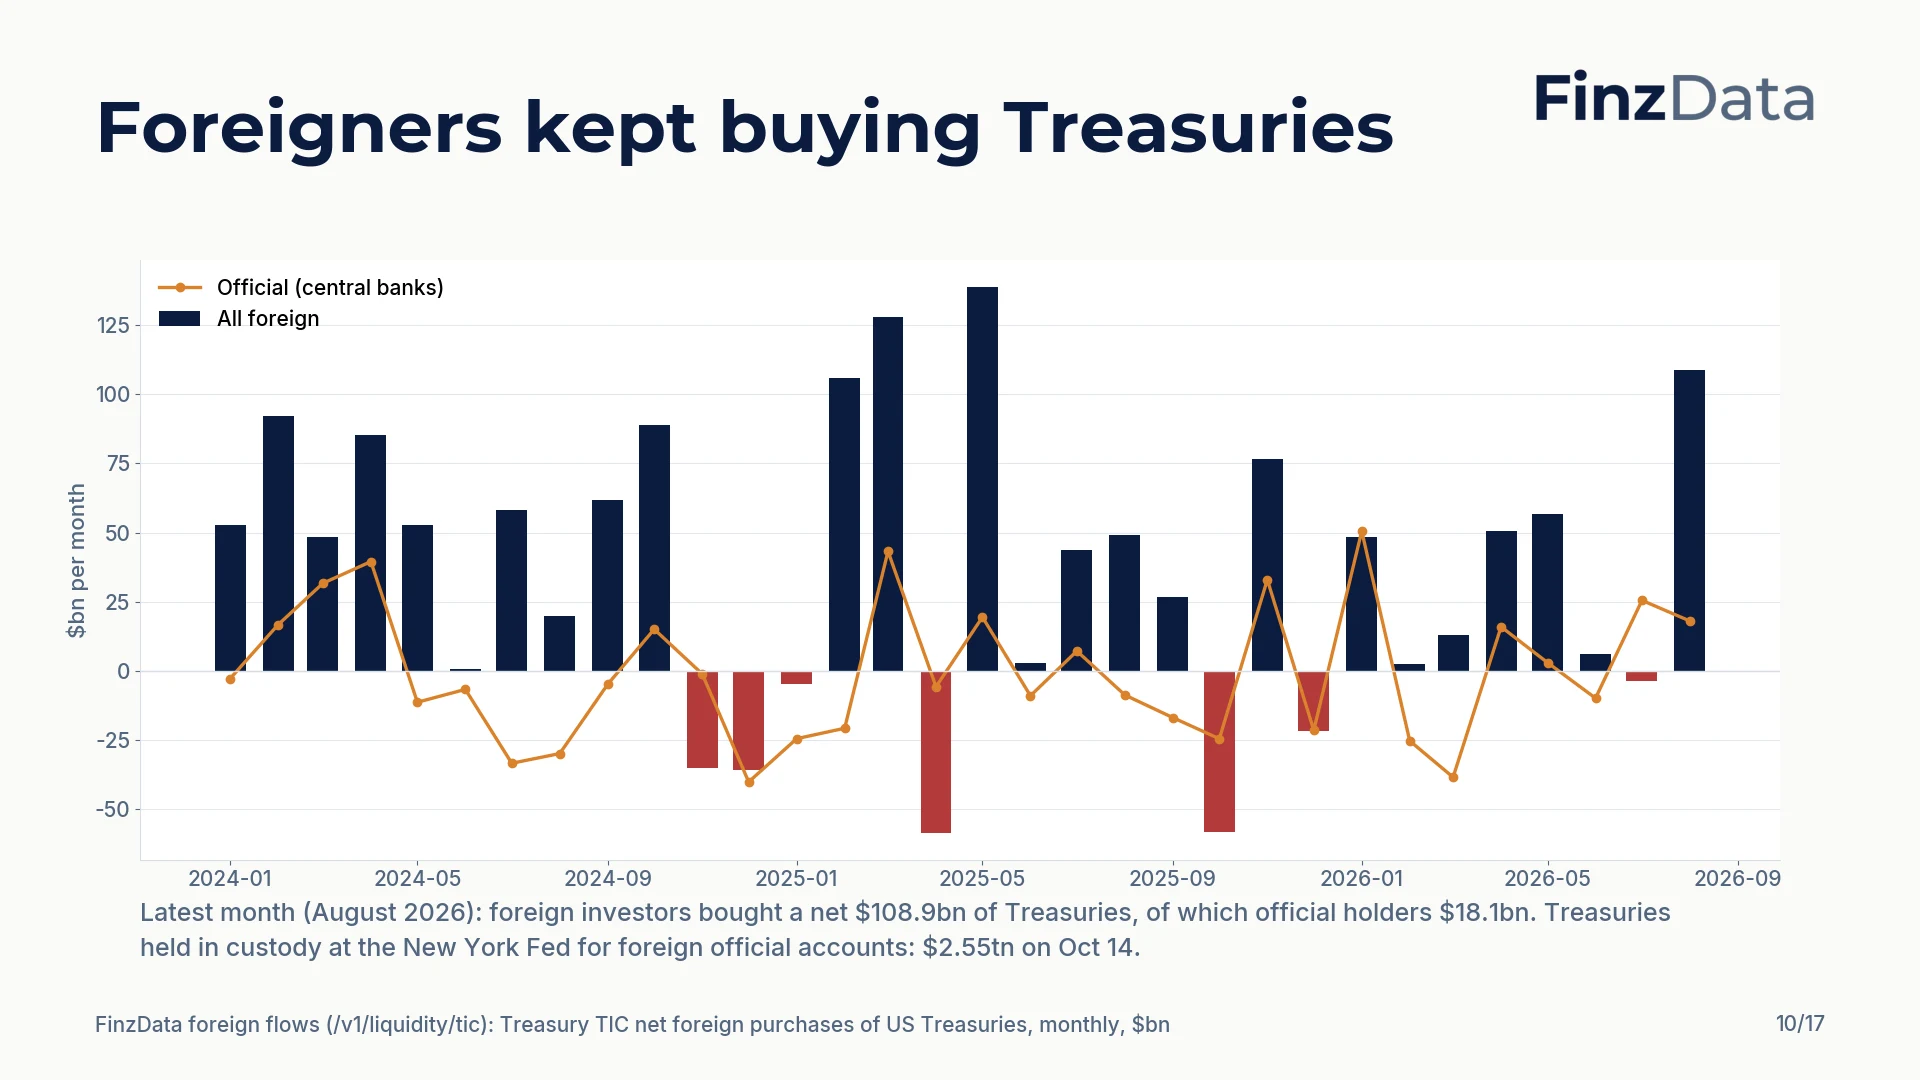
Foreign demand for Treasuries has held up: a net $108.9bn in August. The rally at the long end has a buyer base behind it.
From FinzData's TIC dataset: foreign investors bought a net $108.9bn of Treasuries in August 2026, of which official holders $18.1bn, and Treasuries in custody at the New York Fed for foreign official accounts total $2.55tn. The long-end rally has a buyer base behind it.
11. Junk lagged, Treasuries rallied
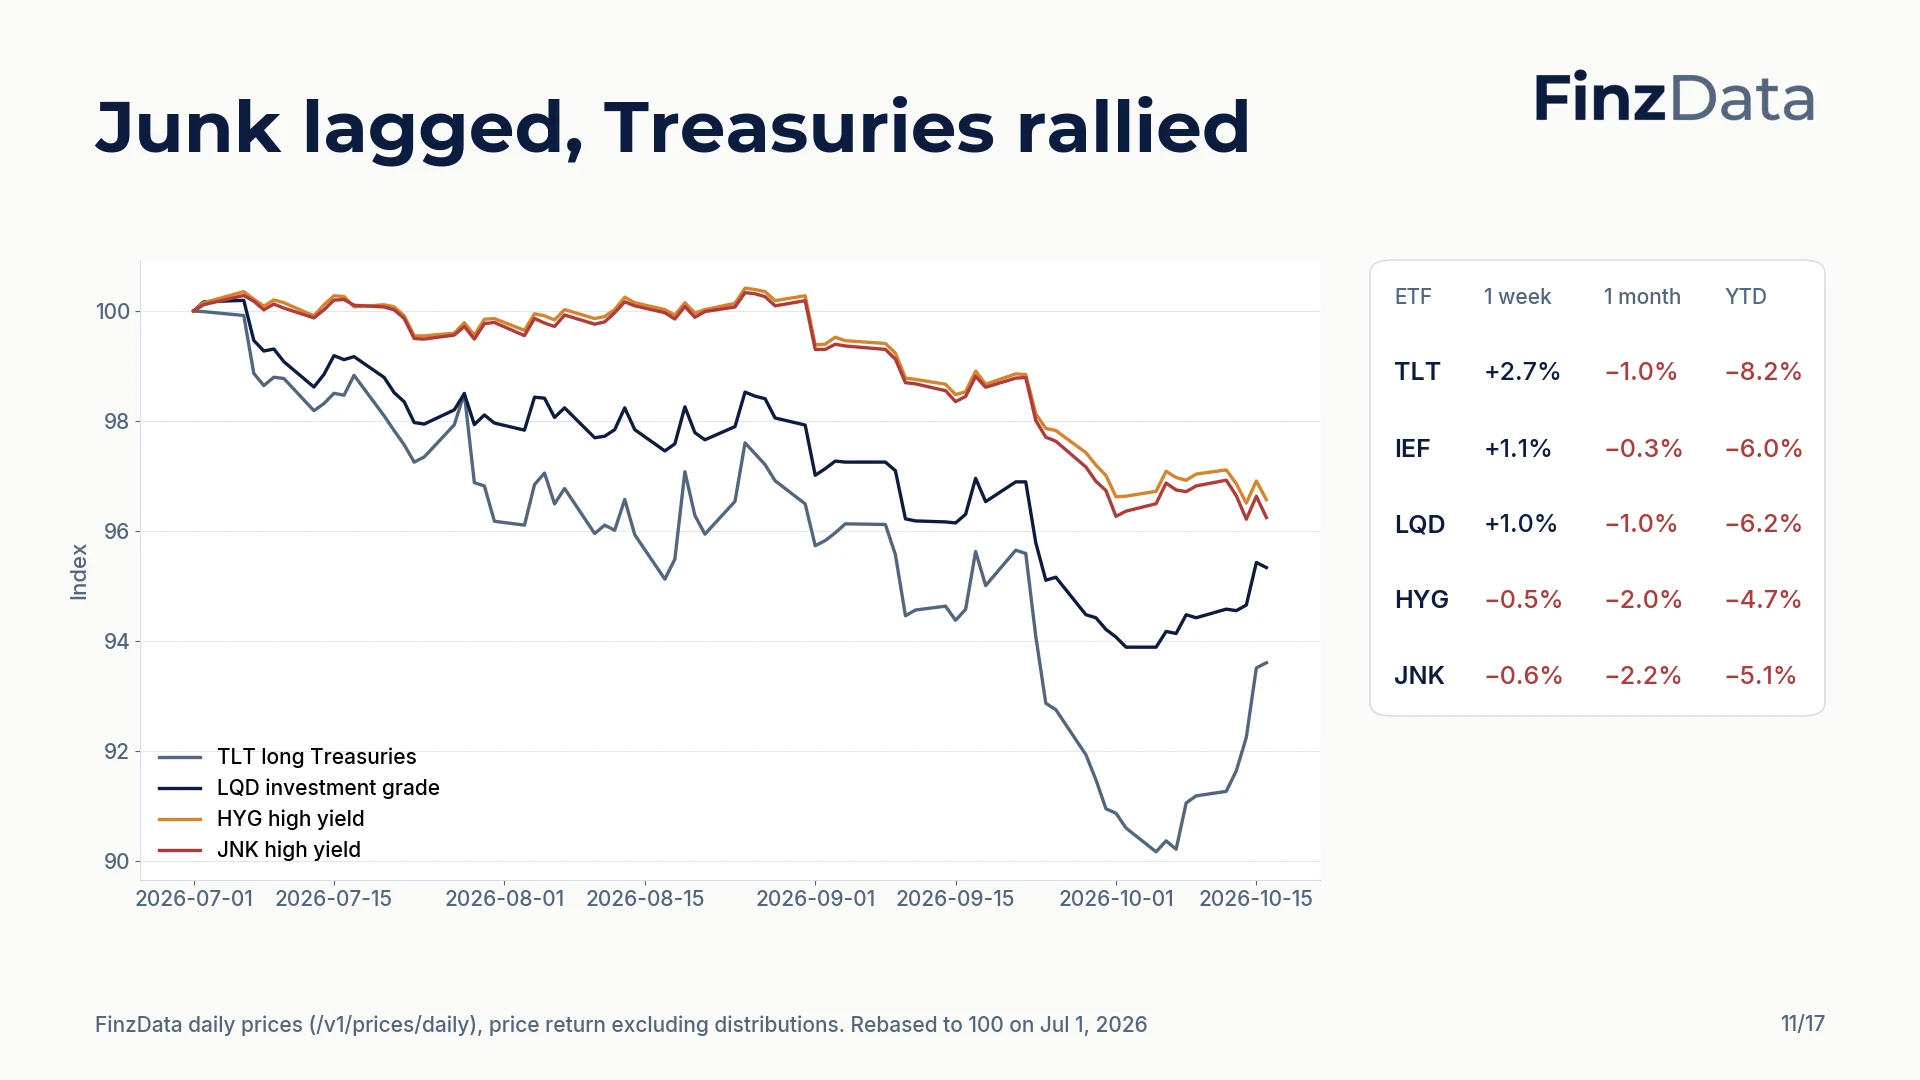
In the week to Oct 16 long Treasuries gained 2.7% and IG gained 1.0% on falling yields, while high-yield ETFs fell 0.5-0.6%: high-yield spreads widened.
In the week to October 16 long Treasuries (TLT) gained 2.7% and investment-grade corporates (LQD) 1.0%, carried by falling yields, while high-yield ETFs fell (HYG −0.5%, JNK −0.6%). IG up and HY down in the same week means high-yield spreads widened. Returns are price-only.
12. AI infrastructure stocks broke
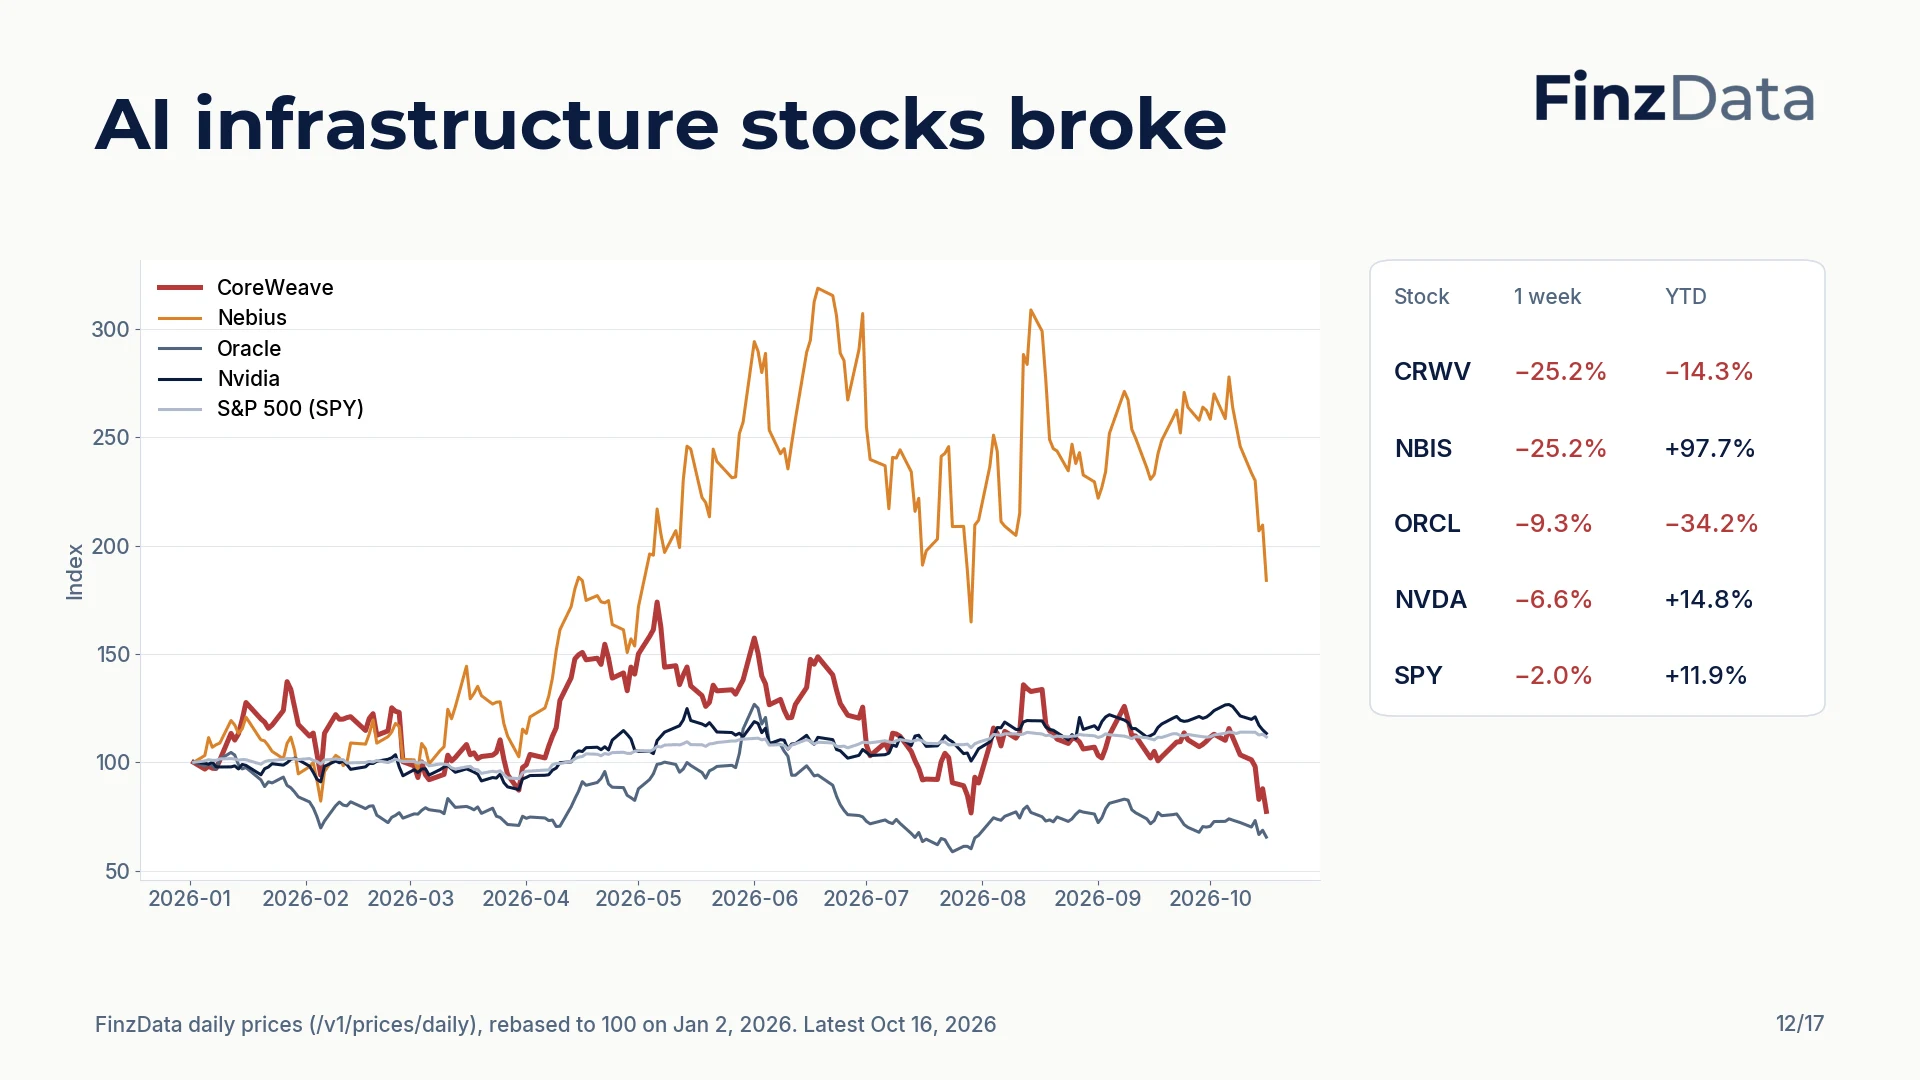
CoreWeave and Nebius each fell 25% in a week; Oracle fell 9% and Nvidia 7%, while the S&P 500 fell 2%. The selling hit the most leveraged builders hardest.
CoreWeave and Nebius each fell 25.2% in the week; Oracle fell 9.3%, Nvidia 6.6% and SPY 2.0%. The selling concentrated on the companies most dependent on debt to fund data-centre buildouts.
13. CoreWeave's books, as filed
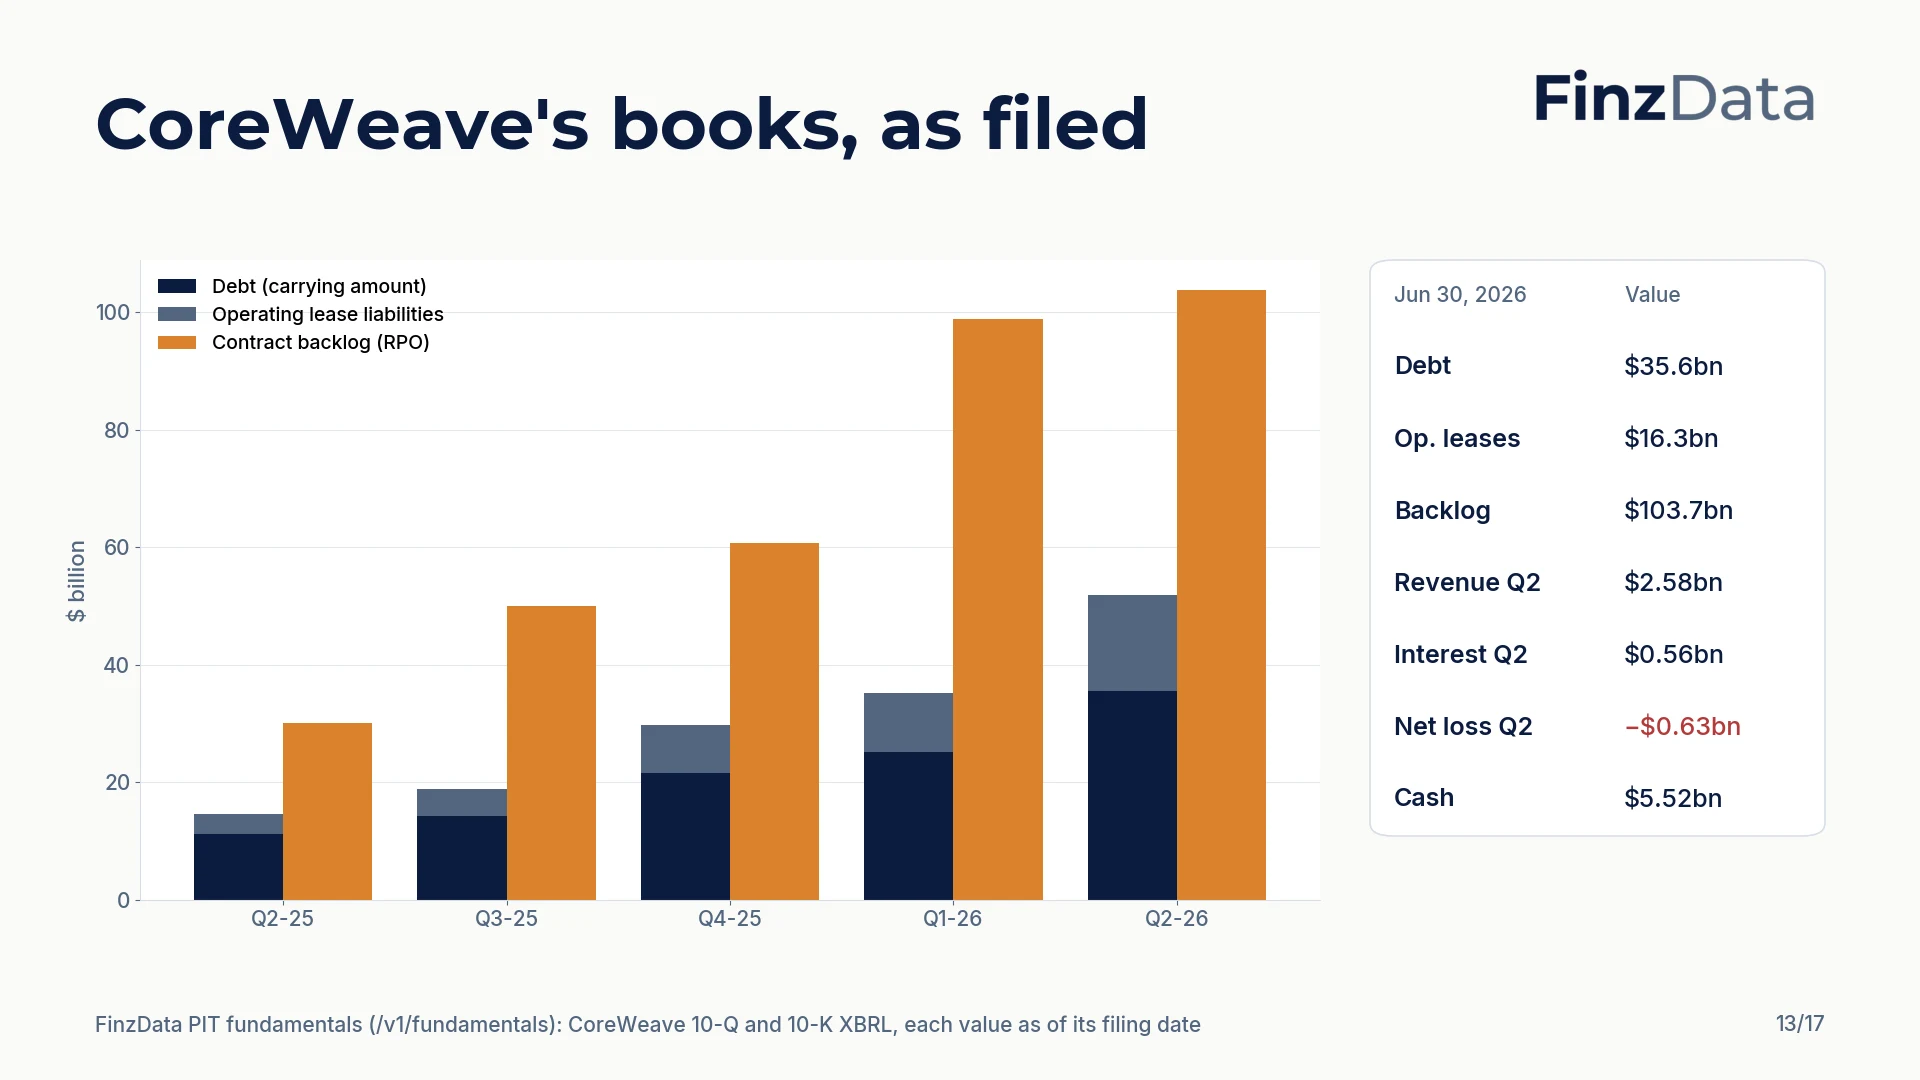
From its own filings: debt rose from $11.2bn to $35.6bn in a year and lease liabilities to $16.3bn, about $52bn together. Against that sits a $103.7bn contracted backlog. Q2 interest expense of $0.56bn was 22% of revenue, and the quarter lost $0.63bn.
FinzData point-in-time fundamentals, taken from CoreWeave's XBRL filings and stamped with each filing date: debt (carrying amount) rose from $11.2bn at June 30, 2025 to $35.6bn at June 30, 2026, and operating lease liabilities from $3.5bn to $16.3bn, about $51.9bn together. Against that, the contracted backlog (remaining performance obligations) is $103.7bn. Second-quarter revenue was $2.58bn, interest expense on debt $0.56bn (22% of revenue) and the net loss $0.63bn; cash was $5.52bn. Because each value carries the date it was filed, a backtest sees only what was public at the time.
14. Who sold CoreWeave, who bought
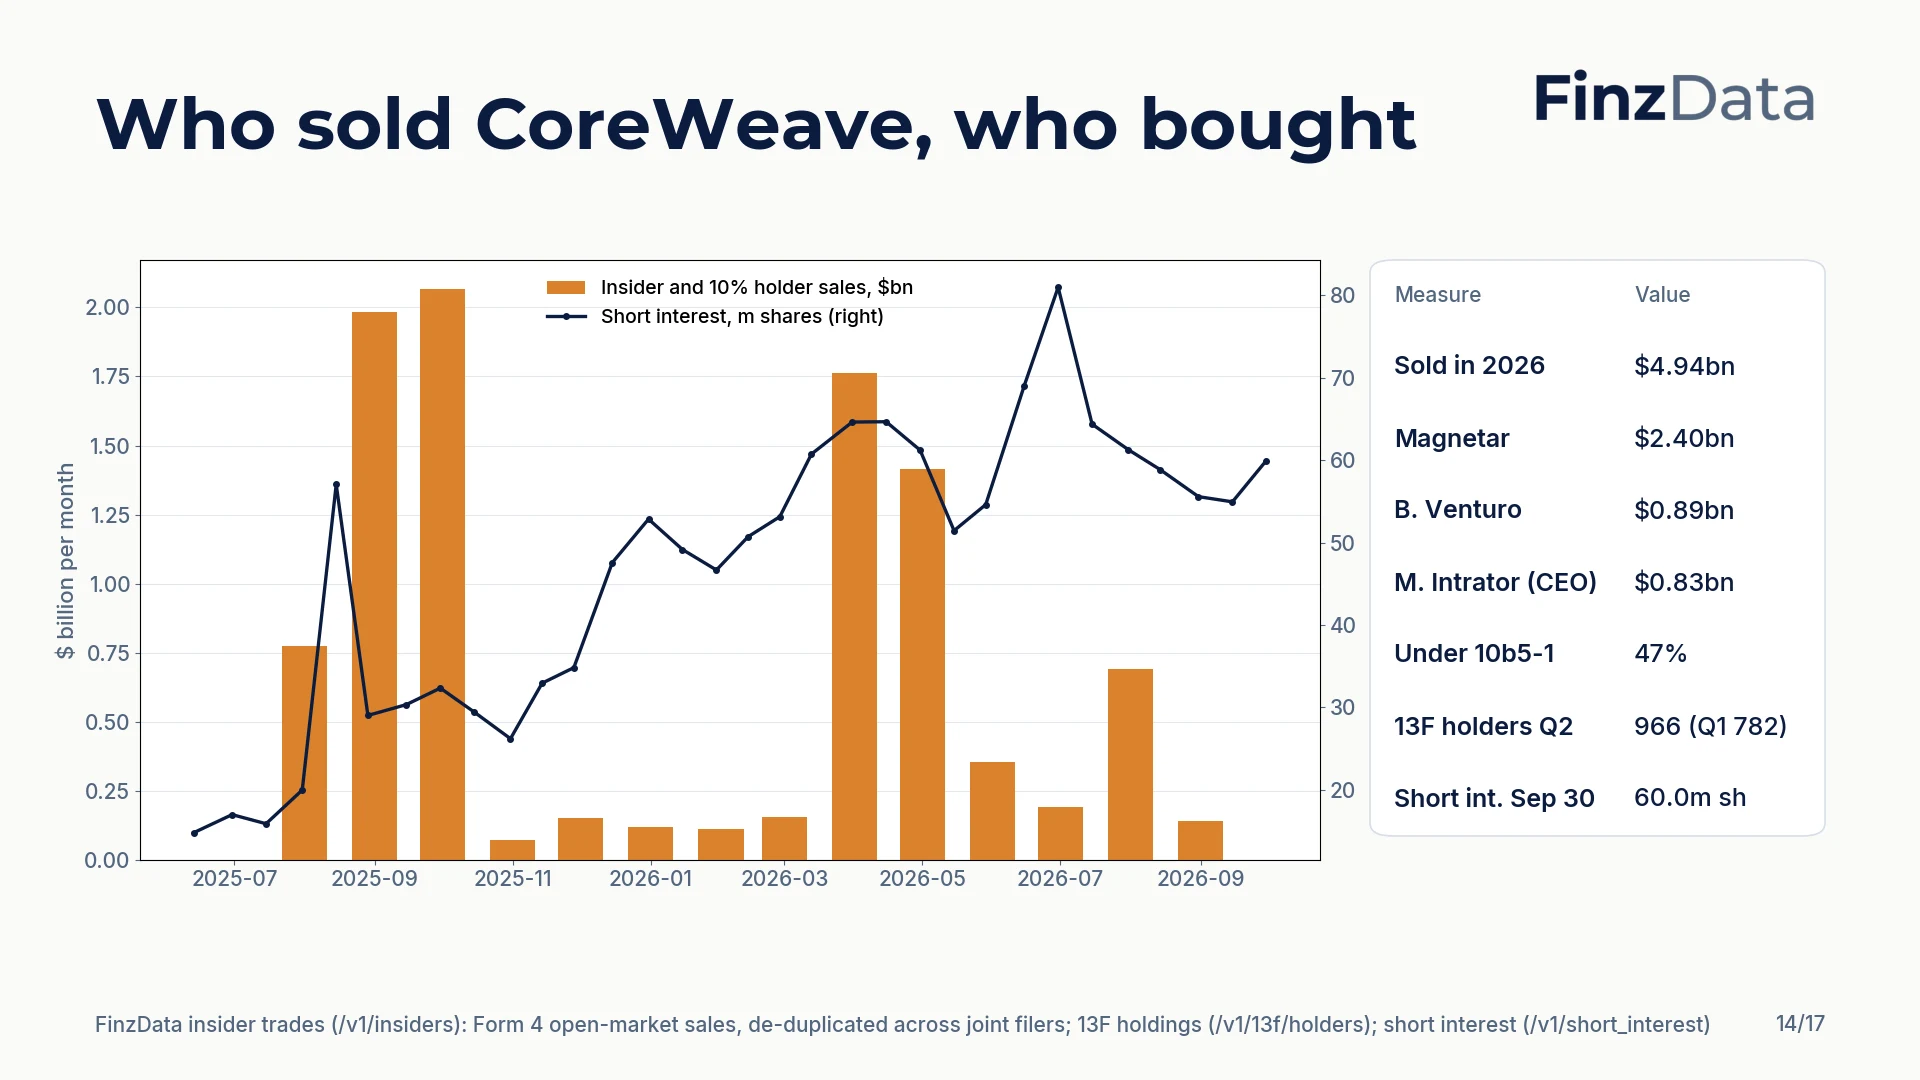
Insiders and 10% holders sold $4.94bn of stock in 2026 through September 22, at an average $106.77, led by Magnetar ($2.40bn). Only 47% of it was under pre-set 10b5-1 plans. Institutions kept buying: 13F holders rose from 782 to 966 in Q2, with BlackRock adding 14.7m shares. Nvidia holds 47.2m.
FinzData insider data (Form 4, open-market sales, de-duplicated across joint filers): insiders and 10% holders sold $4.94bn of CoreWeave stock in 2026 through September 22 at an average of $106.77. Magnetar sold $2.40bn, Brian Venturo $0.89bn, CEO Michael Intrator $0.83bn and Brannin McBee $0.55bn; 47% of the total was under pre-arranged 10b5-1 plans. Institutions moved the other way: FinzData 13F data show holders rising from 782 to 966 in Q2 2026, with BlackRock adding 14.7m shares and Invesco 11.4m, while Magnetar cut 16.5m. Nvidia holds 47.2m shares. Short interest was 60.0m shares on September 30.
15. The credit market's verdict
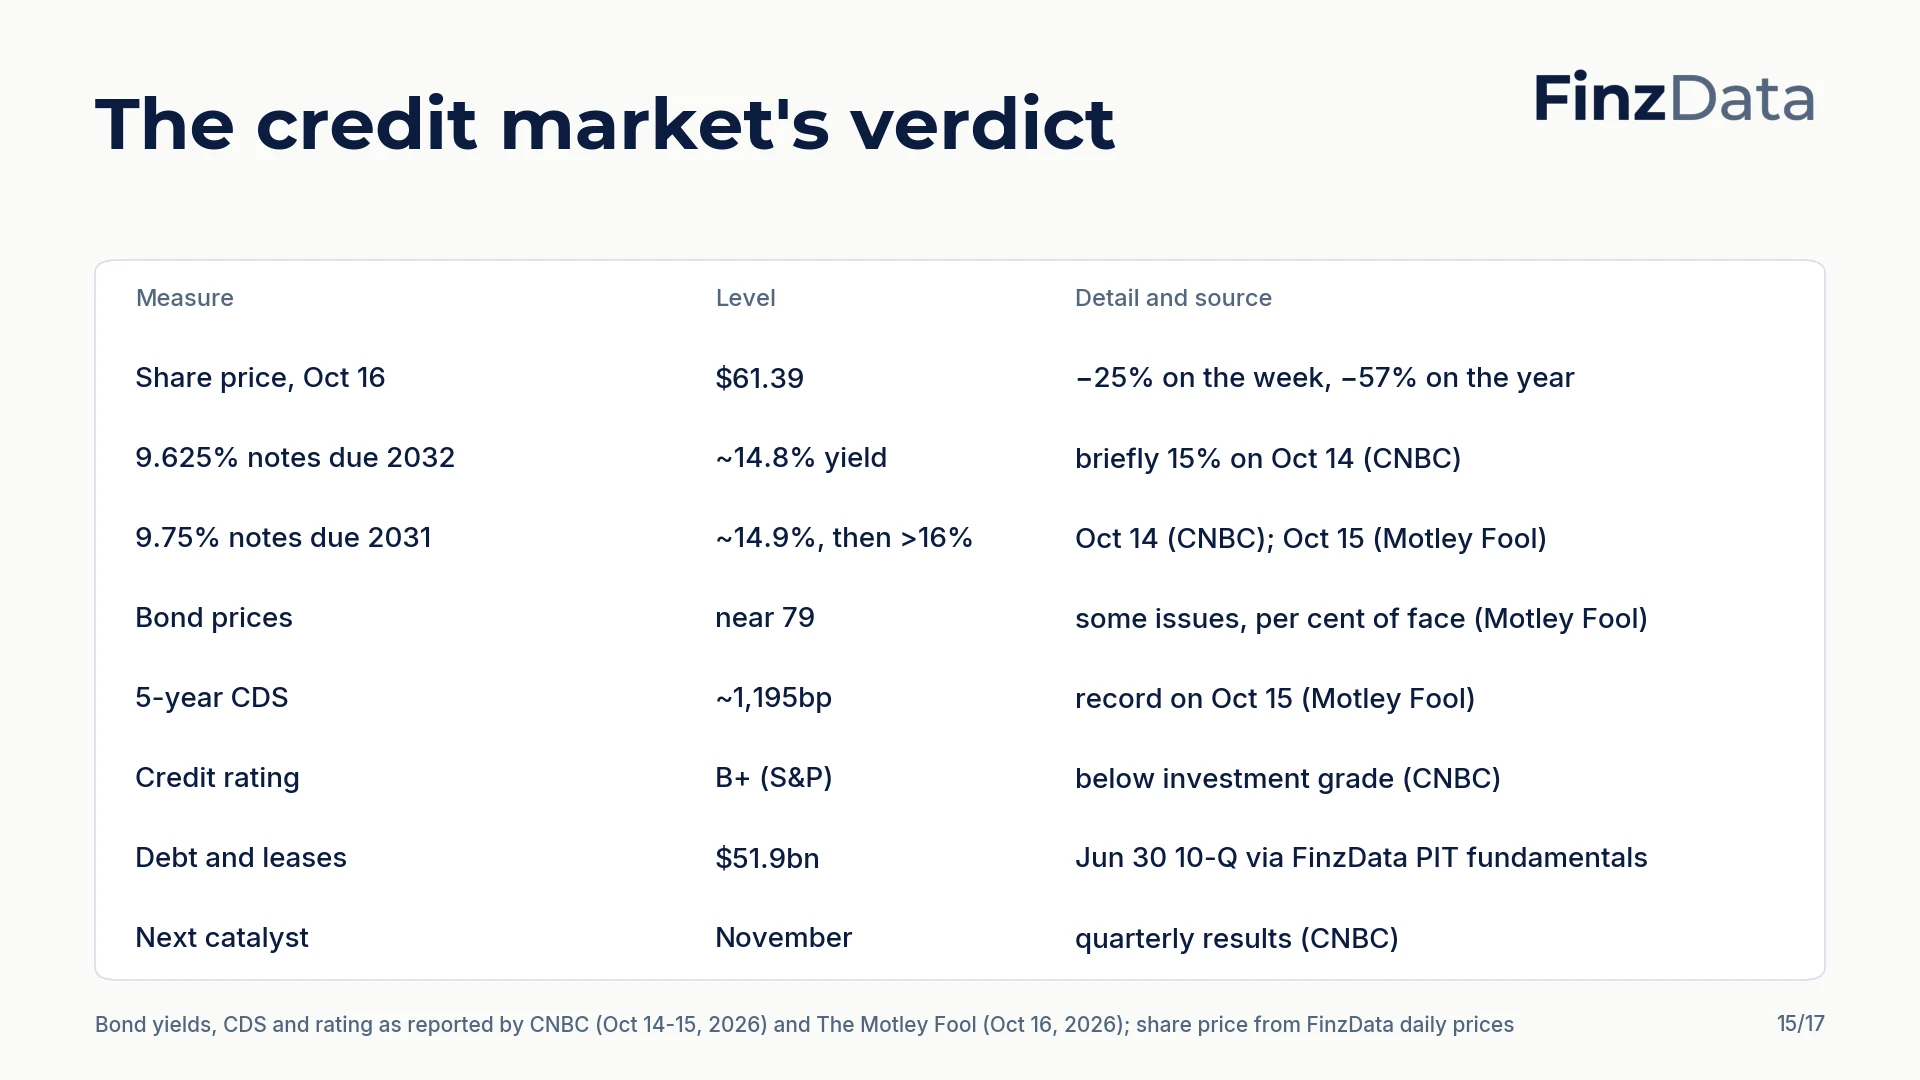
A B+ issuer with ~15-16% bond yields and CDS near 1,200bp is priced like distressed credit. Management says its contract backlog covers its debt obligations; the market is not taking that on trust.
The bond and CDS figures here are not FinzData data; they are as reported. CNBC put the 9.625% notes due 2032 at about 14.8% (briefly 15%) and the 9.75% 2031s at about 14.9% on October 14; The Motley Fool reported the 2031s above 16% and a record five-year CDS near 1,195bp on October 15, with some bonds near 79 cents. S&P rates CoreWeave B+. The $51.9bn of debt and leases is from FinzData's filing data. Results are due in November.
16. One story: rates, issuance, quality
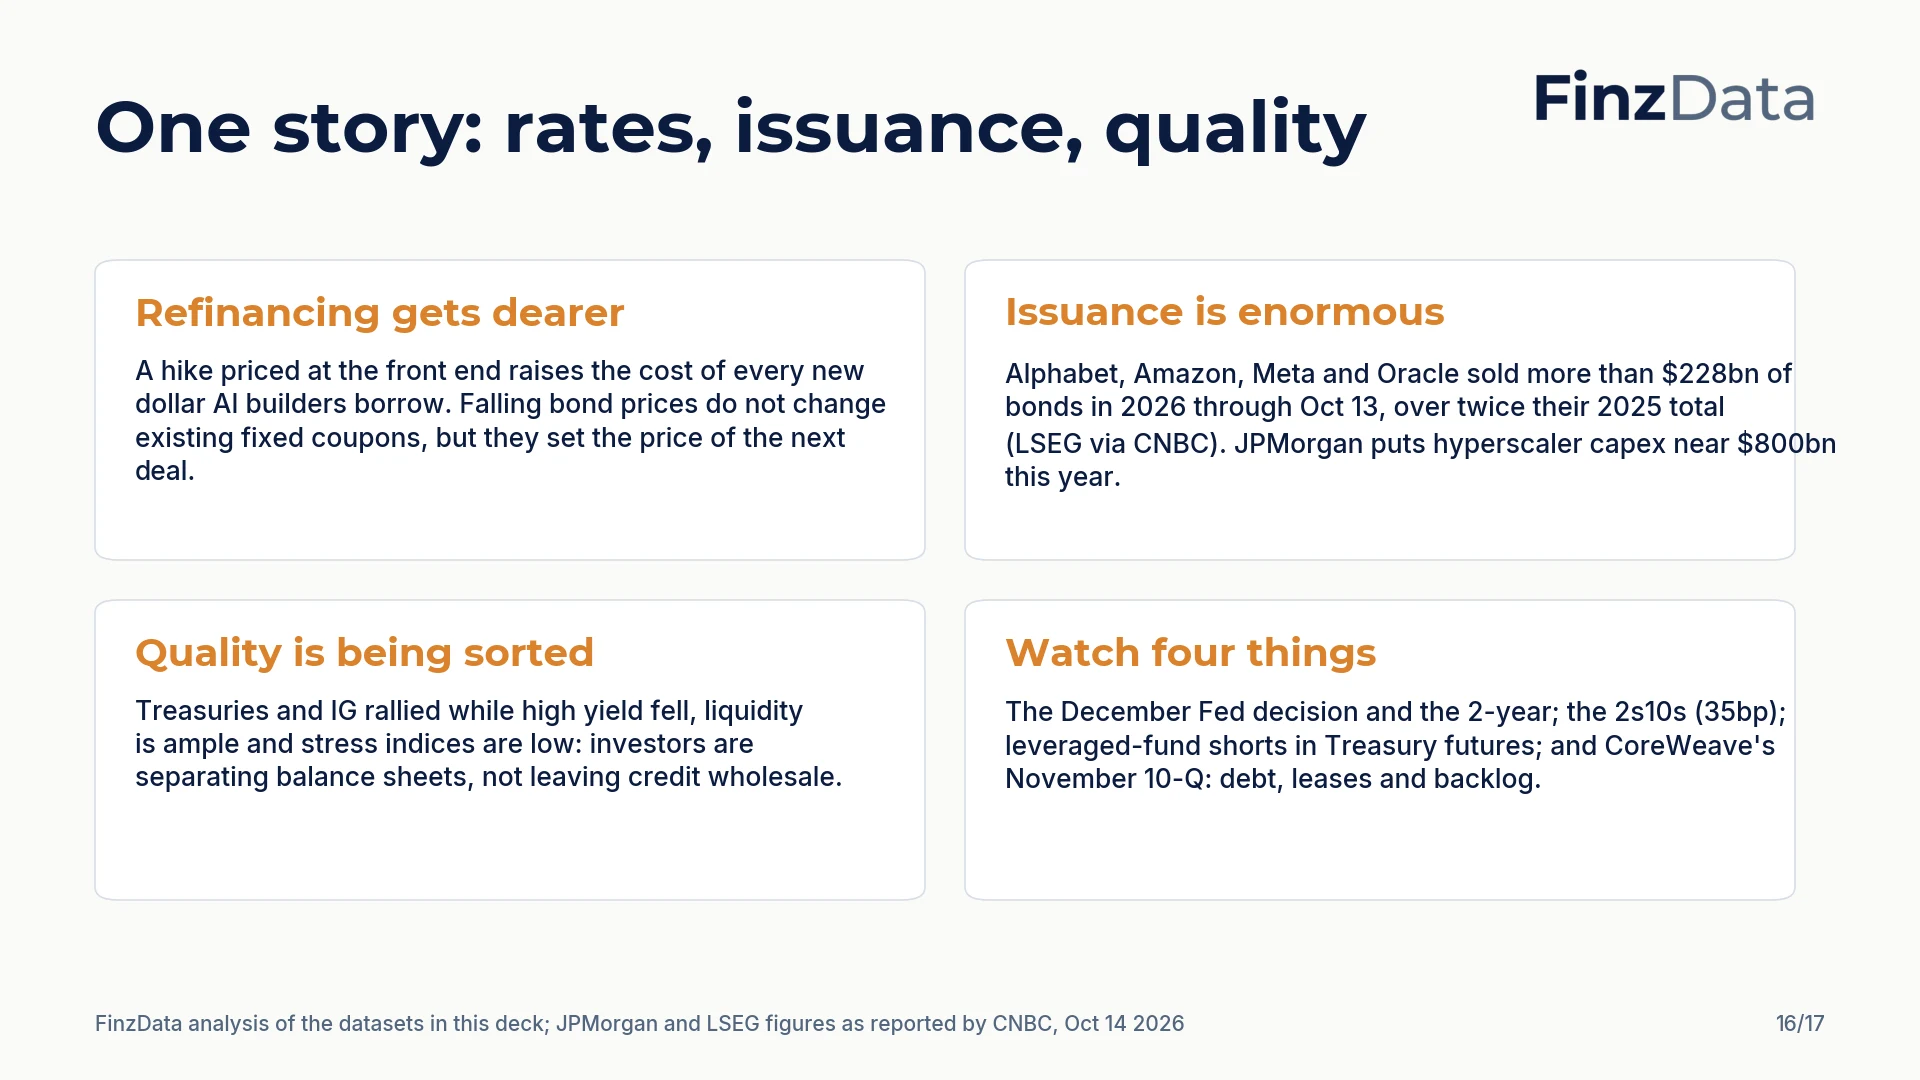
Higher short rates, heavy AI issuance and a flight to quality are hitting the most leveraged borrowers first.
Short rates pricing a hike raise the cost of new borrowing. Issuance is enormous: Alphabet, Amazon, Meta and Oracle had sold more than $228bn of bonds in 2026 by October 13 (LSEG via CNBC). And investors are sorting by balance sheet, buying Treasuries and IG while selling high yield and the most leveraged AI names, against a backdrop of ample liquidity and low stress. What to watch: the December Fed decision and the 2-year, the 2s10s, leveraged-fund shorts in Treasury futures, and CoreWeave's November 10-Q.
17. Data and method
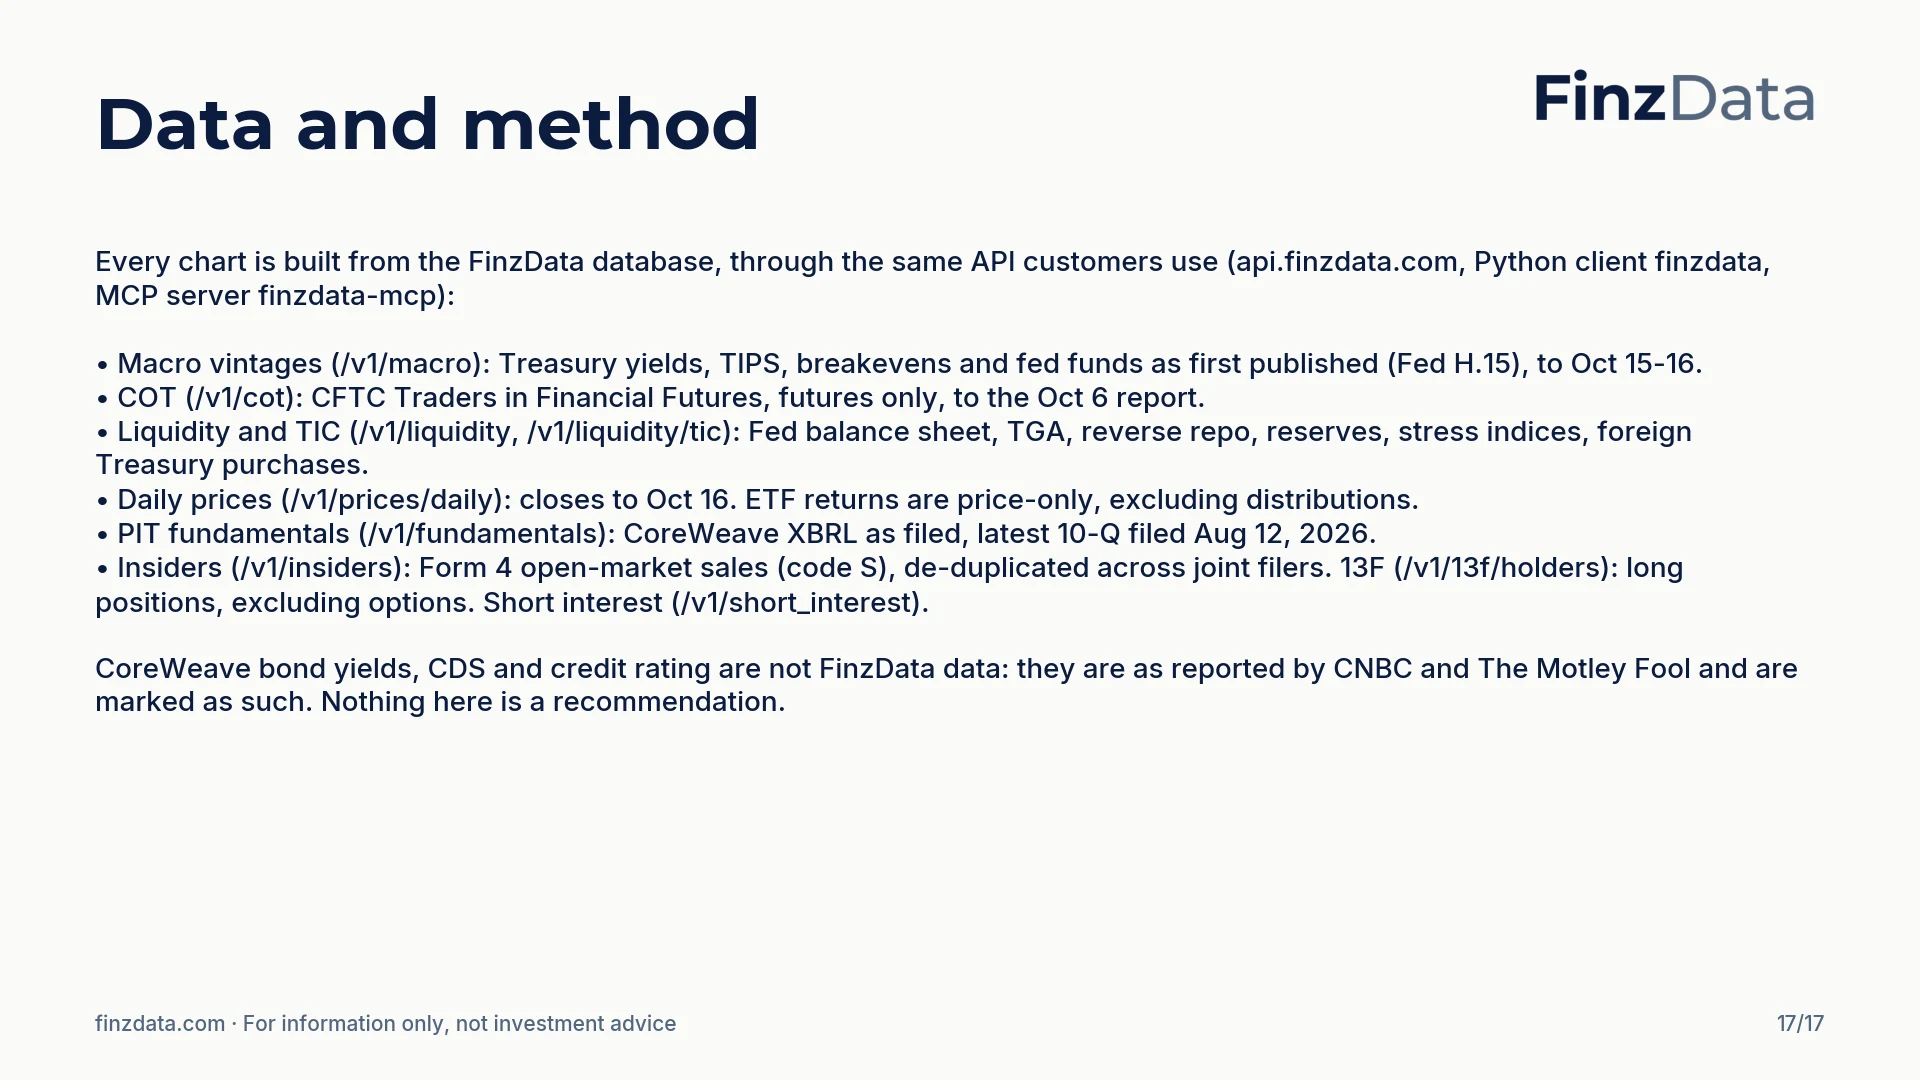
Datasets, endpoints and caveats.
Datasets and endpoints: macro vintages (/v1/macro), COT (/v1/cot), liquidity and TIC (/v1/liquidity, /v1/liquidity/tic), daily prices (/v1/prices/daily), point-in-time fundamentals (/v1/fundamentals), insiders (/v1/insiders), 13F (/v1/13f/holders) and short interest (/v1/short_interest). Bond yields, CDS and ratings are as reported by the press and marked as such. Nothing here is a recommendation to buy or sell any security.
Frequently asked questions
Is the yield curve inverted?
No. On October 16, 2026 the 10-year minus 2-year spread was 35bp and the 10-year minus 3-month was 83bp. Both are positive but have narrowed: the 2s10s from 74bp in January and the 3m10y by 16bp in one week.
Why are CoreWeave's bonds yielding around 15%?
Investors are worried about how much the company has borrowed to build AI data centres (about $52bn of loans and leases) as short-term rates price another Fed hike. Reported yields were about 14.8-16% and five-year CDS near 1,195bp in mid-October 2026.
Is the selling spreading to the wider credit market?
Partly. High-yield ETFs fell in the week while Treasuries and investment-grade bonds rose, so high-yield spreads widened. The weakness was concentrated in the most leveraged AI infrastructure names.
Download the deck (PDF, 17 slides) More research
Built for AI, quants, data scientists and financial analysts who backtest. Clean data. Real insights. Real alpha. finzdata.com. This material is for information only and is not investment advice. Data sources: FinzData macro vintages, COT, liquidity, TIC, daily prices, PIT fundamentals, insider trades, 13F holdings and short interest; bond and CDS levels as reported by CNBC (Oct 14-15, 2026) and The Motley Fool (Oct 16, 2026)
Get FinzData research free, every morning
The daily brief: what moved, the macro releases that matter, positioning and liquidity, with charts. One email a day, free, unsubscribe anytime.
Topics and related searches
Yield curve Credit markets and debt Interest rates and Treasury yields Federal Reserve and monetary policy AI infrastructure and data-center capex
People also search
- is the yield curve inverted october 2026
- why are coreweave bonds yielding 15 percent
- will fed hike rates in december 2026
- are treasury yields falling october 2026
- how much did coreweave stock fall last week
- what is 2s10s spread today
- why is yield curve flattening now
- is high yield spreading october 2026
- are leveraged funds short treasuries
- when will coreweave report earnings
- 2 year treasury yield history october 2026
- 10 year treasury yield chart 2026