
FinzData Research · Published 26 October 2026
Capitol Alpha? Do Politicians Beat the Market? Congress Stock Trading, 2012–2026
We tested 70,152 House and Senate trades and the President's own filing against the S&P 500 and the equal-weight index, from the trade date and from the day the public could see it. The answer: rarely, slowly, and mostly style rather than skill.
Get FinzData research free, every morning
The daily brief: what moved, the macro releases that matter, positioning and liquidity, with charts. One email a day, free, unsubscribe anytime.
Contents
- Two ways to read a congressional trade
- The copy trade is already crowded
- Copy-Congress returns are mostly style beta
- The average member has no edge — and our fourteen years agree
- The edge lives in power, not in Congress
- Trade date or disclosure date? Test it yourself
- President vs Senate vs House: no branch beats the S&P 500; only the Senate beats equal weight
- “Genius sells, terrible buys” — until you change the benchmark
- Against the index everyone loses; against equal weight only the Senate wins — slowly
- The Senate’s edge builds over years; the House never leaves zero
- Strip out size and value, and Congress’s alpha is zero
- Copying the Senate beat the S&P 500 by 0.7 points a year — at higher risk
- Democrats edge Republicans — by about a point a year, not ten
- The party gap is value versus growth, not stock picking
- No party owns the edge — the winning side changes with the term
- Edges come and go with the cycle — no side wins every term
- Big tickets and fast filers: the two filters that matter
- 14 members beat equal weight per trade — but only 3 survive a factor test
- Most of Washington is buying beta
- Senators trade through spouses and joint accounts; House members trade for themselves
- One account out-trades all of Congress
- Trade the person, the flow and the benchmark — not the branch
- Late filing is common, cheap — and a signal
- Five ways congressional data fakes alpha
- Built, not promised: fourteen years, every row timestamped
- One record, four desks
- What an institutional buyer checks
- Priced to clear procurement in a day
- Reform changes the feed, not the value of the archive
- What ships next
- Frequently asked questions
Do politicians beat the market?
Rarely, slowly, and mostly not through stock picking. FinzData scored every purchase disclosed by members of the House and Senate from February 2012 to October 2026: 70,152 transactions in 7,493 filings by 342 members, of which 24,722 stock purchases could be priced. We added 468 purchases from the President's April 2026 OGE 278-T filing. Each purchase is measured from two dates, the day it was made and the day the public could see it, against two benchmarks: the S&P 500 and its equal-weight version (RSP), the fairer yardstick for anyone picking individual stocks.
The short answer: against the S&P 500, no branch wins. Against equal weight, the House is flat and only the Senate is ahead, by 2.8% a year after a purchase. Once size, value and momentum are removed, the alpha of Congress as a whole is zero.
Congress stock trading by the numbers
- 27 days: the median gap between a trade and its public disclosure.
- 17%: about one trade in six is filed after the STOCK Act's 45-day deadline.
- −13.6%: how far House purchases trail the S&P 500 four years later. Senate purchases trail by 5.2%.
- +2.8%: Senate purchases against equal weight at one year; +7.7% at four years. House purchases: +0.1%.
- 0.0%: the Senate's edge before disclosure. There is no pre-disclosure pop to capture.
- 77% of Senate trades run through a spouse or a joint account; half of House trades are in the member's own account.
Pelosi stock trades and the headline problem
"Pelosi stock" is the most searched phrase on this topic in the United States: Google Trends interest peaked in July 2022 and it still leads every related query. Searches for a "Pelosi tracker" are steady. That attention is understandable, but it creates a headline problem. One member's best trades are not evidence about Congress, and per-trade league tables overstate skill because purchases bunch together in time. The useful question is testable: did a member's purchases beat a fair benchmark, from the day the public could act? FinzData lets readers run that test for any member, using the disclosure date on every row.
Senate vs House vs the President
Senate purchases beat equal weight by 2.8% at one year, a statistically significant result, but the edge builds slowly and the band around it is wide. House purchases sit on zero at every horizon from 30 days to four years. Senator stock trades also look different: larger, and mostly in family accounts. The President's April 2026 purchases fell 3.5% against equal weight between purchase and disclosure. "Trump stock trades" is the fastest-growing search in this group, with 12-month interest about five times its five-year average and a peak in August 2026.
Skill or style? The factor test
We held every disclosed purchase in a live portfolio, bought on its disclosure date and kept for a year, from 2014 to 2026, and removed the effects of the market, company size, value and momentum. Congress's alpha came out at +0.1% a year (t 0.1): zero. The House was −0.3%. The Senate kept +1.8% a year, but with a t-statistic of 1.2 that cannot be told apart from luck. What looks like an edge over the equal-weight index is mostly a steady tilt toward smaller companies.
Democrats vs Republicans
Democrats' purchases beat equal weight by about a point a year (+0.9% at one year, +3.0% at four). Republicans' are flat (−0.1% at one year, −1.6% at two). The gap is style, not skill: Republicans' portfolios lean toward value stocks (a loading of +0.23) and Democrats' do not (−0.01), and value lagged growth for much of this period. After factors, both parties' alpha is about −0.4% a year. By presidential term, the winning side changes: Democrats led under Trump's first term (+2.9% at one year), Republicans lagged under Obama's second (−3.4%), and Republicans lead under Trump's second (+5.2%).
Does copying Congress work?
A copy-trade book buys every disclosed purchase on its disclosure date and holds it for a year. From 2014 to 2026:
| Copy book | CAGR | Volatility | Max drawdown |
|---|---|---|---|
| Senate | 12.5% | 19.3% | −41% |
| S&P 500 | 11.8% | 17.1% | −34% |
| Democrats | 10.2% | 18.6% | −37% |
| House | 9.4% | 18.1% | −39% |
| Equal weight | 9.0% | 17.5% | −40% |
| Republicans | 8.6% | 18.4% | −43% |
The Senate book beat the S&P 500 by 0.7 points a year, but with more volatility and a deeper drawdown, so after risk it is a tie. The trade is also crowded: about $1B of retail money now follows congressional filings, ten times March 2024.
What actually carries a signal
Two filters separate signal from noise. Size: the routine $1,000 to $50,000 purchases, nine in ten trades, show nothing, while purchases of $50,000–100,000 beat equal weight by 2.6% over a year, $100,000–250,000 by 3.7% and $250,000+ by 6.6%. Speed: purchases disclosed within 15 days gained 2.7% (t 5.3), while purchases filed 46–90 days late lost 2.8%. Member by member, 14 of 111 active traders beat equal weight per trade, against about three expected by chance, but after the factor test only three remain significant: Don Beyer, Jerry Moran and Bill Keating. That is roughly what chance alone produces.
The STOCK Act, late filings and the push to ban congress stock trading
Public interest has moved from curiosity to policy. "STOCK Act" searches averaged 55 over the past 12 months against 20 over five years, peaking in March 2026. "Congress stock trading" is running at 2.7 times its five-year average, with "ban congress stock trading" peaking in July 2026 and "congress insider trading" in September 2026. Late filing matters to the debate and to investors: a backtest dated by trade date treats a trade disclosed months later as if it were public on day one.
How to use a congress stock trading tracker properly
- Date every trade by its disclosure, not its trade date. That is the first day anyone could act.
- Benchmark against equal weight as well as the S&P 500, and strip out size, value and momentum before crediting skill.
- Filter: trades of $50,000 and more, filed within 15 days, from members with factor-robust records.
- Keep amendments and late filings, and test across market regimes, not one bull run.
The full 31-slide deck, the point-in-time database and the trade-level data are at finzdata.com/congress.
The deck, slide by slide
1. Capitol Alpha?
Congressional Trades Database · For institutional clients
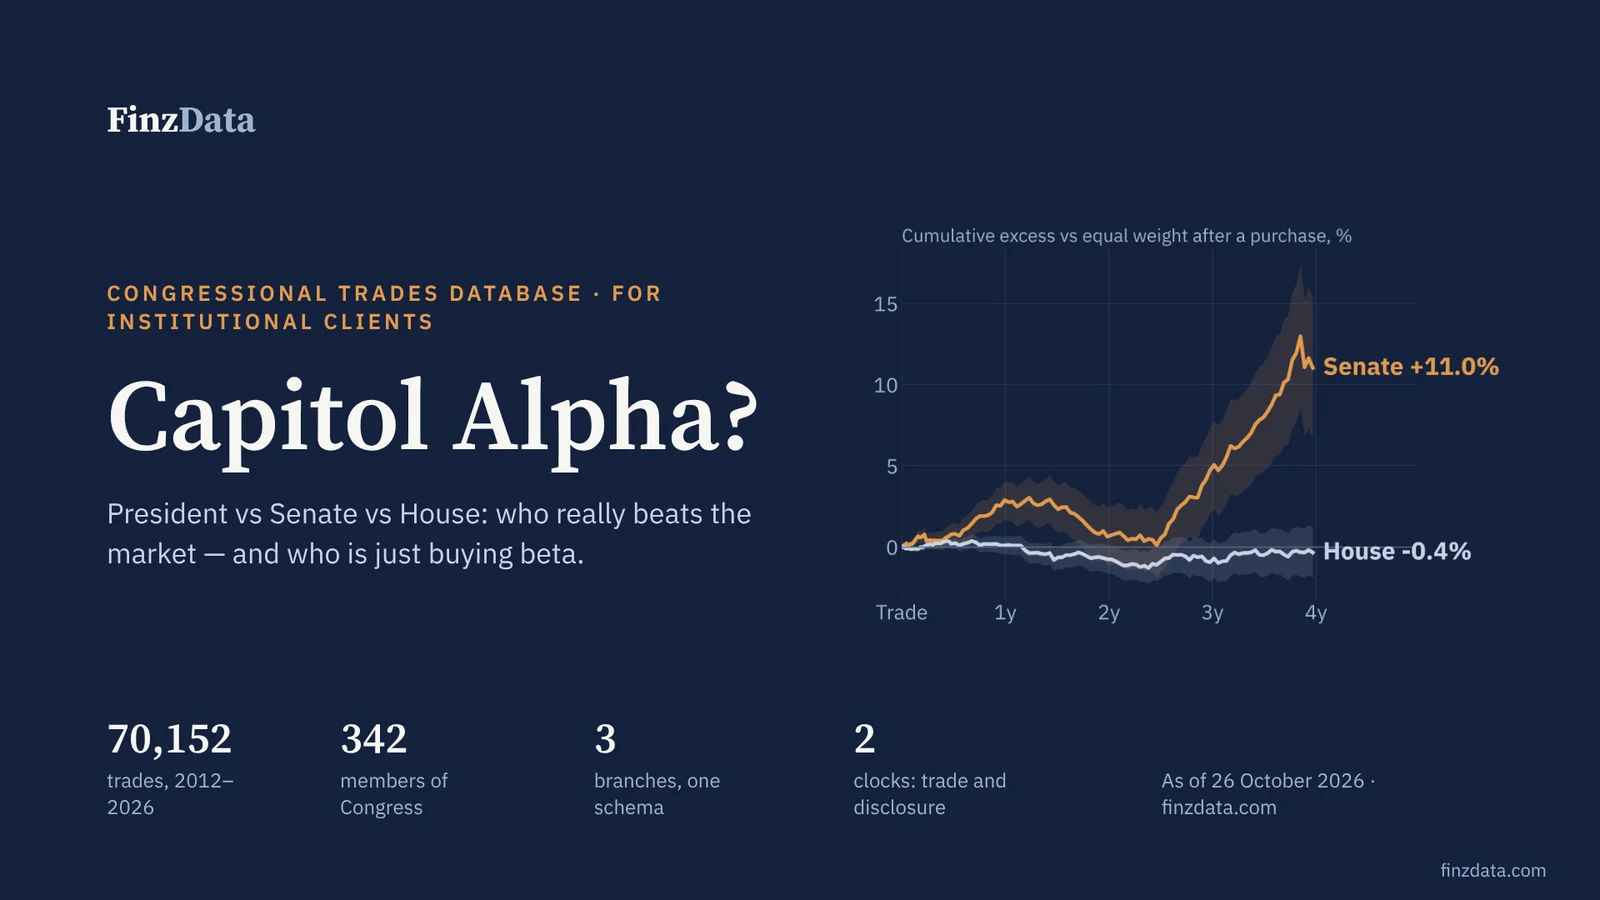
Capitol Alpha? FinzData research on congressional stock trading.
Open with the question in the title: is there alpha in Washington’s trades? Over fourteen years and seventy thousand trades, the answer is: rarely, slowly, and mostly in the Senate — and most of what looks like skill is style. Anyone can tell you what Congress bought. The institutional question is what you could have known, and on which day. That is what this database is built around: a point-in-time timestamp on every row.
2. Two ways to read a congressional trade
The framing
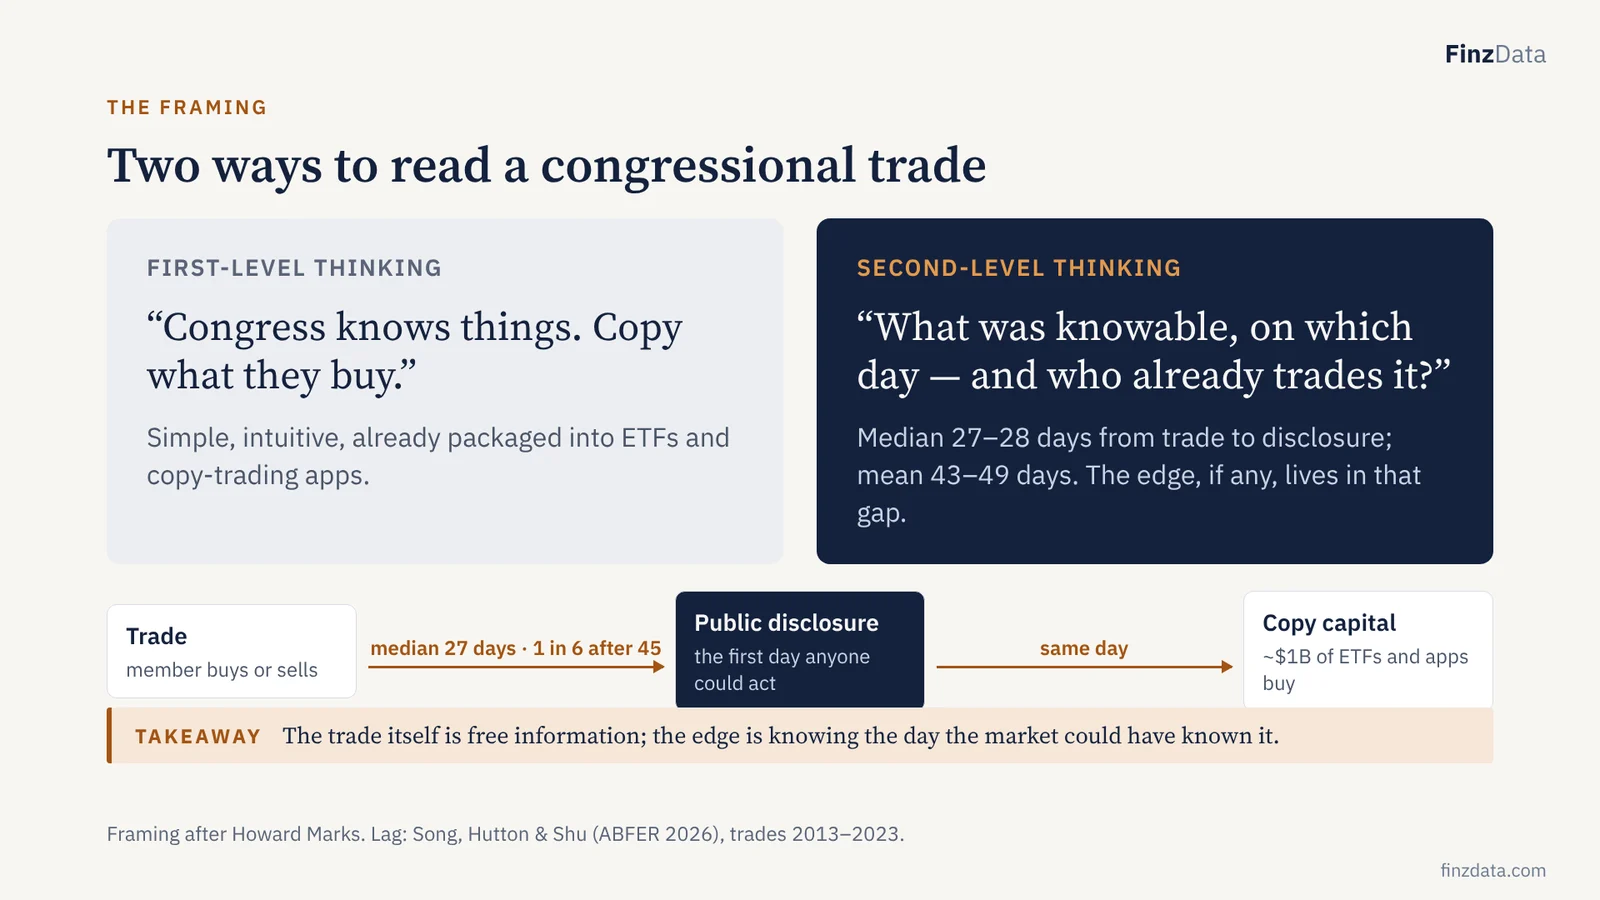
Takeaway: The trade itself is free information; the edge is knowing the day the market could have known it.
Howard Marks’ distinction. First-level thinking is the headline everyone already has. Second-level thinking asks what was actually knowable and tradable, and what is already priced by the crowd. The disclosure lag is the whole game: a typical trade becomes public about four weeks after it happened.
3. The copy trade is already crowded
First level
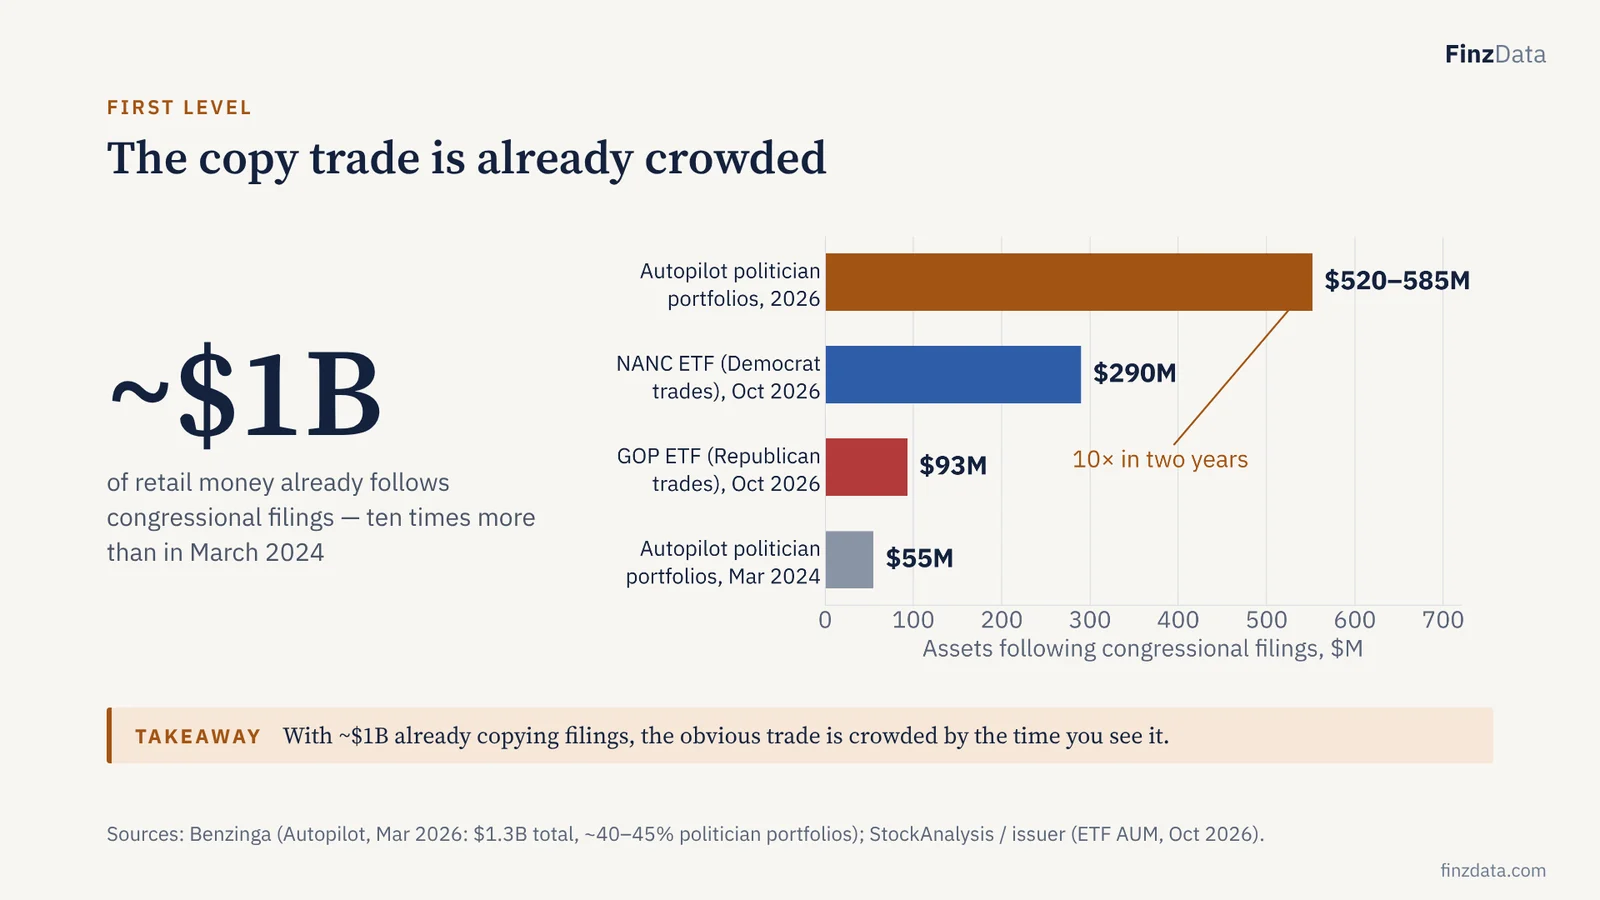
Takeaway: With ~$1B already copying filings, the obvious trade is crowded by the time you see it.
Roughly a billion dollars of retail capital already mirrors congressional disclosures, ten times more than two years ago. When that much money buys the same disclosed names on the same day, the disclosure itself becomes the event — which is a second-level signal in its own right.
4. Copy-Congress returns are mostly style beta
First level
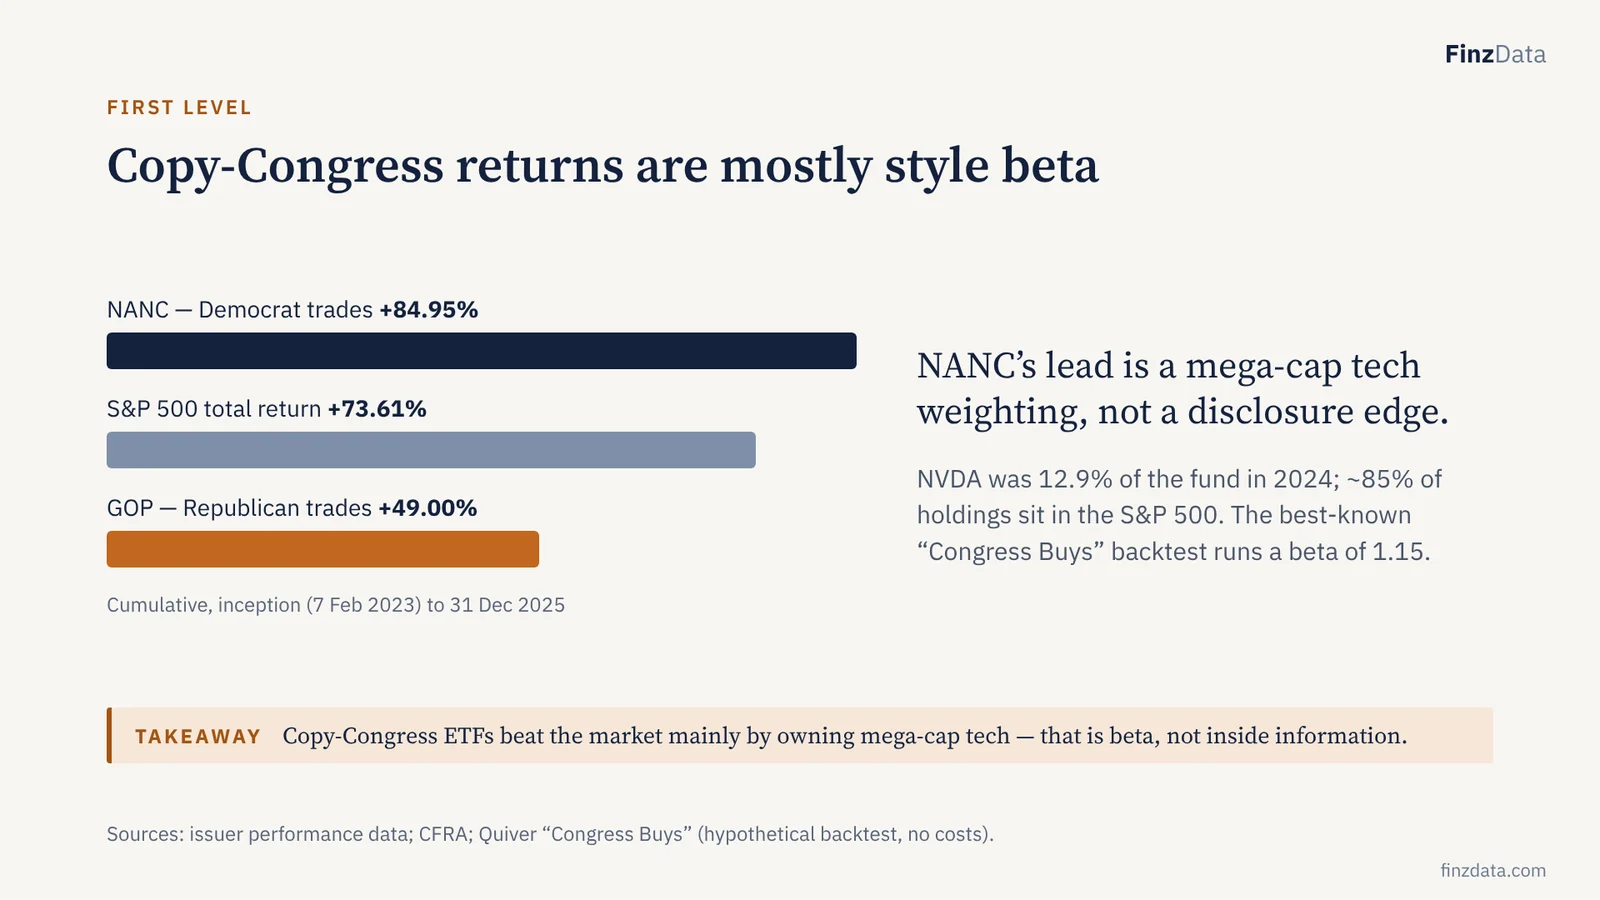
Takeaway: Copy-Congress ETFs beat the market mainly by owning mega-cap tech — that is beta, not inside information.
The party split behaves like growth versus value. Strip out sector and size and the copy trade looks like a tech tilt with a fee. A buyer who wants real alpha needs to separate the style exposure from any information content — which requires point-in-time data and disclosure-date returns.
5. The average member has no edge — and our fourteen years agree
Second level · the evidence
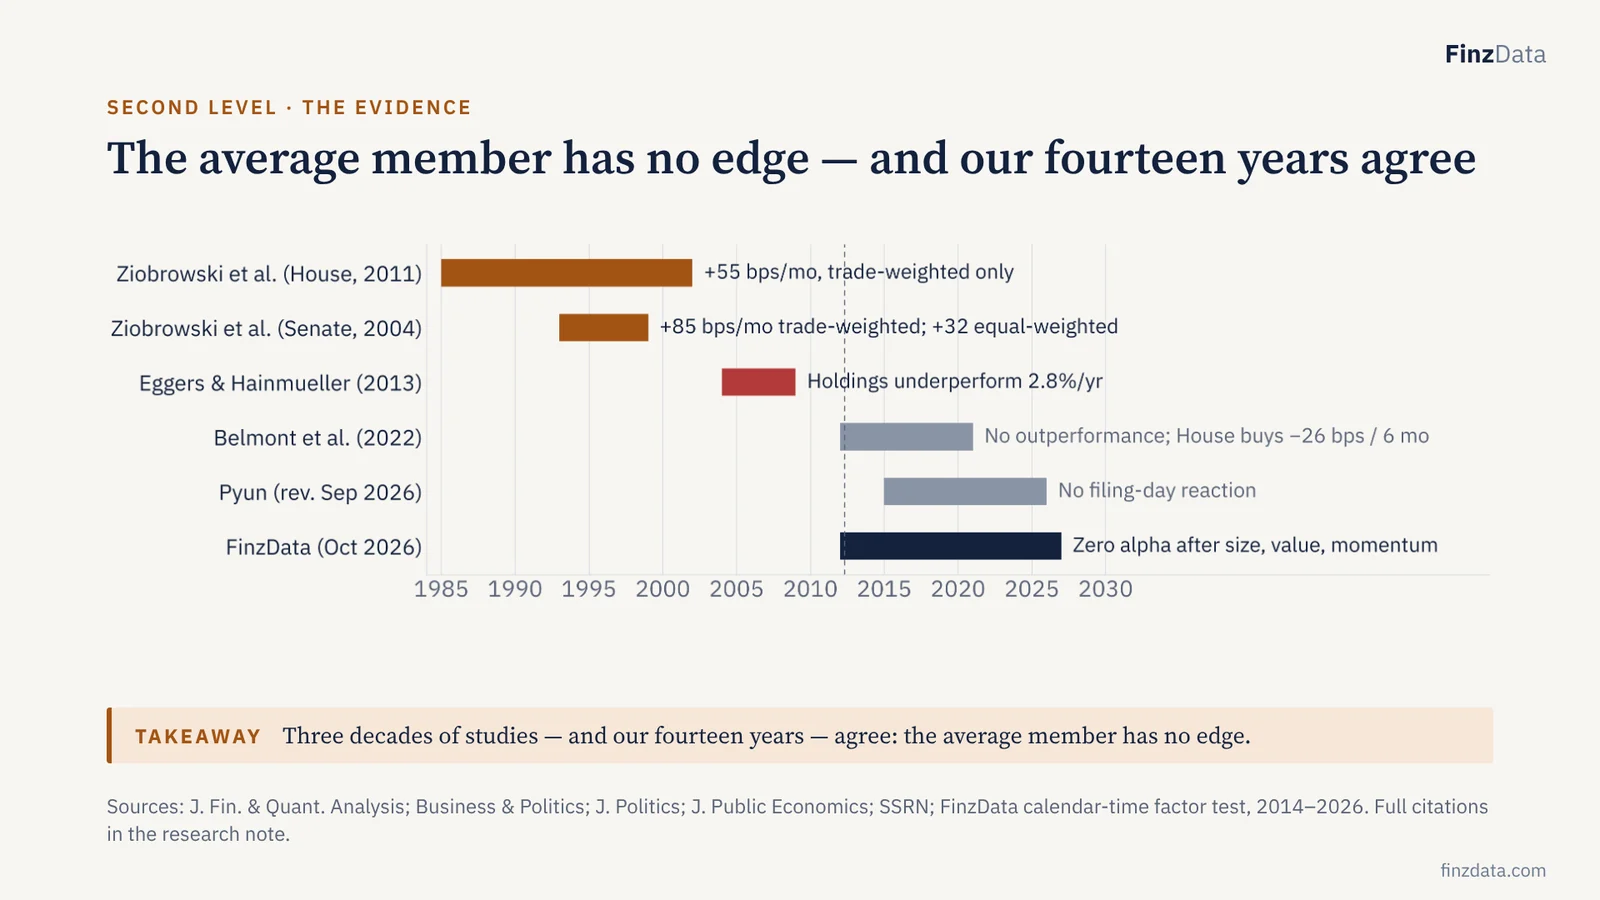
Takeaway: Three decades of studies — and our fourteen years — agree: the average member has no edge.
The early studies were trade-weighted, and four senators made almost half the Senate trades. Equal-weight them and the edge shrinks or vanishes. Since the STOCK Act, the broad samples show nothing — and our own fourteen-year test, with factors removed, finds zero alpha for Congress as a whole. So Congress as a whole is not the signal. That is exactly why a buyer needs the granular, member-level, point-in-time record.
6. The edge lives in power, not in Congress
Second level · the evidence
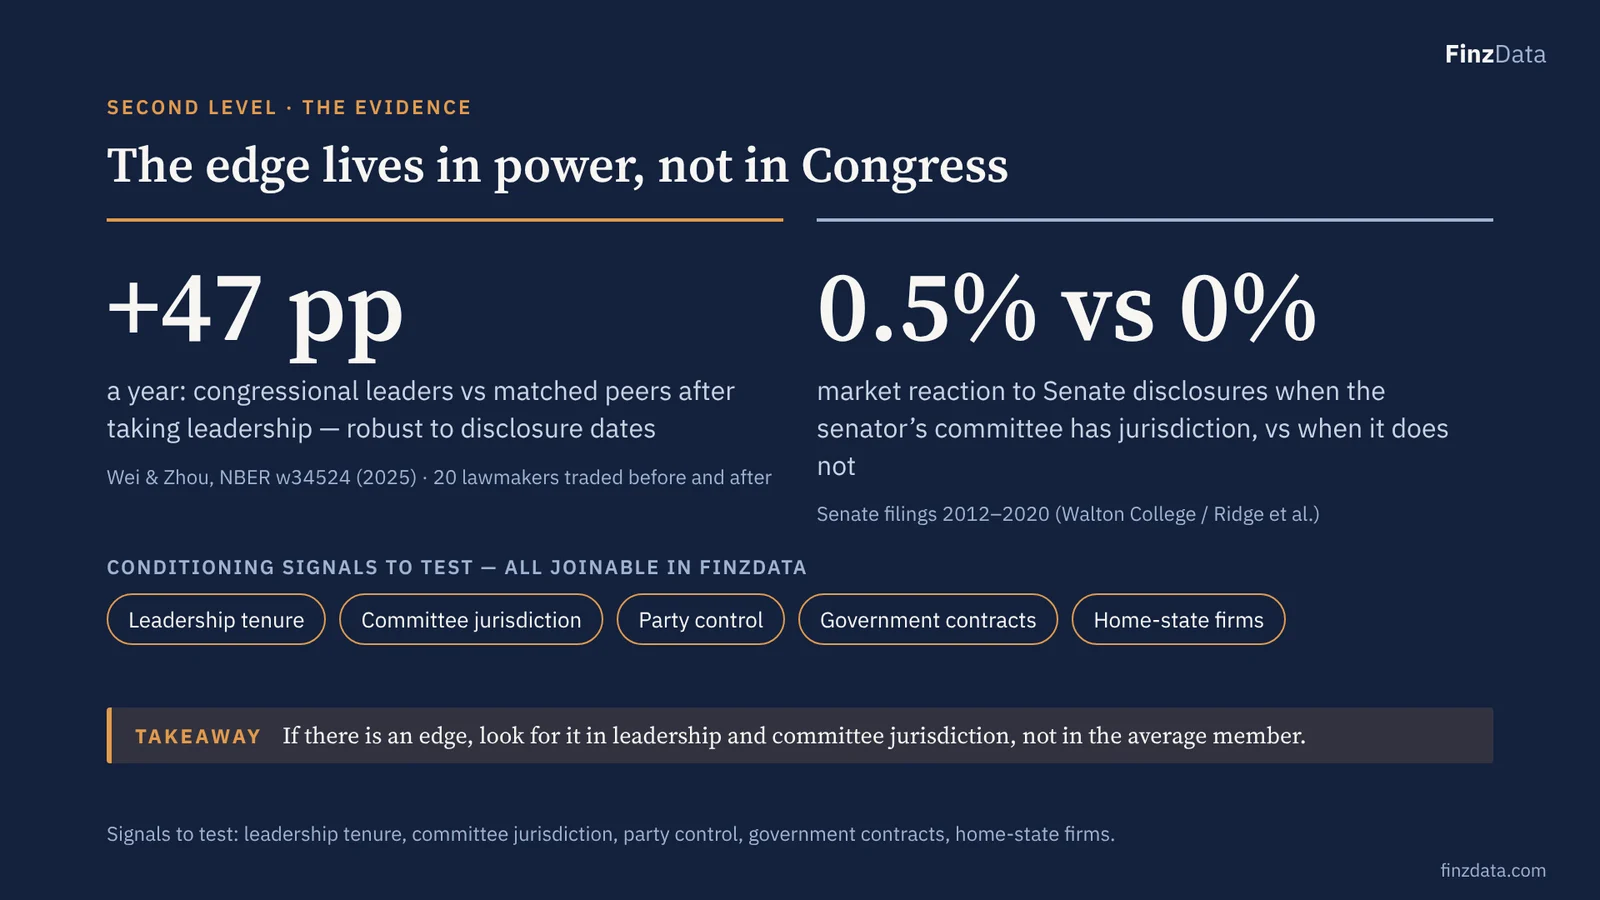
Takeaway: If there is an edge, look for it in leadership and committee jurisdiction, not in the average member.
This is the second-level finding. The signal is conditional: leaders, and committee members trading within their jurisdiction. Those conditions are joins — member identity, committee assignments, tenure — on top of a point-in-time trade record. Note the leadership result rests on a small sample; buyers should test it themselves, which is what the database lets them do.
7. Trade date or disclosure date? Test it yourself
Second level · the evidence
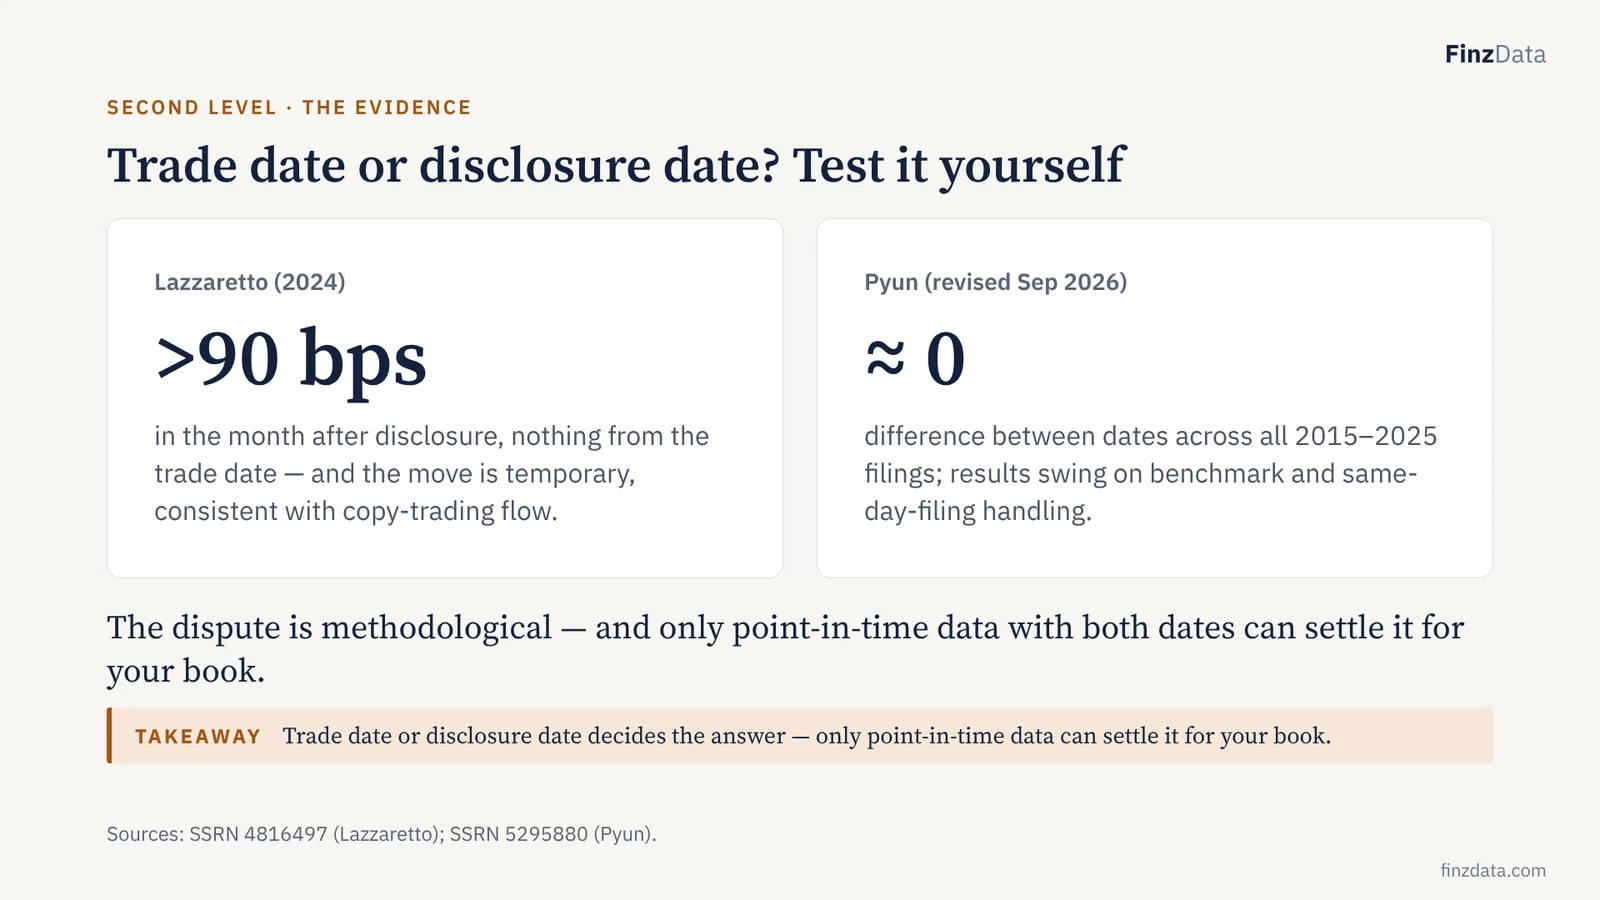
Takeaway: Trade date or disclosure date decides the answer — only point-in-time data can settle it for your book.
Two careful papers disagree. Lazzaretto finds a post-disclosure drift that looks like copy-trading pressure, not insider information. Pyun finds no difference once the benchmark and same-day filings are handled carefully. For an institution, the answer depends on its own universe, costs and timing — so the asset is the clean record with both dates on every row.
8. President vs Senate vs House: no branch beats the S&P 500; only the Senate beats equal weight
Who is the better investor? · 24,722 purchases, 2012–2026
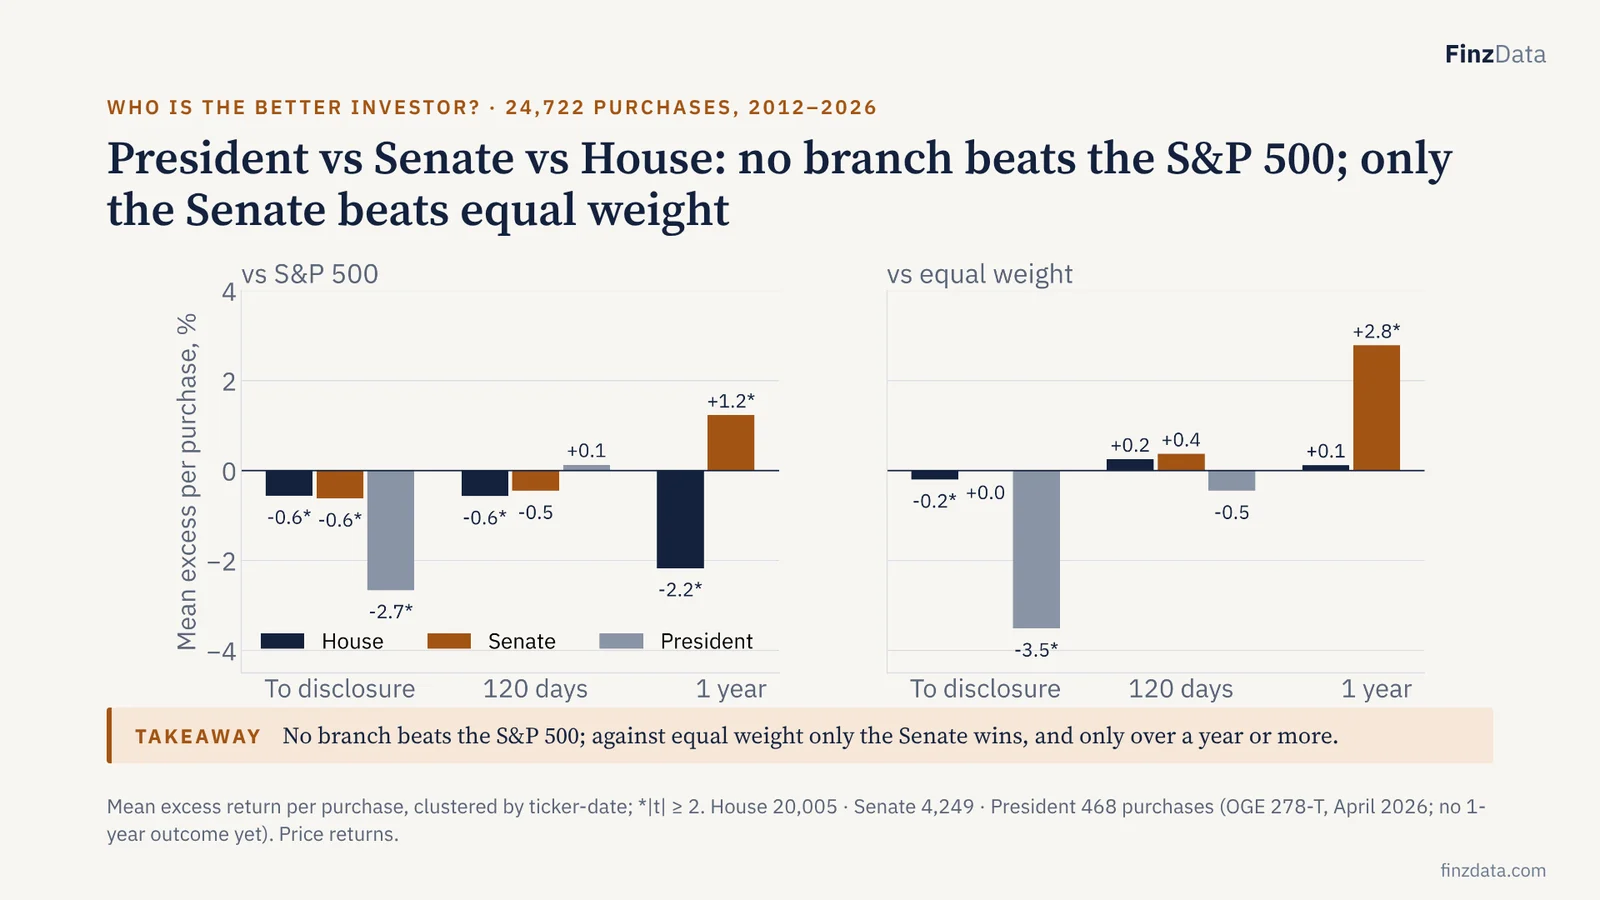
Takeaway: No branch beats the S&P 500; against equal weight only the Senate wins, and only over a year or more.
The scoreboard on the full history. Against the S&P 500, every branch is behind at disclosure and the House is behind at a year, minus 2.2 percent. Against the equal-weight index — the fair benchmark for a stock picker — the House is flat and the Senate is ahead by 2.8 percent at a year. The President’s purchases lost 2.7 percent against the S&P 500 and 3.5 against equal weight before the public saw them.
9. “Genius sells, terrible buys” — until you change the benchmark
Second level · the benchmark trap
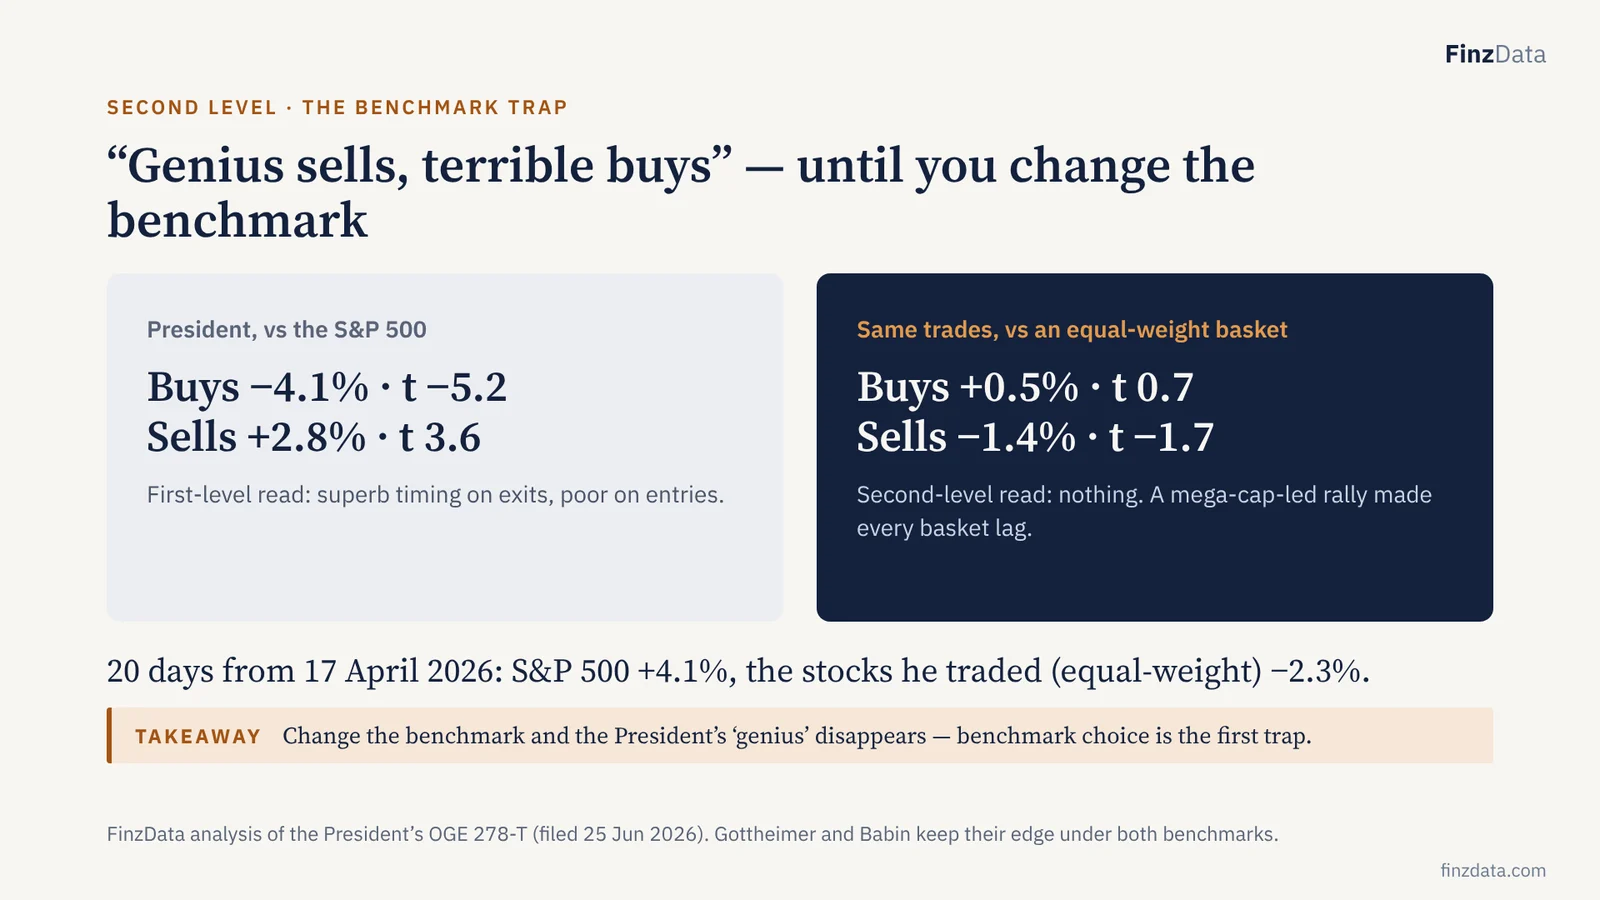
Takeaway: Change the benchmark and the President’s ‘genius’ disappears — benchmark choice is the first trap.
This is the slide that shows why second-level thinking matters. Against a cap-weighted index, the President’s sells look brilliant and his buys look terrible — both significant. Re-run against an equal-weighted basket of the same stocks and both effects vanish. April 2026 was a mega-cap-led rally: the index rose 4 percent while the typical stock fell 2 percent, so anything that is not mega-cap tech looks like bad buys and good sells. Any provider who benchmarks congressional or presidential trades only against SPY will hand you this artifact as alpha. FinzData publishes both benchmarks.
10. Against the index everyone loses; against equal weight only the Senate wins — slowly
Across time · 24,722 purchases, 2012–2026
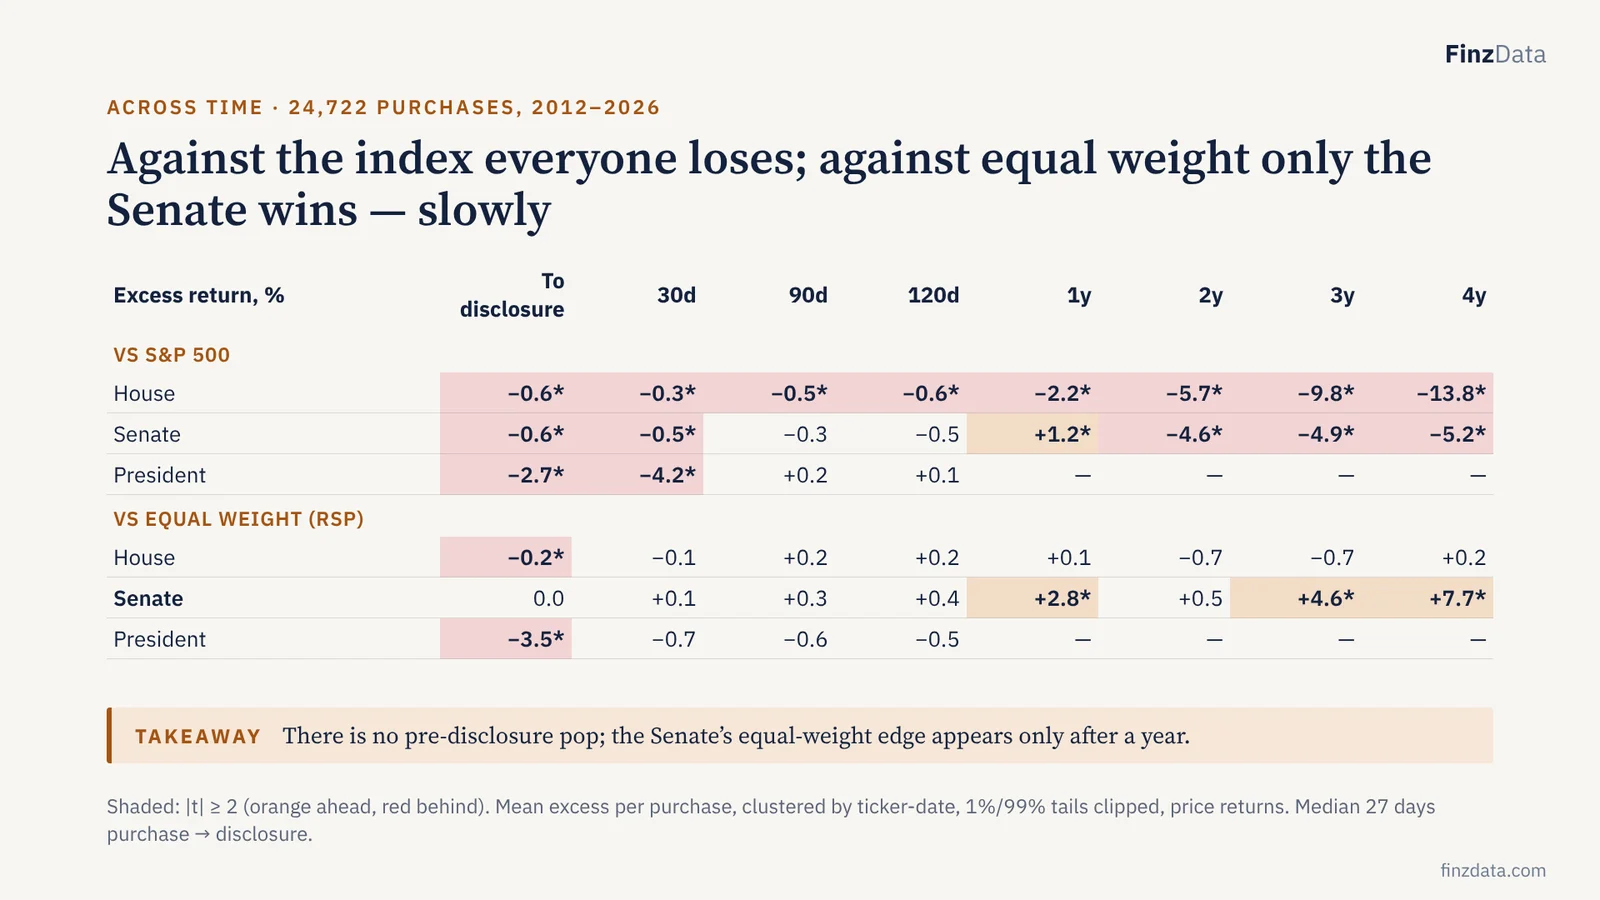
Takeaway: There is no pre-disclosure pop; the Senate’s equal-weight edge appears only after a year.
Every purchase since 2012, measured at every horizon from the trade to four years out. Against the cap-weighted S&P 500, Congress loses, and the House loses badly — almost fourteen points over four years. Against the equal-weight index, the House is flat and the Senate wins, but slowly: nothing before disclosure, then 2.8 percent at a year and 7.7 at four. The President’s April 2026 purchases lost 3.5 percent between trade and disclosure.
11. The Senate’s edge builds over years; the House never leaves zero
Event study · cumulative excess vs equal weight
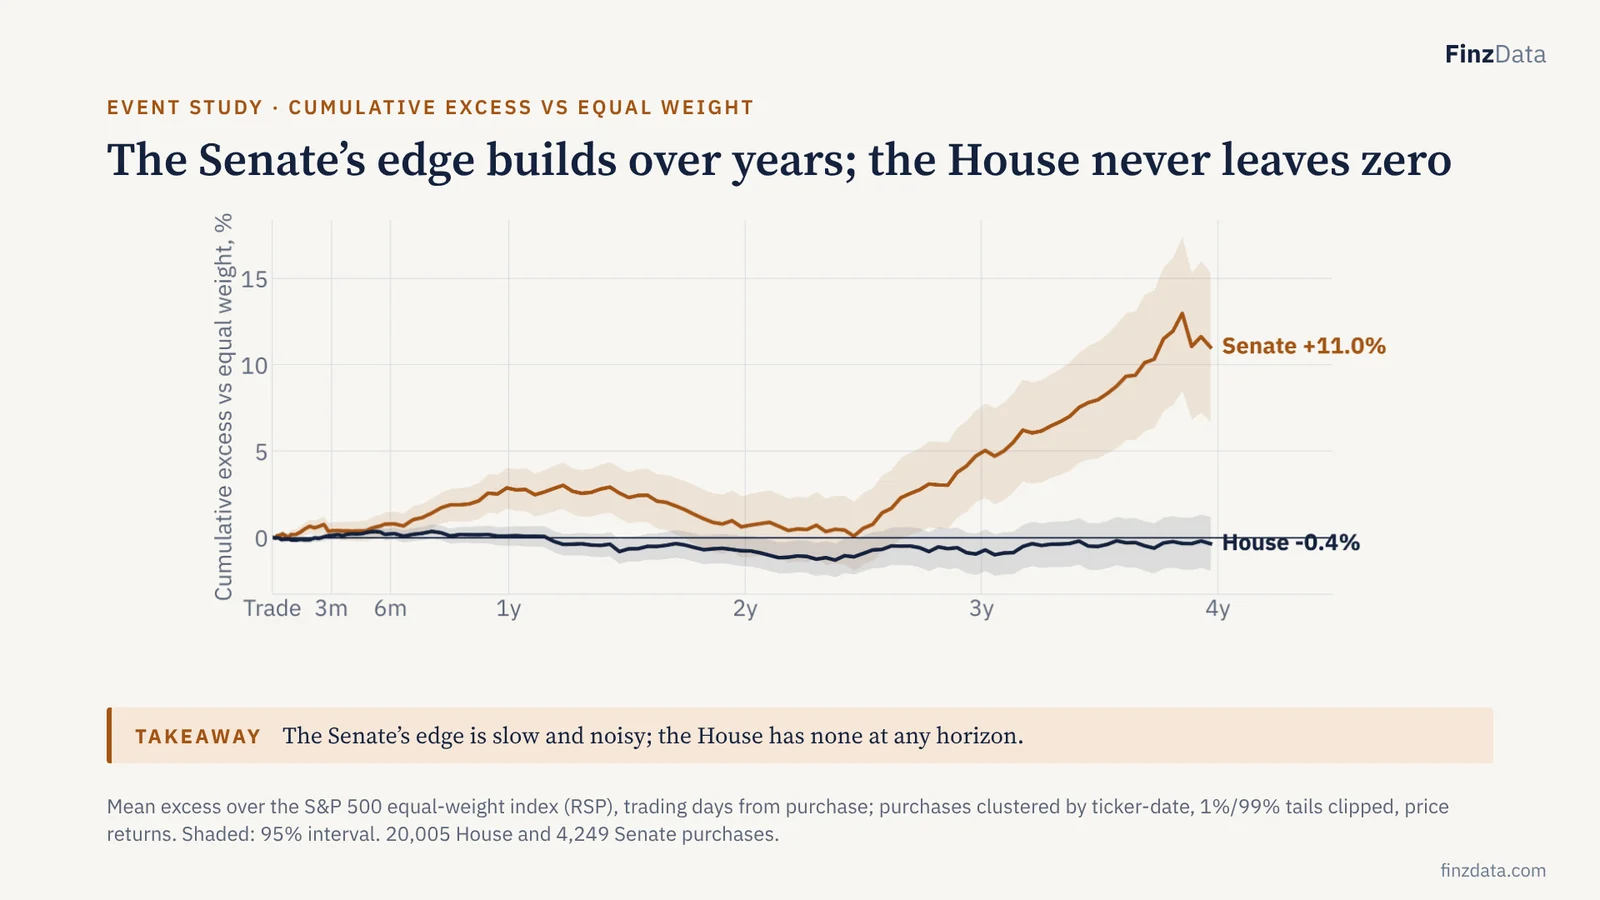
Takeaway: The Senate’s edge is slow and noisy; the House has none at any horizon.
This is the whole time path, day by day, for every purchase since 2012. The House line sits on zero for four years: no edge at any horizon. The Senate line drifts up slowly — about 3 percent by one year, 11 percent by four — but the band is wide, and there is no jump before disclosure. Whatever senators know, it pays over years, not weeks.
12. Strip out size and value, and Congress’s alpha is zero
Skill or style? · calendar-time factor test
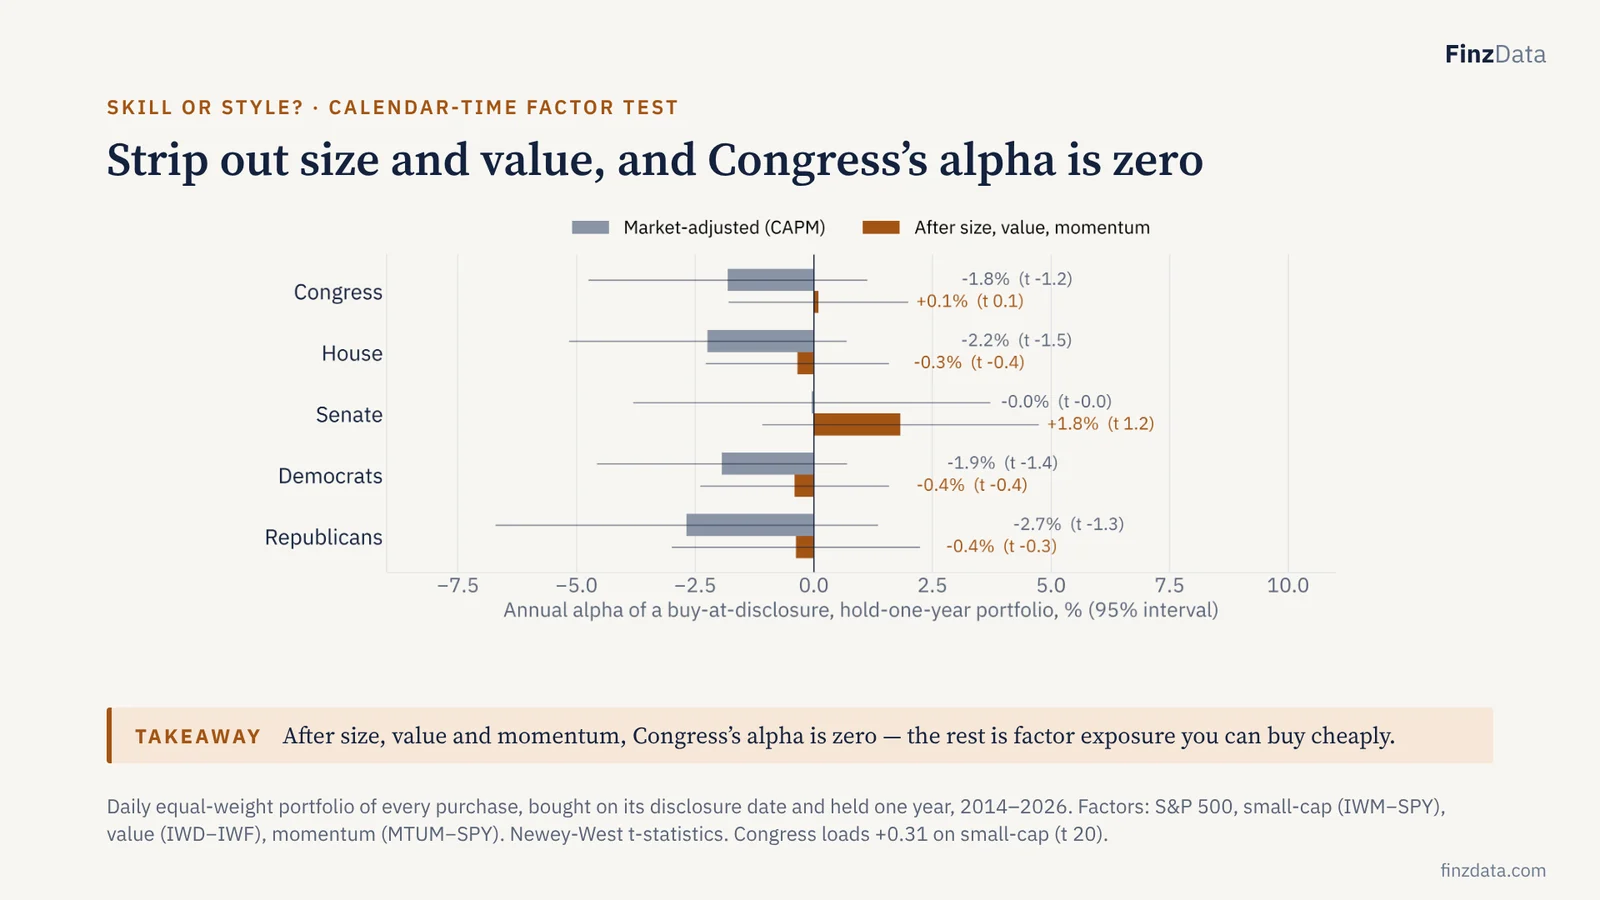
Takeaway: After size, value and momentum, Congress’s alpha is zero — the rest is factor exposure you can buy cheaply.
This is the test institutional allocators should ask for. We hold every disclosed purchase in a live portfolio and regress its daily returns on market, size, value and momentum. After those four factors, Congress as a whole has zero alpha: what looked like an edge over the equal-weight index is a steady small-cap and value tilt. The Senate keeps about 1.8 percent a year, but with a t of 1.2 it is not distinguishable from luck. Event-study t-statistics overstate significance because purchases cluster in time; the calendar-time portfolio is the honest benchmark.
13. Copying the Senate beat the S&P 500 by 0.7 points a year — at higher risk
What a client could actually earn · 2014–2026
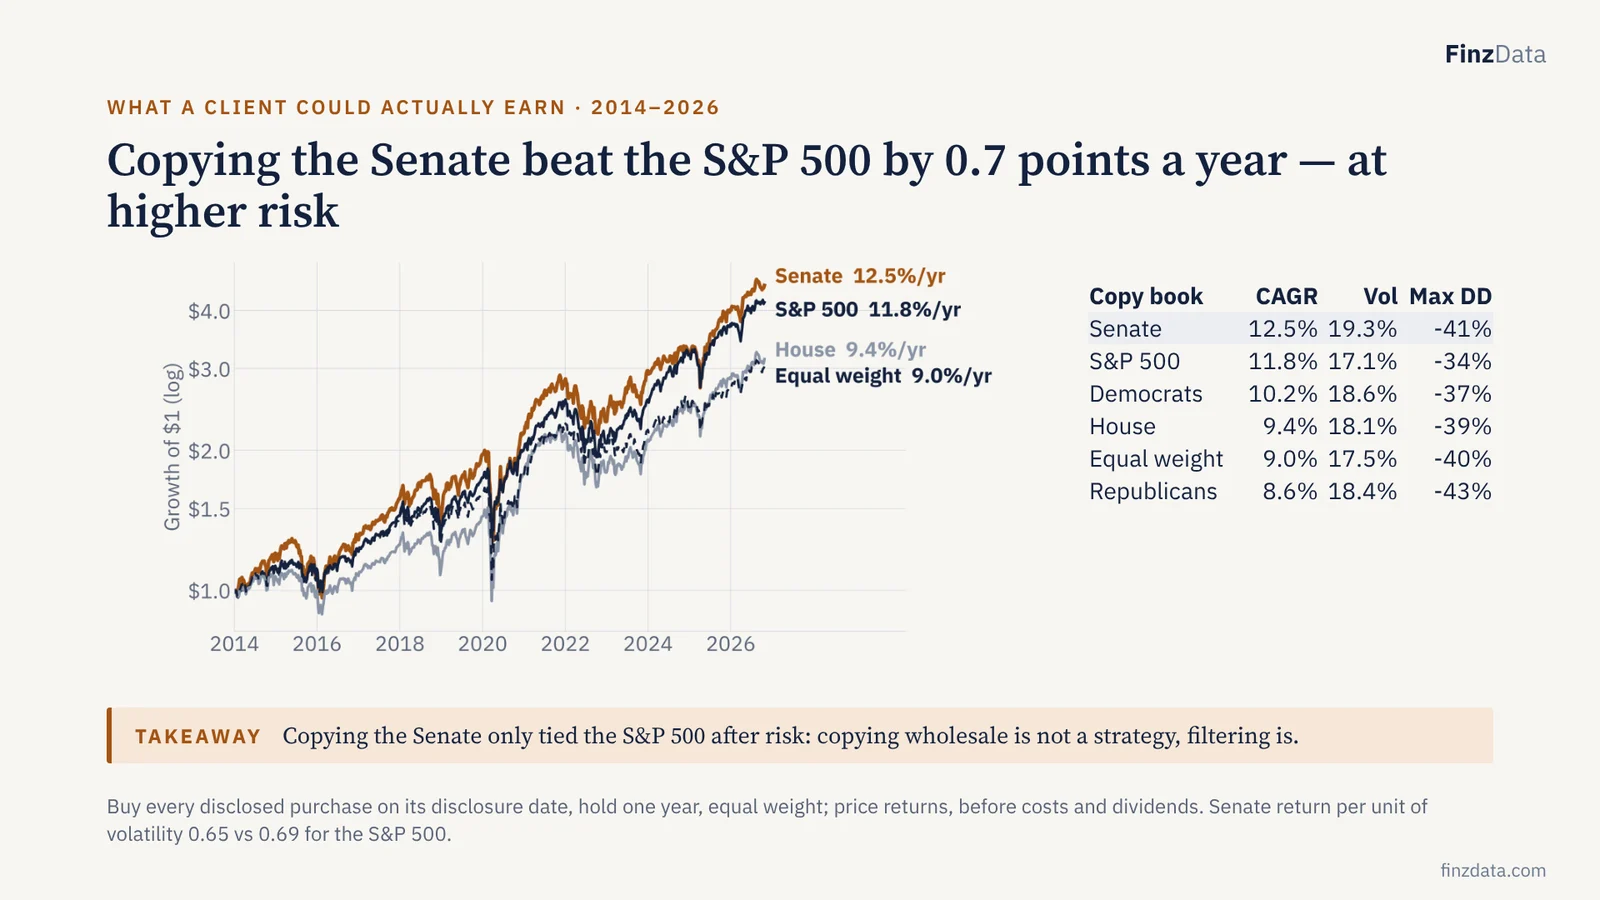
Takeaway: Copying the Senate only tied the S&P 500 after risk: copying wholesale is not a strategy, filtering is.
The investable version: buy each purchase the day it is disclosed and hold a year. Since 2014 a Senate copy book compounded at 12.5 percent a year against 11.8 for the S&P 500 — but with more volatility and a deeper drawdown, so risk-adjusted it is a tie. The House book trails the index by more than two points a year, in line with the equal-weight index it resembles. Copying Congress wholesale is a small-cap fund with extra turnover; the value is in the filters on the next slides.
14. Democrats edge Republicans — by about a point a year, not ten
Republicans vs Democrats · vs equal weight
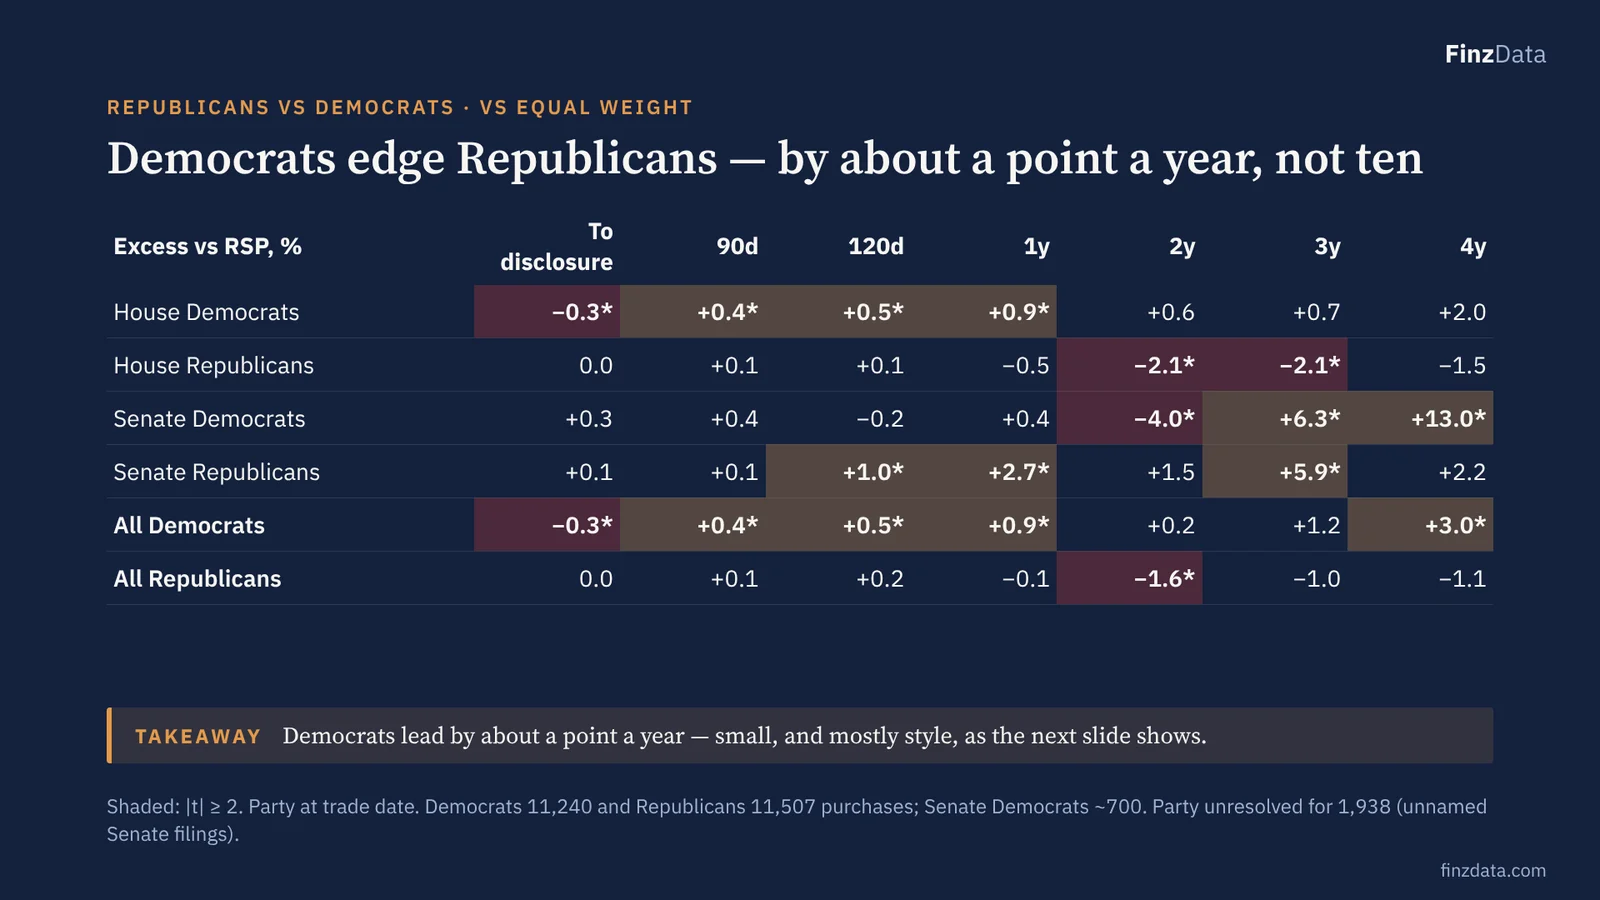
Takeaway: Democrats lead by about a point a year — small, and mostly style, as the next slide shows.
Republicans versus Democrats against the equal-weight index. Democrats come out ahead, but by about a point a year — significant from 90 days to one year and plus 3 percent at four. Republicans are flat or slightly behind, with House Republicans about two points behind at two years. Two Senate exceptions: Senate Republicans gain 2.7 percent at a year, and the small Senate Democrat book compounds to 13 percent at four years. The next slide shows why the gap exists.
15. The party gap is value versus growth, not stock picking
Republicans vs Democrats · why the gap exists
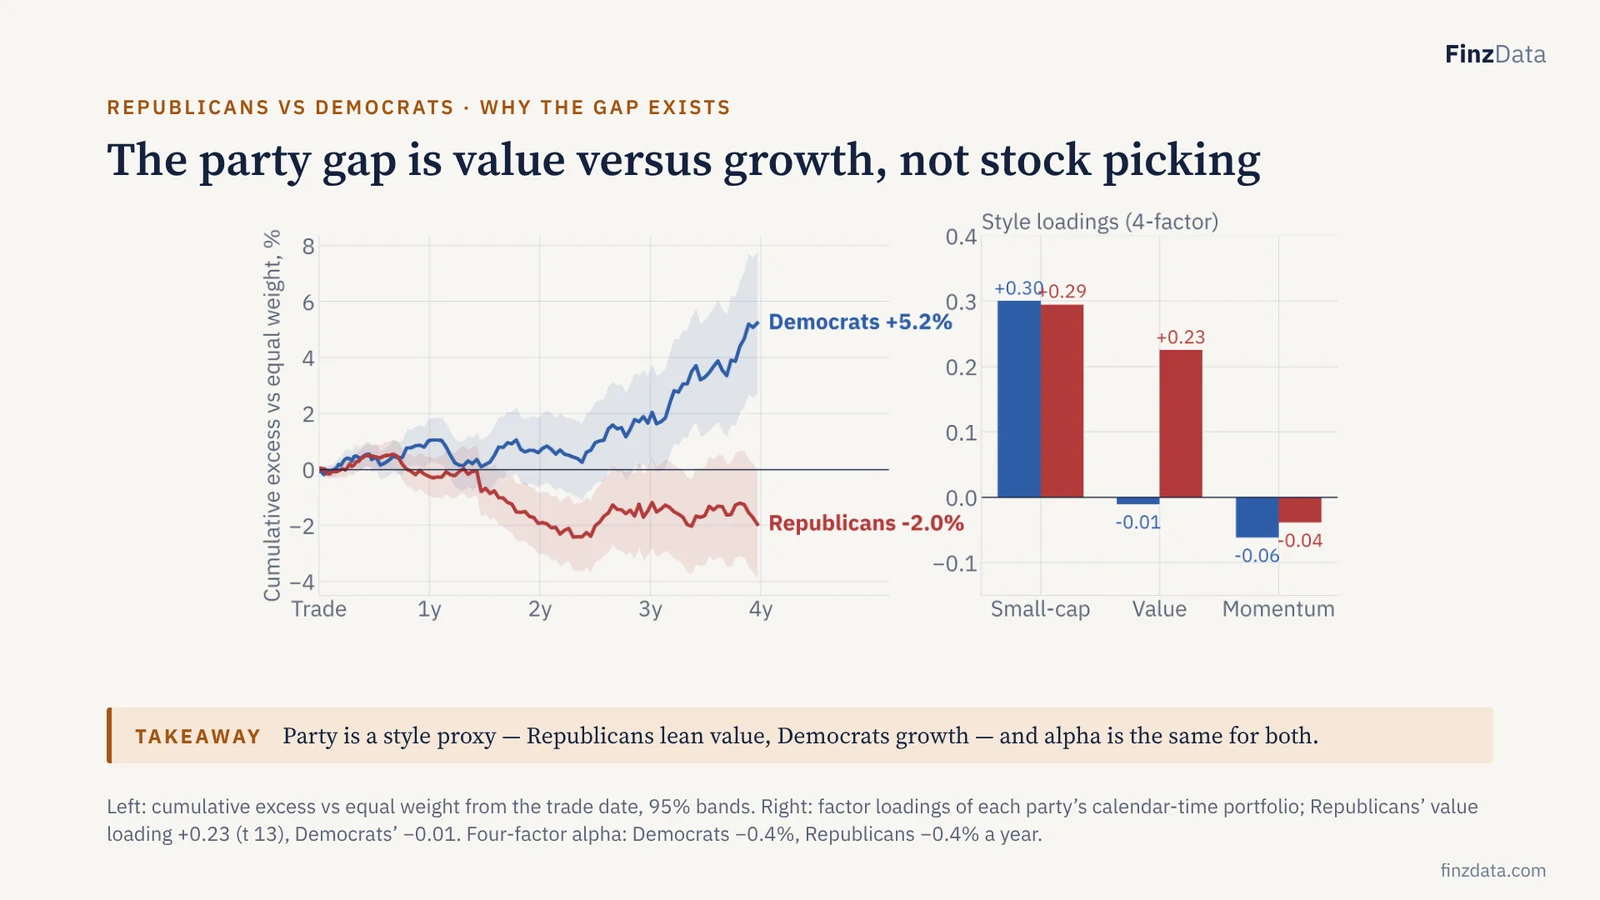
Takeaway: Party is a style proxy — Republicans lean value, Democrats growth — and alpha is the same for both.
Democrats’ purchases drift ahead over four years and Republicans’ drift behind, a gap of about seven points. The right panel explains it. Both parties buy smaller companies than the index, equally. But Republicans tilt firmly to value stocks and Democrats do not — and value lagged growth for most of this decade. Once style is removed, both parties’ alpha is the same, about minus 0.4 percent a year. The party label is a style signal, not a skill signal.
16. No party owns the edge — the winning side changes with the term
Every presidential term · vs equal weight
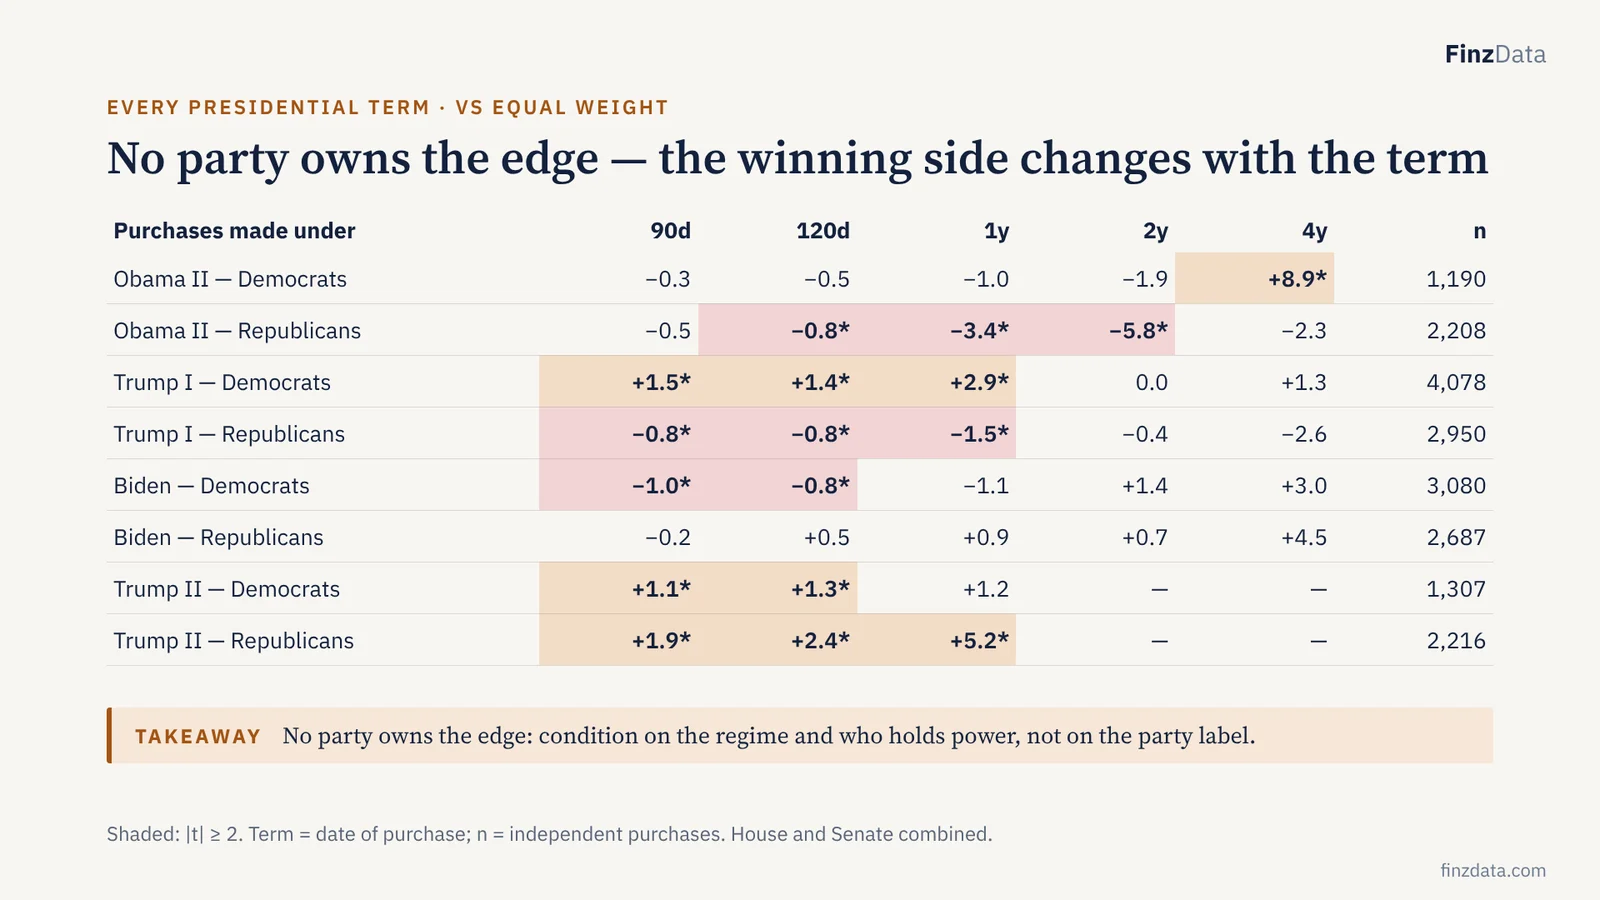
Takeaway: No party owns the edge: condition on the regime and who holds power, not on the party label.
Grouping purchases by the presidential term in which they were made. There is no permanent party edge. Under Trump’s first term, Democrats bought better, about 3 points ahead at a year while Republicans lagged. Under Obama’s second term, Republicans lagged badly — over 5 points at two years. Under Biden, neither side stood out at a year. Under Trump’s second term it flips: Republicans’ purchases lead, plus 5.2 percent at a year.
17. Edges come and go with the cycle — no side wins every term
Every presidential term and every purchase year
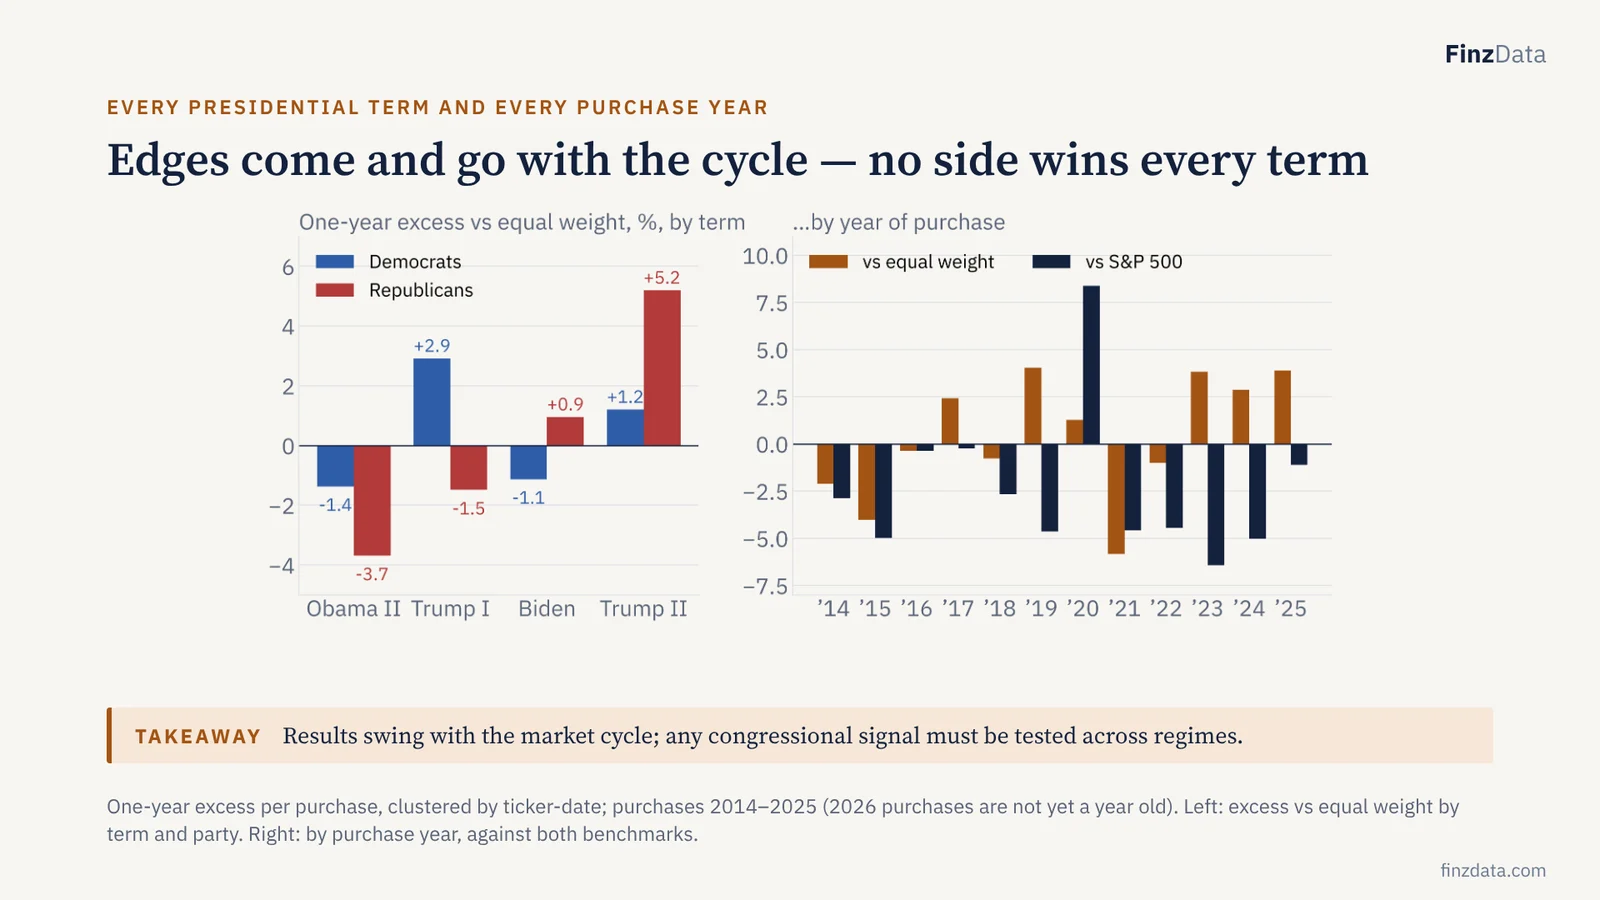
Takeaway: Results swing with the market cycle; any congressional signal must be tested across regimes.
By term, the winning side flips: Democrats under Trump’s first term, Republicans under Trump’s second — plus 5.2 percent at a year. By year, Congress beat the equal-weight index in 2017, 2019 and 2023 to 2025 and lost badly on 2021 purchases, minus 5.8 percent, the year speculative stocks peaked. Against the S&P 500, Congress lost in every year but 2020. A durable signal has to be conditioned on regime, not party.
18. Big tickets and fast filers: the two filters that matter
Where the signal concentrates
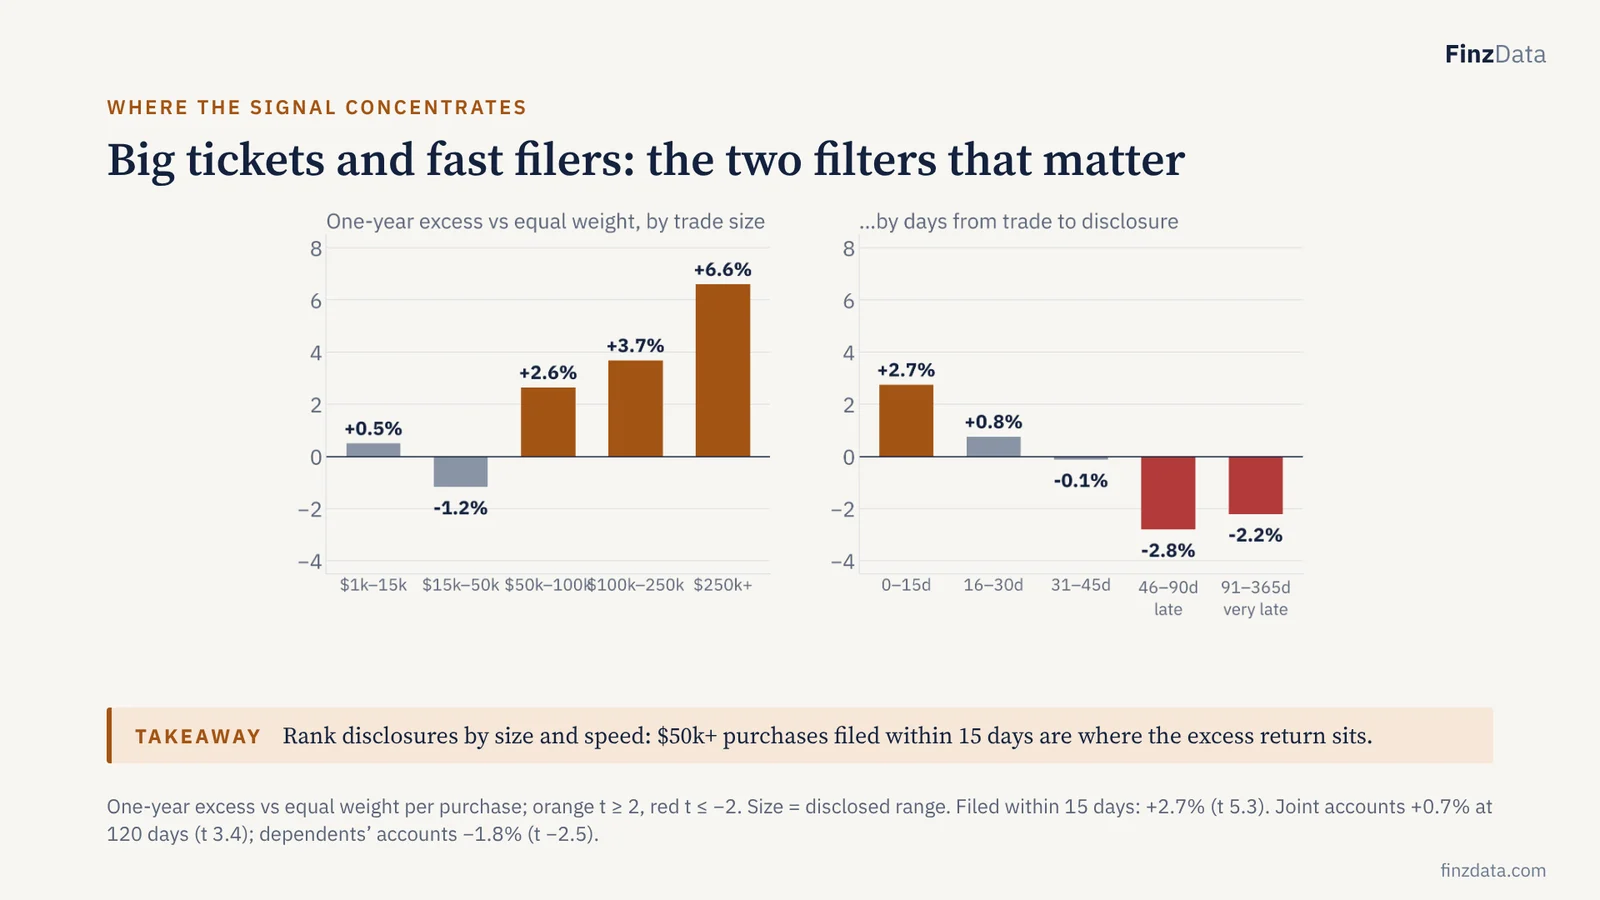
Takeaway: Rank disclosures by size and speed: $50k+ purchases filed within 15 days are where the excess return sits.
Two filters separate signal from noise. Size: the routine $1,000 to $50,000 purchases that make up nine in ten trades show nothing, while purchases of $50,000 and up beat equal weight by 2.6 to 6.6 percent over a year. Speed: purchases disclosed within 15 days gain 2.7 percent, while late filings — after the 45-day deadline — lose 2 to 3 percent. Late filing is not hiding winners. A product that ranks disclosures by size and filing speed is more useful than one that copies everything.
19. 14 members beat equal weight per trade — but only 3 survive a factor test
Member track records · full history 2012–2026
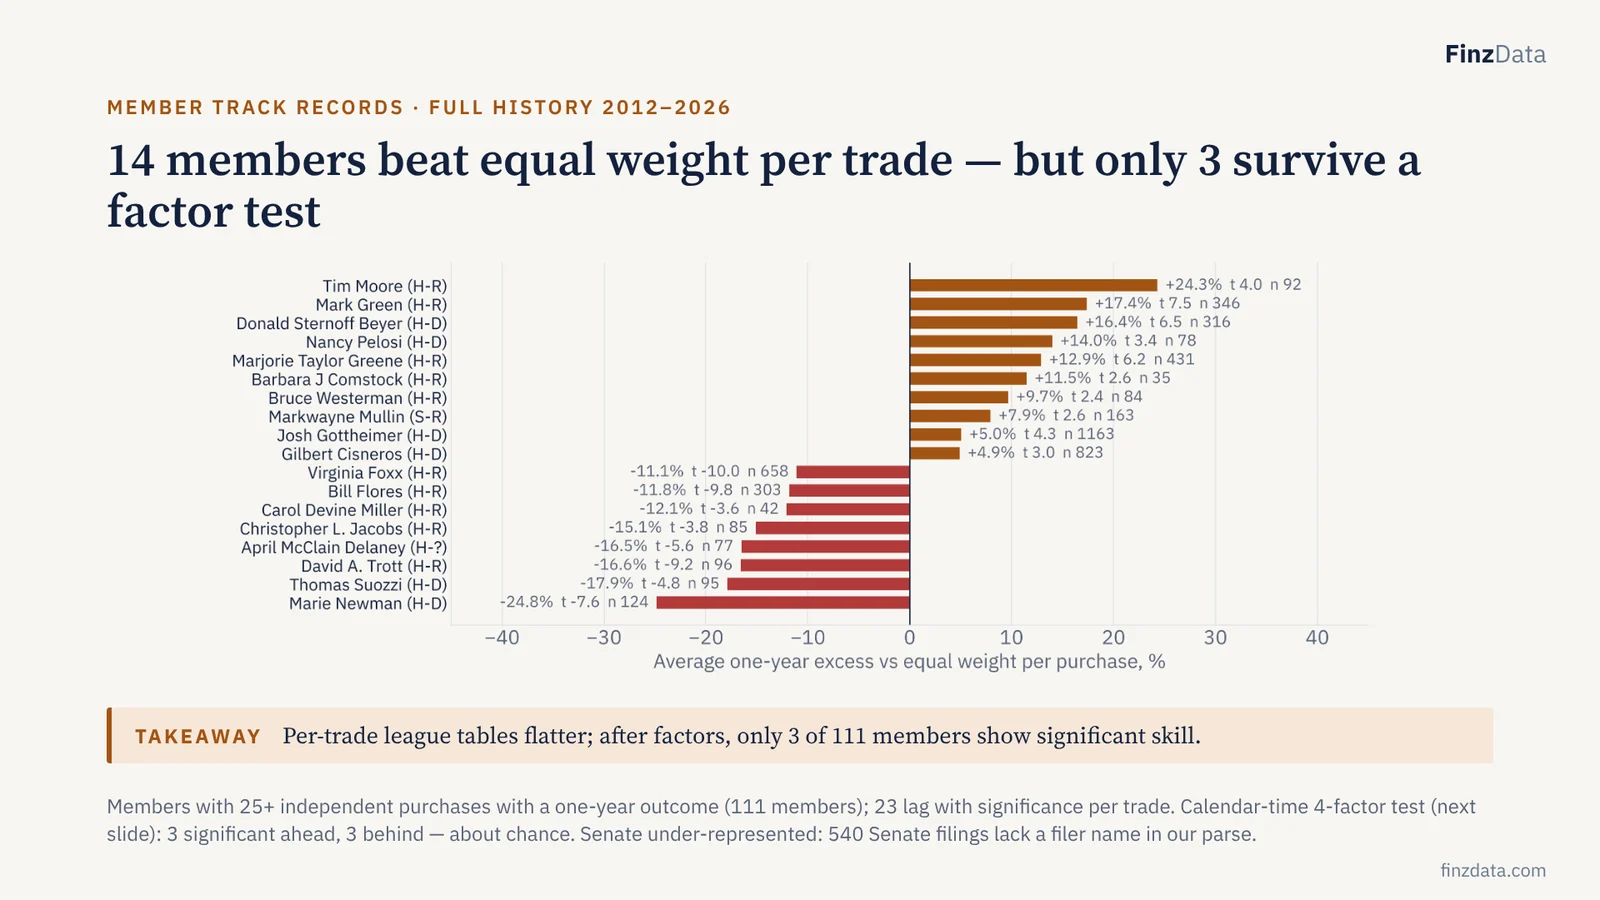
Takeaway: Per-trade league tables flatter; after factors, only 3 of 111 members show significant skill.
Member by member, over the full history. Per trade, fourteen members beat the equal-weight index with statistical significance, where chance would give about three. But look at the dates: the biggest winners, Mark Green, Don Beyer and Marjorie Taylor Greene, did most of their buying in the 2020 to 2021 rebound, when small speculative stocks soared, and purchases bunch together in time, which inflates per-trade t-statistics. Hold each member’s purchases as a portfolio and remove size, value and momentum, and only three remain significant — Beyer, Jerry Moran and Bill Keating. On the other side, Virginia Foxx lagged consistently for a decade under both tests.
20. Most of Washington is buying beta
Alpha investors vs beta investors · 111 members
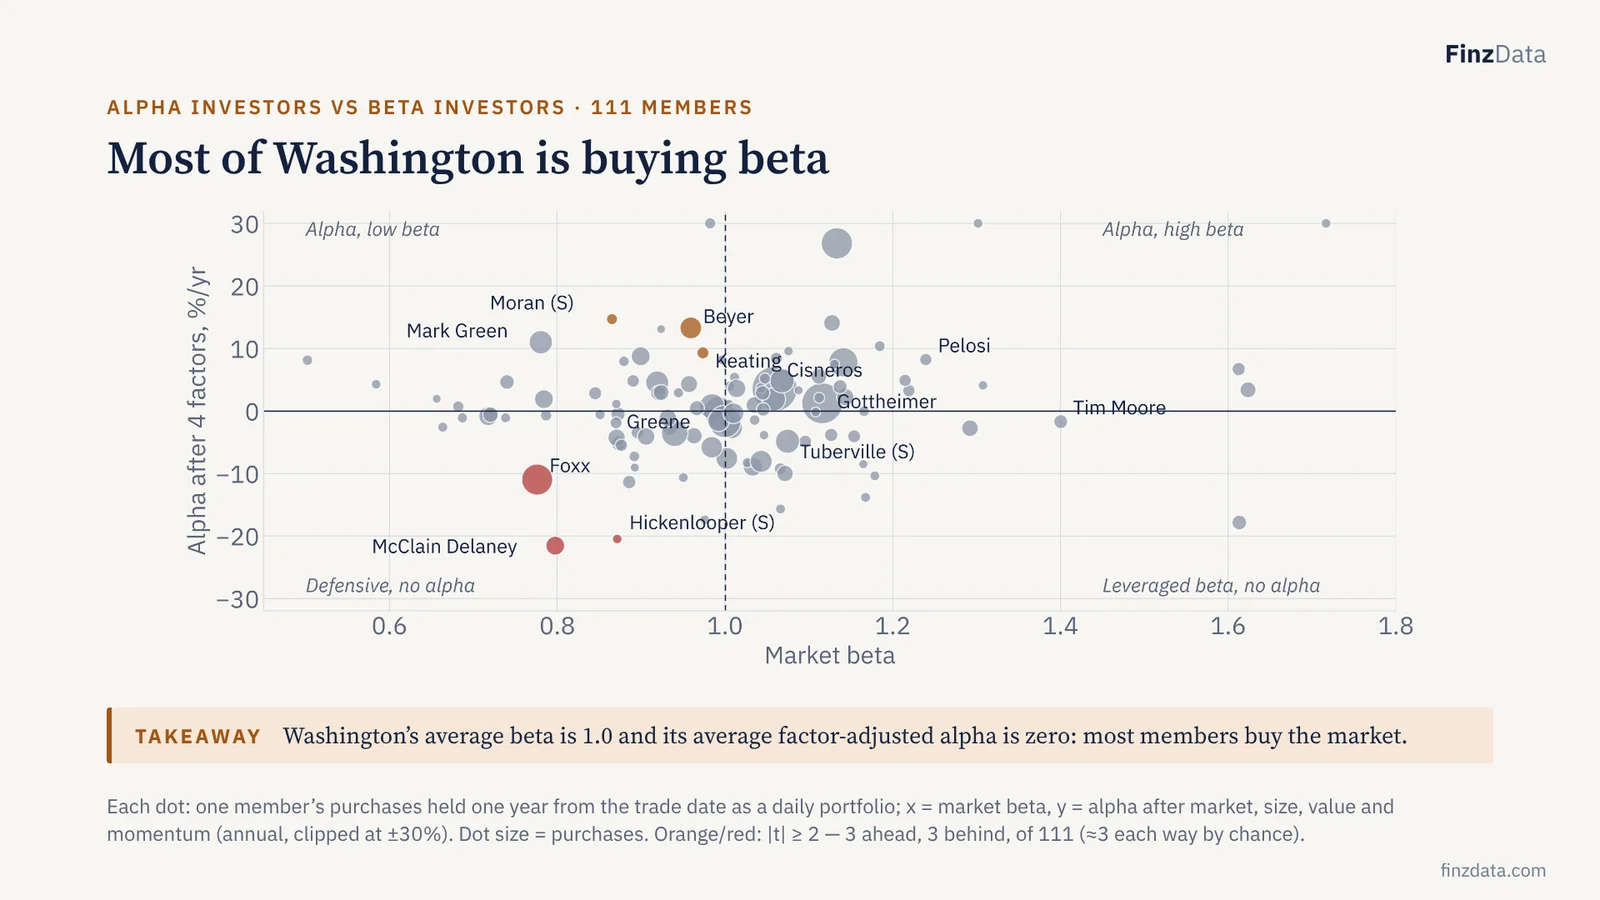
Takeaway: Washington’s average beta is 1.0 and its average factor-adjusted alpha is zero: most members buy the market.
The cleanest test of skill per member. We hold each member’s purchases as a portfolio and strip out the market, company size, value and momentum. The cloud centres on a beta of 1.0 and an alpha of zero: most of Washington is buying the market with a small-cap tilt. Only 3 members show significant positive alpha — Don Beyer, Jerry Moran and Bill Keating — and 3 significant negative, roughly what chance alone produces. Names that look brilliant per trade, such as Mark Green, Marjorie Taylor Greene and Josh Gottheimer, lose significance once style is removed.
21. Senators trade through spouses and joint accounts; House members trade for themselves
House vs Senate · 70,152 transactions, 2012–2026
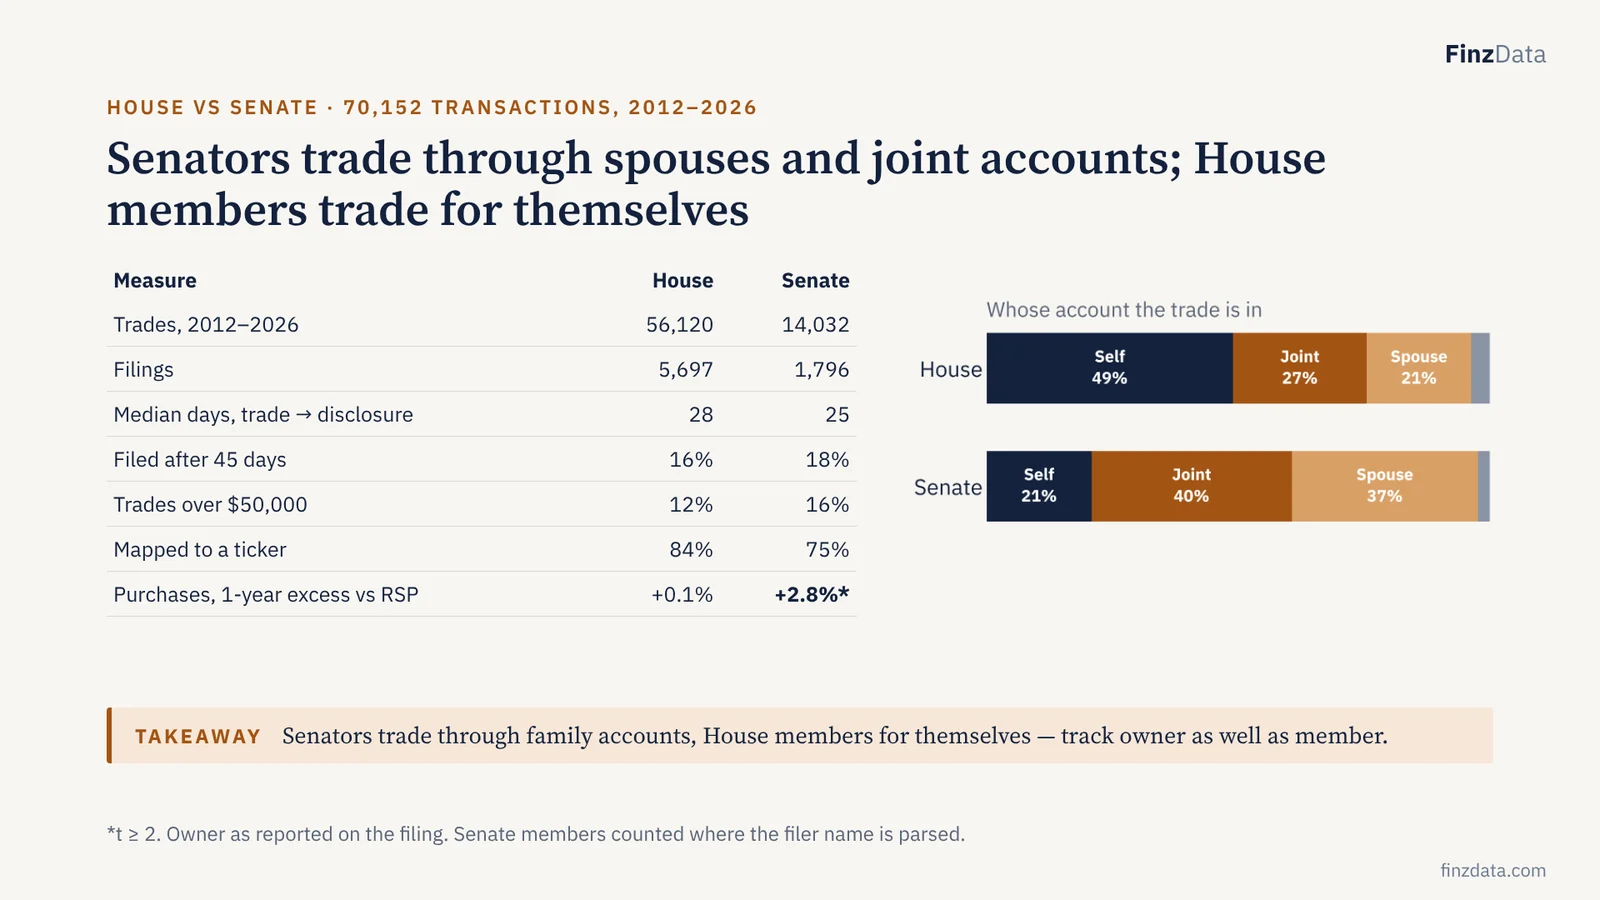
Takeaway: Senators trade through family accounts, House members for themselves — track owner as well as member.
The chambers are structurally different. Half of House trades are in the member’s own account; in the Senate, three quarters run through a spouse or a joint account, and senators are more likely to trade over $50,000. Both chambers disclose in under a month at the median, and about one trade in six arrives after the 45-day deadline. The Senate’s purchases are the ones that beat equal weight over a year.
22. One account out-trades all of Congress
The President · a third disclosure regime
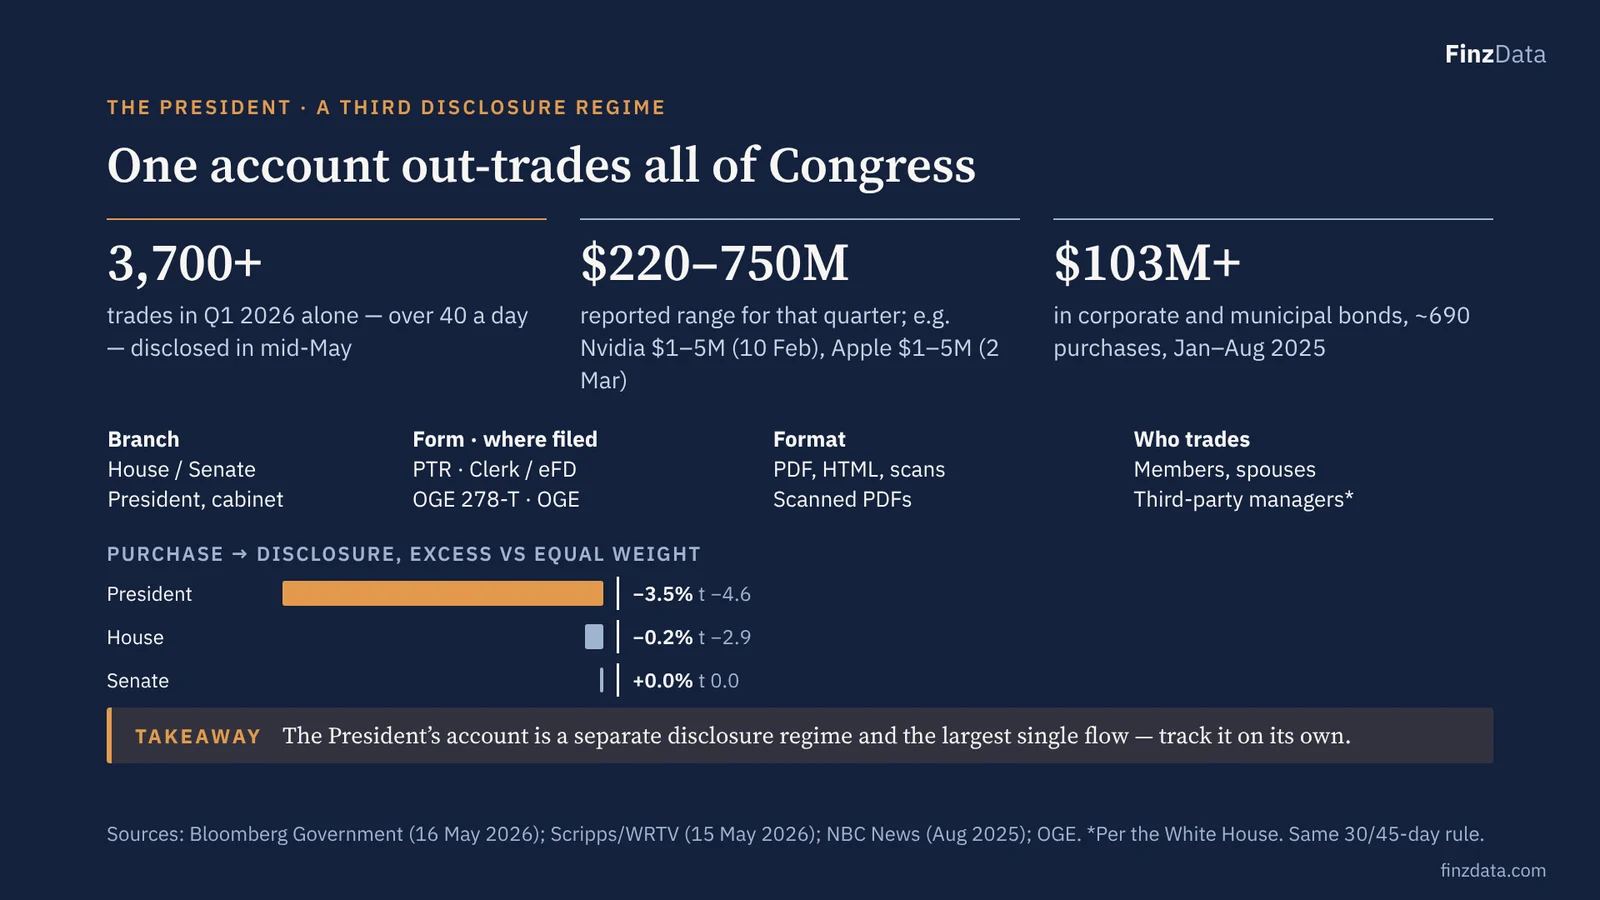
Takeaway: The President’s account is a separate disclosure regime and the largest single flow — track it on its own.
The President’s disclosures run through the Office of Government Ethics on Form 278-T, not through Congress, and they are scanned PDFs. The White House says outside managers run the accounts. The volume is the story: more than 3,700 trades in one quarter, more than our entire 50-member congressional sample over nine months, with individual positions in companies that have business before the administration. For institutions this is a flow and positioning dataset in its own right — and it is the next coverage FinzData is adding.
23. Trade the person, the flow and the benchmark — not the branch
Applying the insights
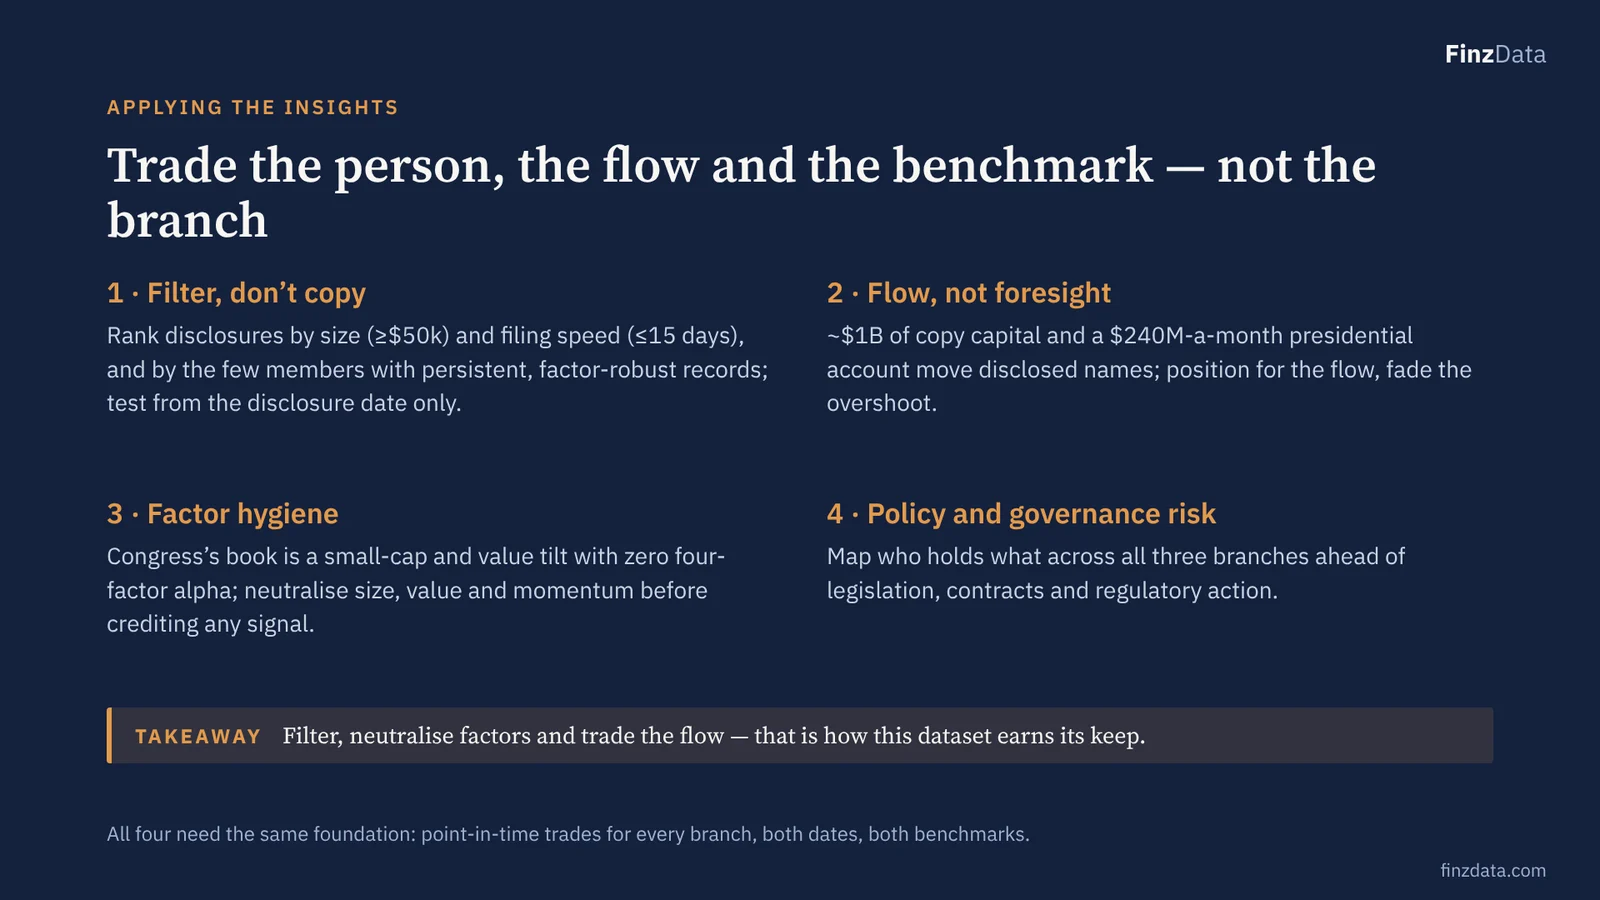
Takeaway: Filter, neutralise factors and trade the flow — that is how this dataset earns its keep.
Four applications. First, filter rather than copy: big tickets, fast filers and a short list of members with factor-robust records, tested from the disclosure date. Second, the dependable effect is flow: retail copy capital and a very large presidential account trade disclosed names, which a fund can position around. Third, factor hygiene: across fourteen years Congress’s apparent edge is size and value exposure, with zero alpha after factors. Fourth, governance and policy risk across all three branches.
24. Late filing is common, cheap — and a signal
The traps · 1
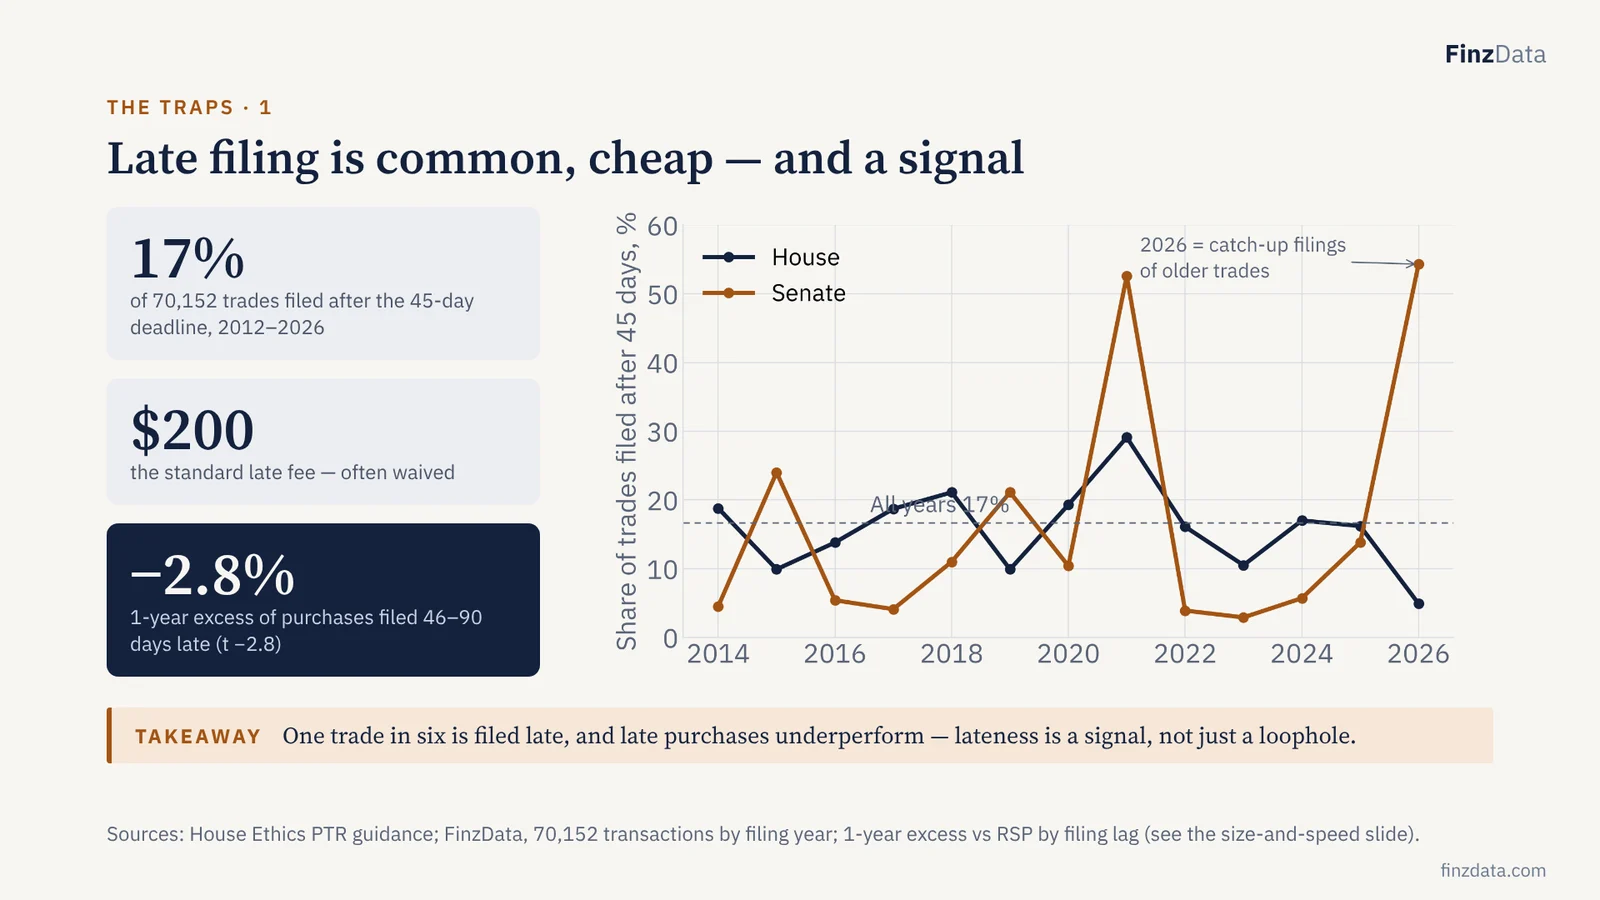
Takeaway: One trade in six is filed late, and late purchases underperform — lateness is a signal, not just a loophole.
Late filings cut both ways. They are look-ahead poison in any backtest dated by trade date — a trade disclosed two years late looks tradable two years too early. And they are a behavioural signal: late-filed purchases underperform by two to three percent over a year. Lateness spikes in particular years, such as 2021, when catch-up filings arrived in bulk. FinzData flags every late row against the 45-day rule.
25. Five ways congressional data fakes alpha
The traps · 2
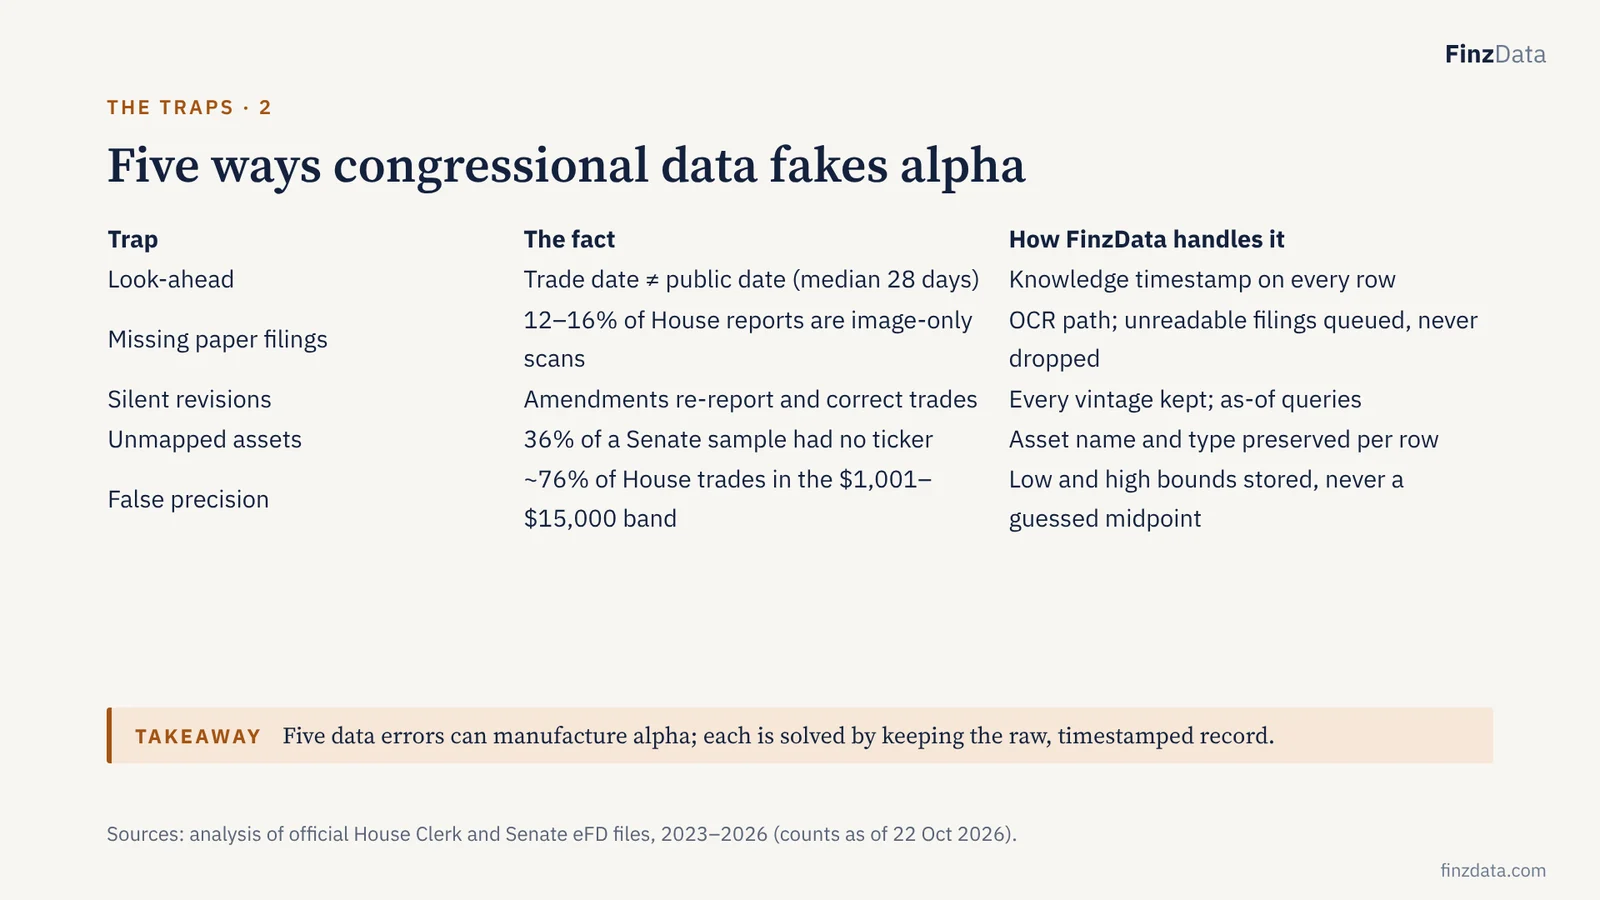
Takeaway: Five data errors can manufacture alpha; each is solved by keeping the raw, timestamped record.
Each of these is a common way a congressional-trades backtest looks better than reality. The product decisions on the right are the reason the database exists.
26. Built, not promised: fourteen years, every row timestamped
The FinzData database
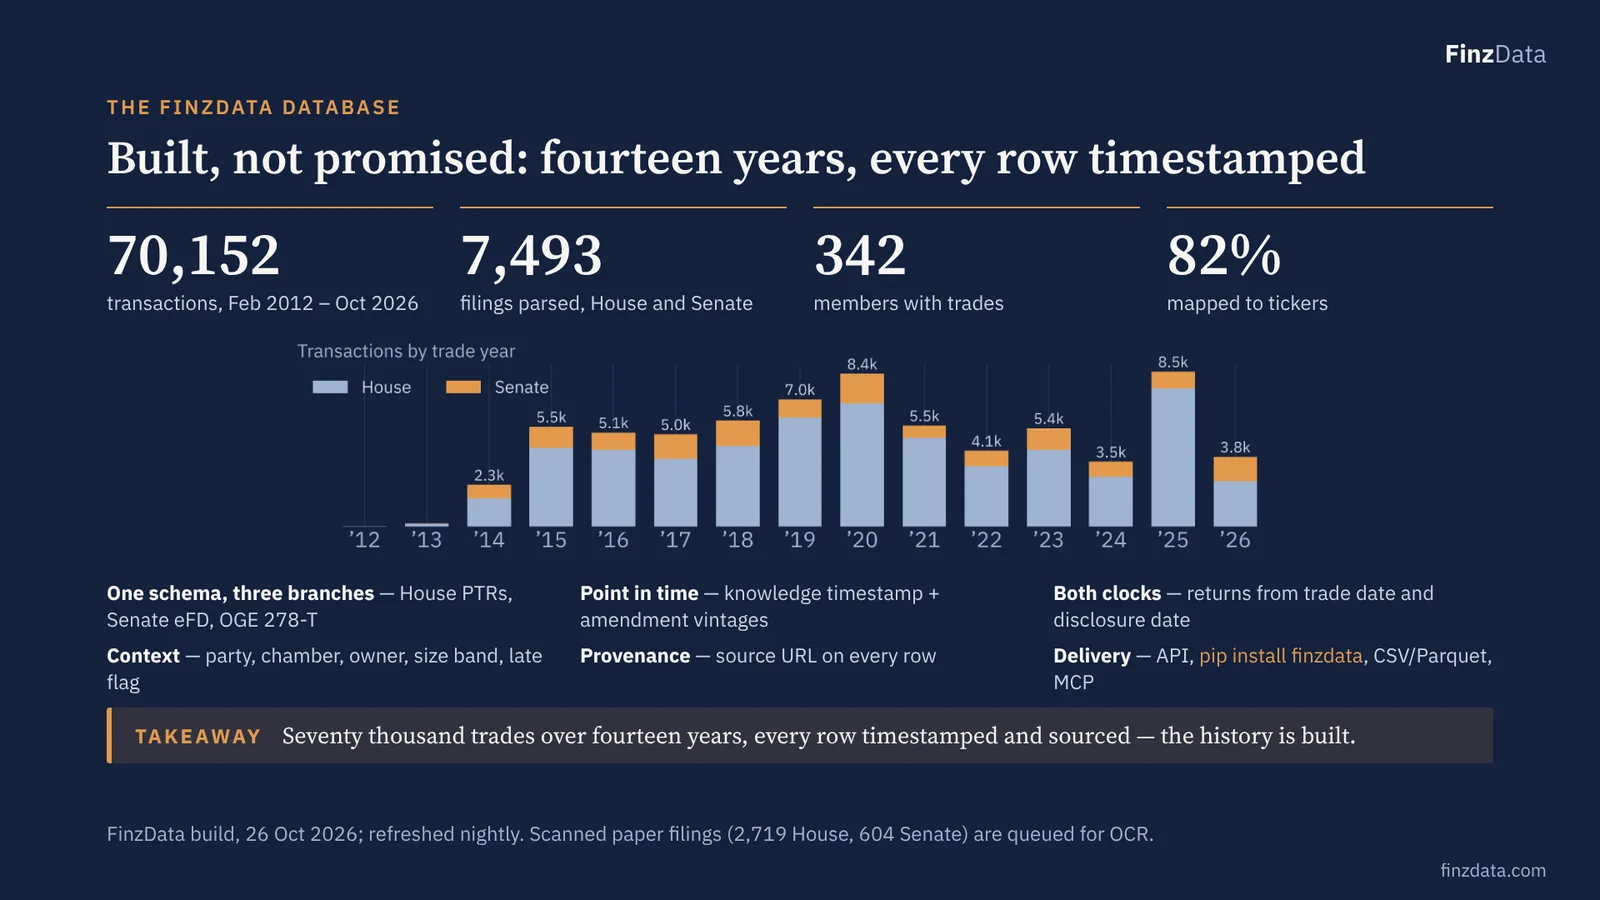
Takeaway: Seventy thousand trades over fourteen years, every row timestamped and sourced — the history is built.
These numbers come from our own build against the official House Clerk and Senate eFD sources, back to 2012. Every row links back to its source document, carries the date it became public, and keeps every amended version.
27. One record, four desks
The FinzData database
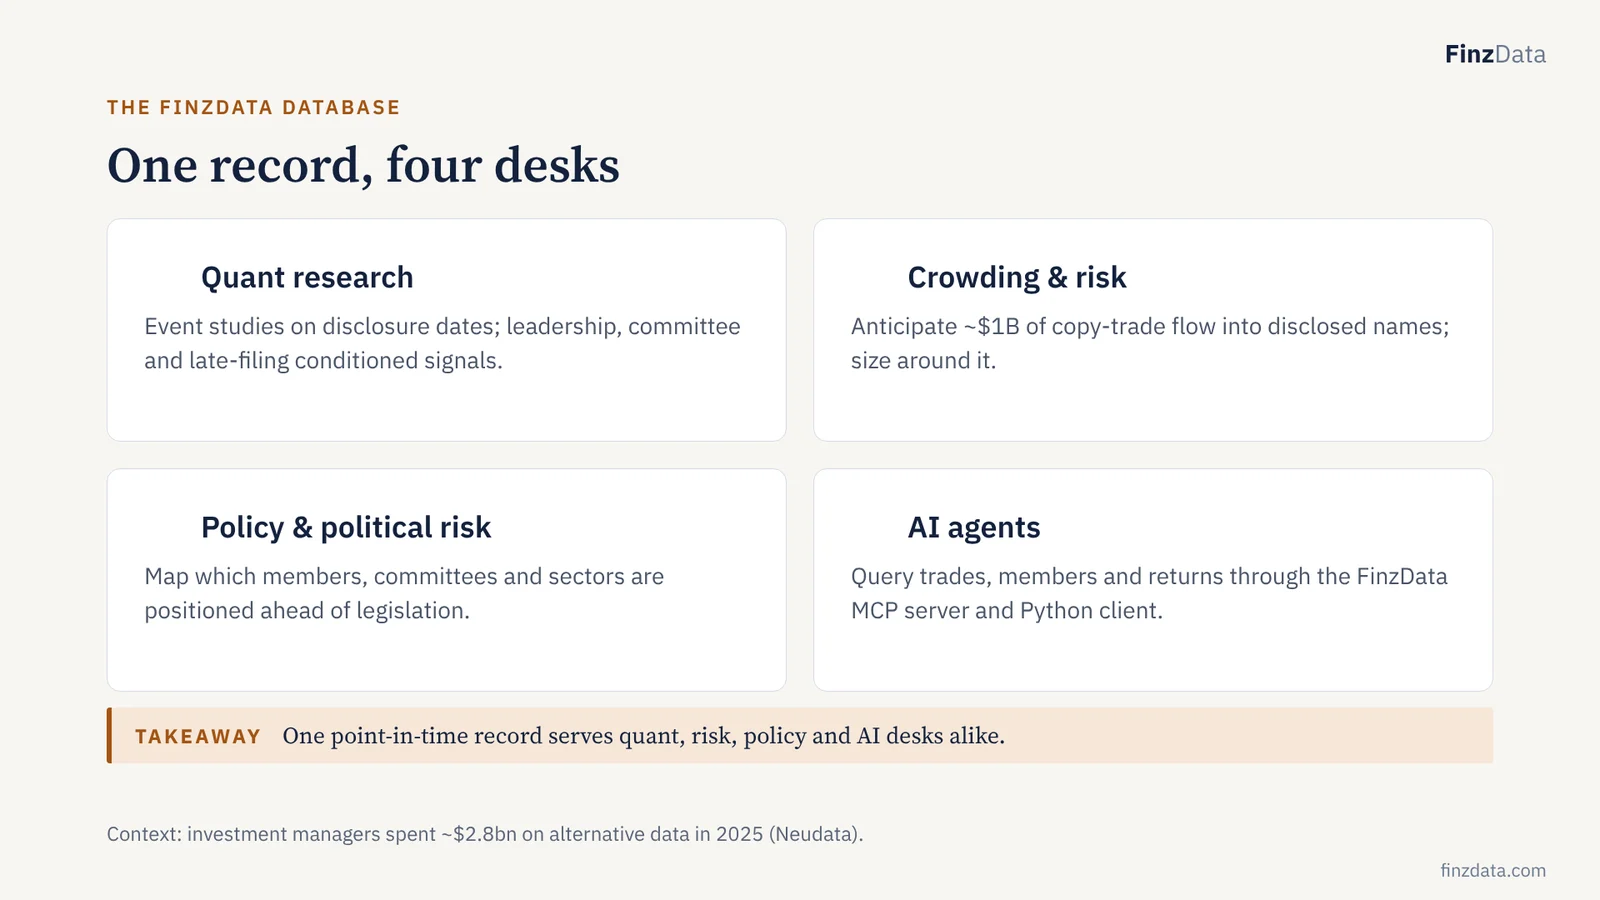
Takeaway: One point-in-time record serves quant, risk, policy and AI desks alike.
The same point-in-time record serves several desks. Quants test conditional signals; risk teams anticipate crowded flow; policy teams map exposure; AI agents query it directly through MCP.
28. What an institutional buyer checks
The FinzData database
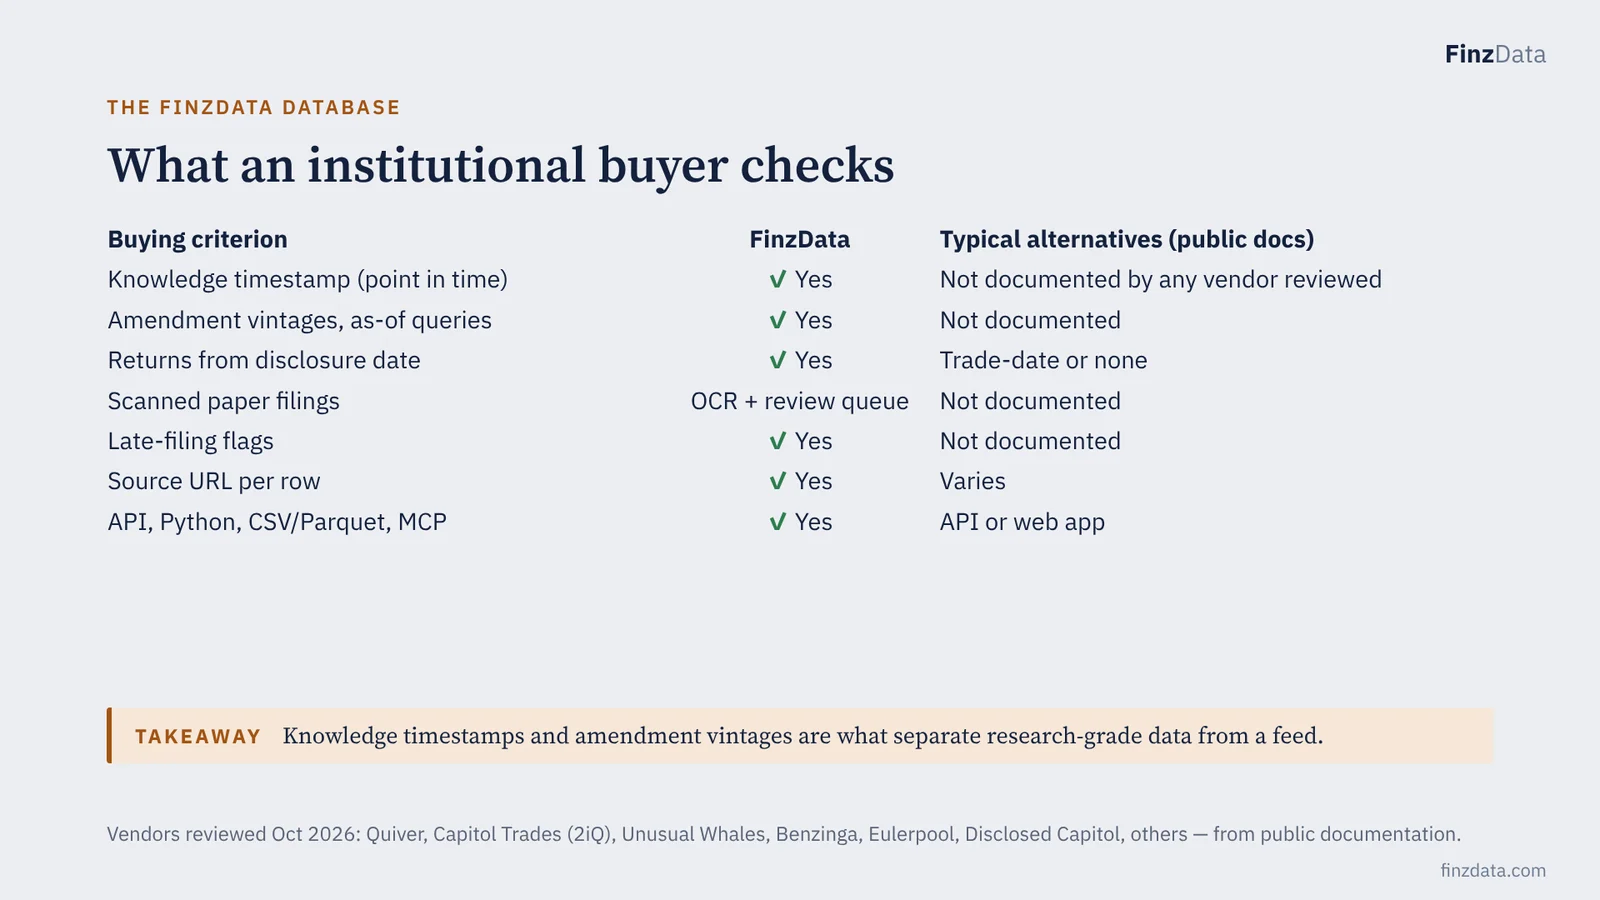
Takeaway: Knowledge timestamps and amendment vintages are what separate research-grade data from a feed.
This is the diligence checklist an institutional data team runs. The differentiator is not the trades themselves — those are public — but whether the history is point in time, revision-tracked and complete.
29. Priced to clear procurement in a day
Commercials
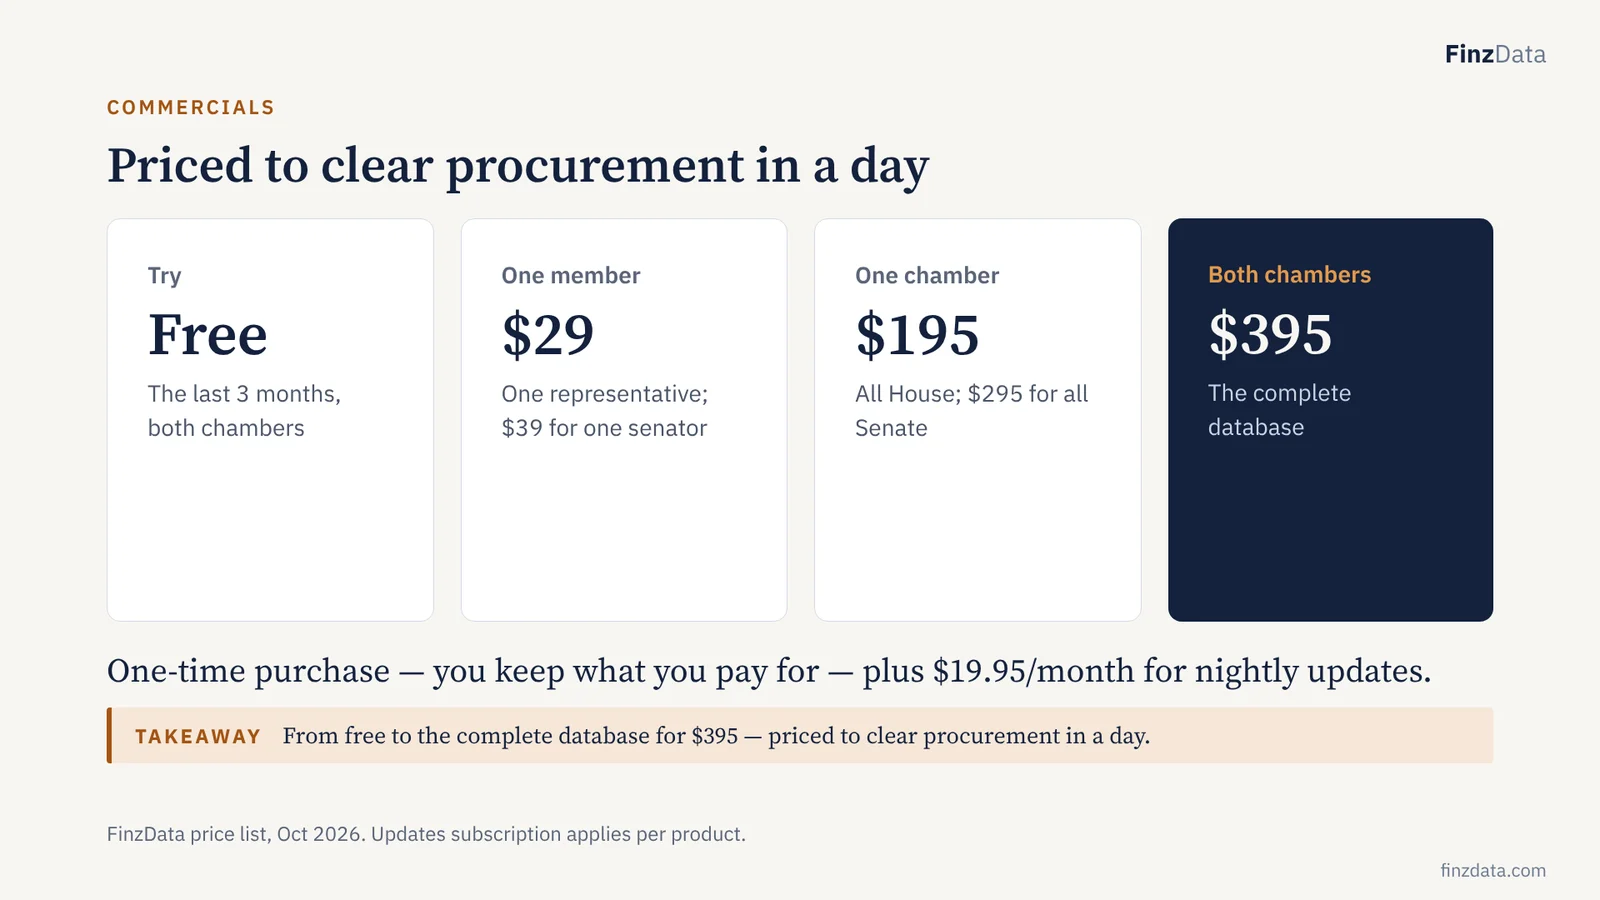
Takeaway: From free to the complete database for $395 — priced to clear procurement in a day.
Pricing is designed to fall below discretionary-spend thresholds, so a research team can buy without a procurement cycle. The complete two-chamber database is $395 one-time, and the data is theirs to keep.
30. Reform changes the feed, not the value of the archive
Outlook
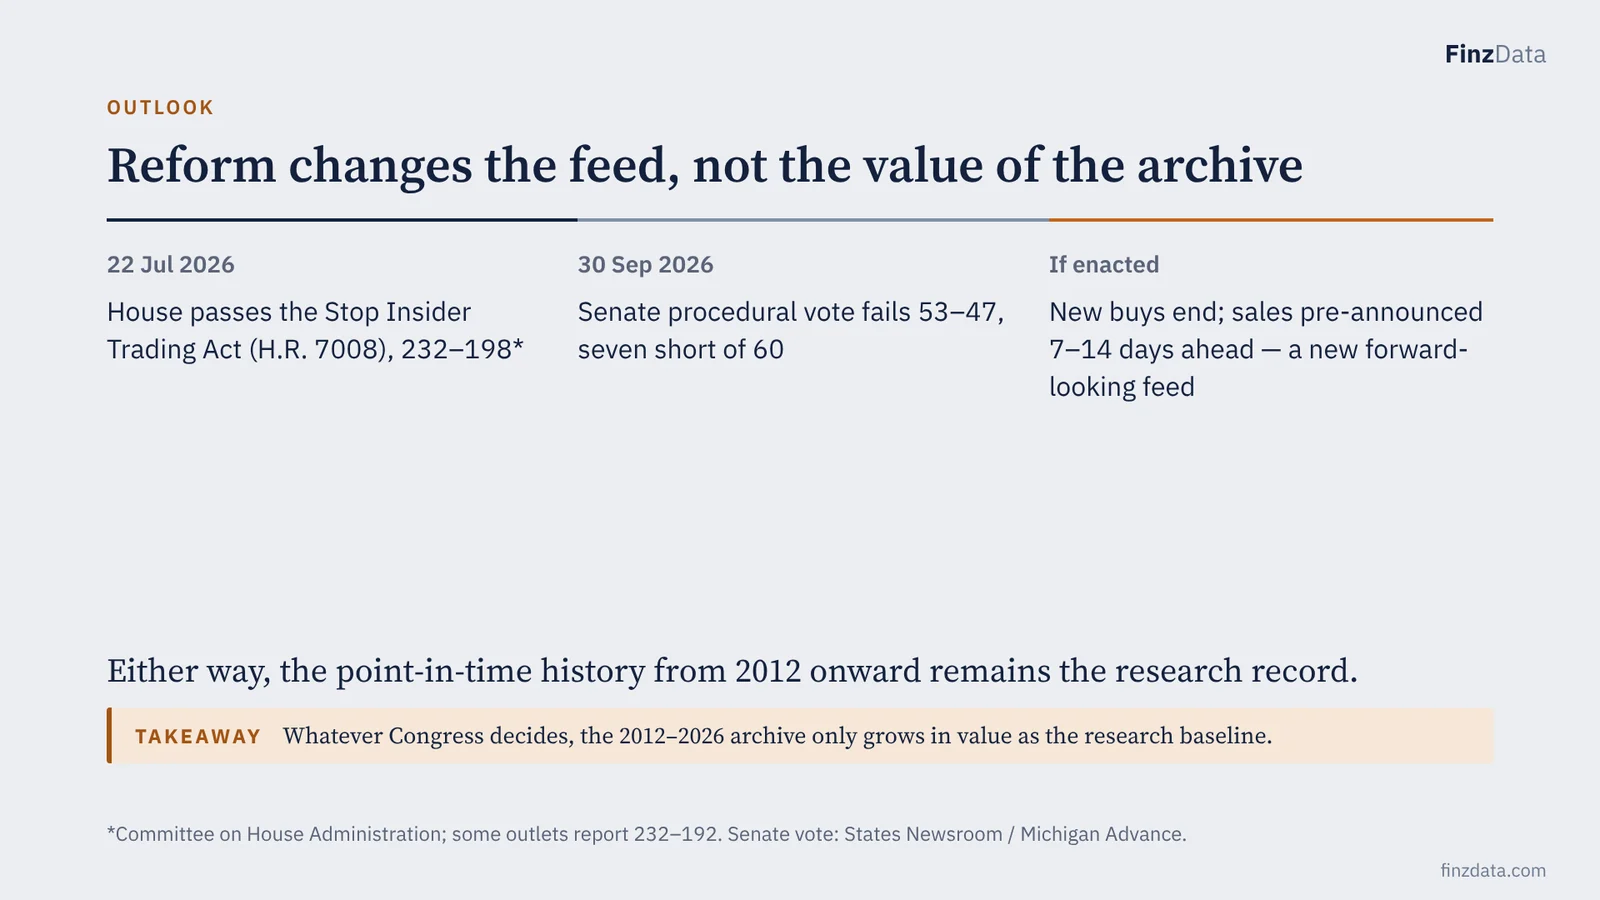
Takeaway: Whatever Congress decides, the 2012–2026 archive only grows in value as the research baseline.
Reform is a tailwind for a point-in-time vendor. If a ban passes, disclosed buys stop, sale notices arrive in advance, and the historical archive becomes the only place to study the old regime. If it does not pass, the status quo continues.
31. What ships next
Roadmap & next step
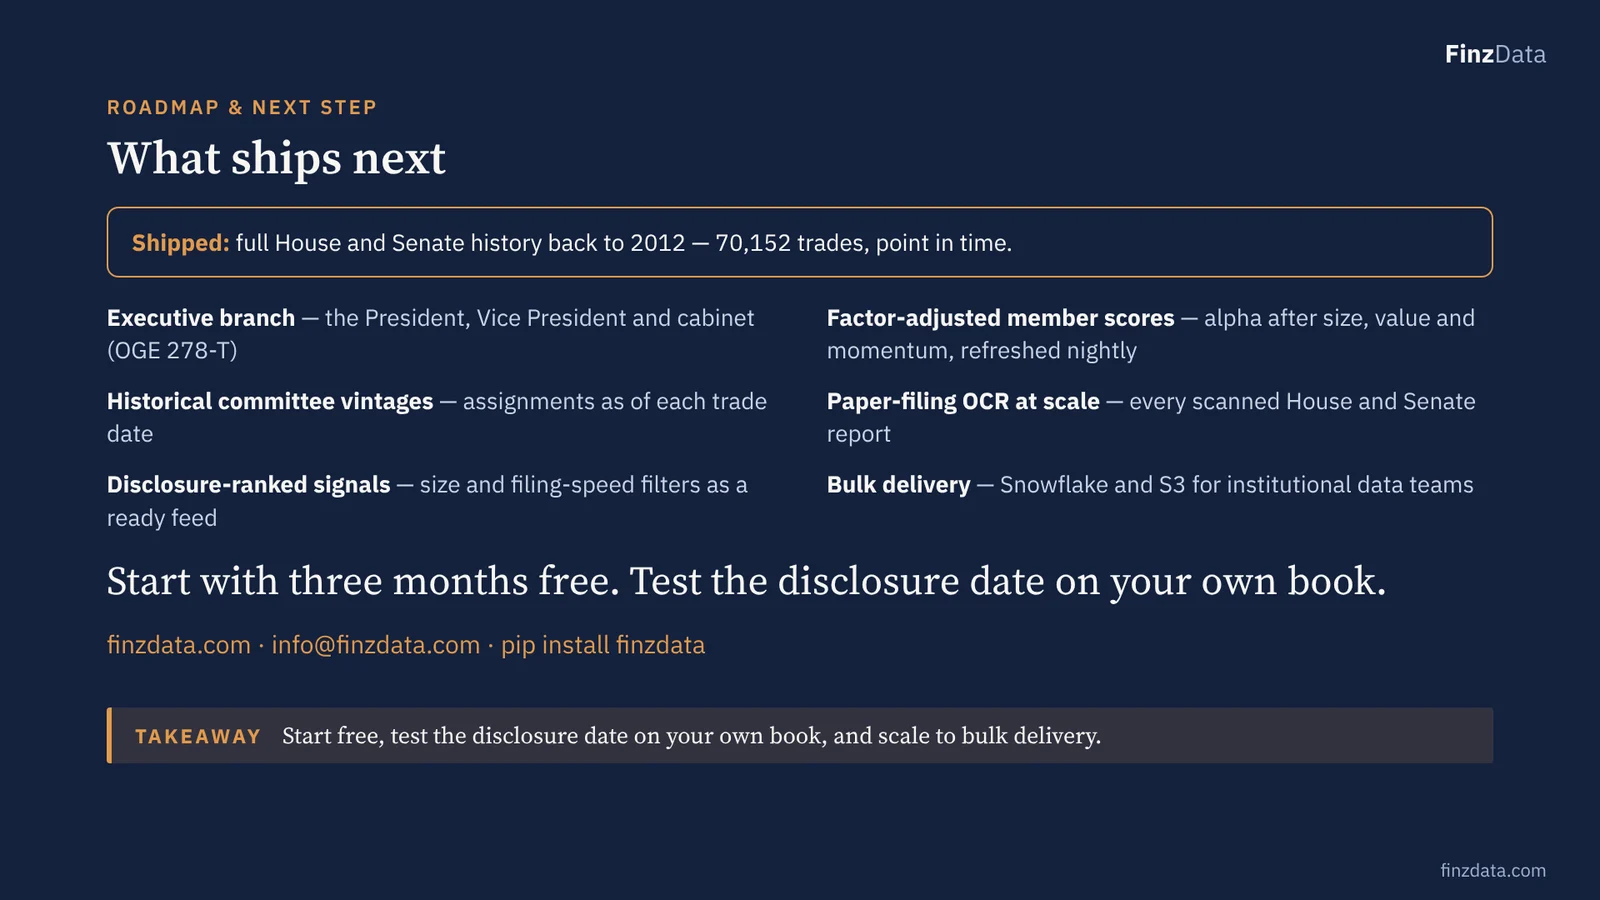
Takeaway: Start free, test the disclosure date on your own book, and scale to bulk delivery.
Close on the trial. The free three months lets a research team run a disclosure-date event study on its own universe before buying. The history to 2012 has shipped; the roadmap items are in build now.
Frequently asked questions
Do members of Congress beat the stock market?
Not as a group. From 2012 to 2026, House purchases trailed the S&P 500 by 2.2% after a year and Senate purchases were 1.2% ahead; against the equal-weight S&P 500 the House was flat and the Senate 2.8% ahead. After adjusting for size, value and momentum, Congress's alpha is zero.
Do senators make better stock trades than House members?
Senate purchases beat the equal-weight index by 2.8% at one year and 7.7% at four, while House purchases were flat. The Senate's 1.8% a year of factor-adjusted alpha is not statistically significant, so the difference may be luck.
How long does Congress take to disclose stock trades?
The median is 27 days from trade to public disclosure. About one trade in six (17%) is filed after the STOCK Act's 45-day deadline.
Can you make money copying congressional stock trades?
A Senate copy book that bought each purchase on its disclosure date and held it a year compounded at 12.5% a year from 2014 to 2026, against 11.8% for the S&P 500, but with higher volatility and a deeper drawdown. The House copy book returned 9.4% a year.
Do Democrats or Republicans in Congress trade better?
Democrats' purchases beat equal weight by about a point a year and Republicans' were flat, but the gap is style: Republicans lean toward value stocks. After factor adjustment both parties' alpha is about −0.4% a year.
Which congressional trades carry a signal?
Large purchases ($50,000 and more beat equal weight by 2.6% to 6.6% over a year) and fast filings (disclosed within 15 days: +2.7%). Late filings underperformed by about 2.8%.
What is the STOCK Act?
The 2012 STOCK Act requires members of Congress to report stock trades within 45 days. Google searches for it in the past 12 months ran at almost three times their five-year average, peaking in March 2026, as the push to ban congress stock trading grew.
Where can I get congressional trading data?
FinzData publishes point-in-time House, Senate and presidential trade data from 2012, with the disclosure date, amendments and source link on every row, at finzdata.com/congress, through the API, pip install finzdata and the MCP server.
Download the deck (PDF, 31 slides) More research
Explore every member, trade and filing in the FinzData congressional trades database: House, Senate and the President, point in time, with the disclosure date, amendments and source link on every row. AI assistants such as Claude and ChatGPT can query the same data through the FinzData MCP server.
How we measured. Price returns per purchase from the first trading day on or after the trade (or disclosure) date, against SPY and the S&P 500 equal-weight index (RSP); same-day same-stock purchases counted once; 1%/99% tails clipped; penny stocks excluded; trades disclosed more than a year late excluded. Factor tests use daily calendar-time portfolios with Newey-West t-statistics. Google Trends: United States, past five years vs past 12 months, as of October 26, 2026.
The FinzData team
Built for AI, quants, data scientists and financial analysts who backtest. Clean data. Real insights. Real alpha. finzdata.com. This material is for information only and is not investment advice. Data sources: House Clerk periodic transaction reports; Senate eFD; OGE Form 278-T; FinzData prices; Google Trends (United States); Benzinga; StockAnalysis; academic studies cited on the slides
Get FinzData research free, every morning
The daily brief: what moved, the macro releases that matter, positioning and liquidity, with charts. One email a day, free, unsubscribe anytime.
Topics and related searches
Elections and political spending Equity strategy and factors Quant models and market regimes
People also search
- pelosi stock
- pelosi stock trades
- pelosi tracker
- congress stock trading
- congress stock trading tracker
- stock act
- ban congress stock trading
- congress insider trading
- trump stock trades
- senator stock trades
- capitol trades
- quiver quantitative