
FinzData Research · Published 31 October 2026
AI Futures Championship 2026: can AI models beat trend following?
Twelve AI models each designed three systematic strategies for 48 futures markets. We scored them once on almost eight years of data none of them had seen. One beat the 12-month trend benchmark.
Get FinzData research free, every morning
The daily brief: what moved, the macro releases that matter, positioning and liquidity, with charts. One email a day, free, unsubscribe anytime.
Contents
- How the championship worked
- Final standings
- Growth of $1 out of sample
- Sharpe ratios with confidence intervals
- In sample versus out of sample
- Turnover and costs
- Herding into carry and trend
- What the blind judges rewarded
- The winner: Claude Haiku
- Lessons and Round 2 changes
- Frequently asked questions
1. AI Futures Championship 2026
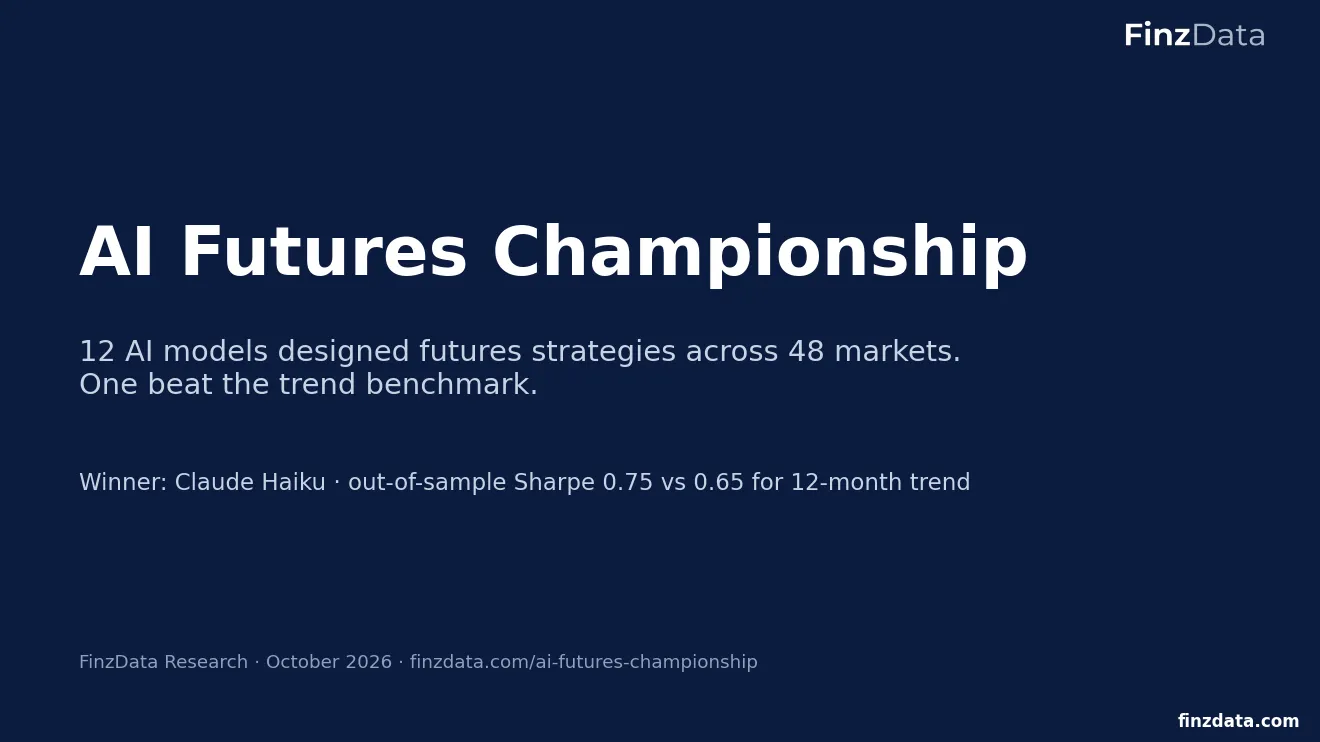
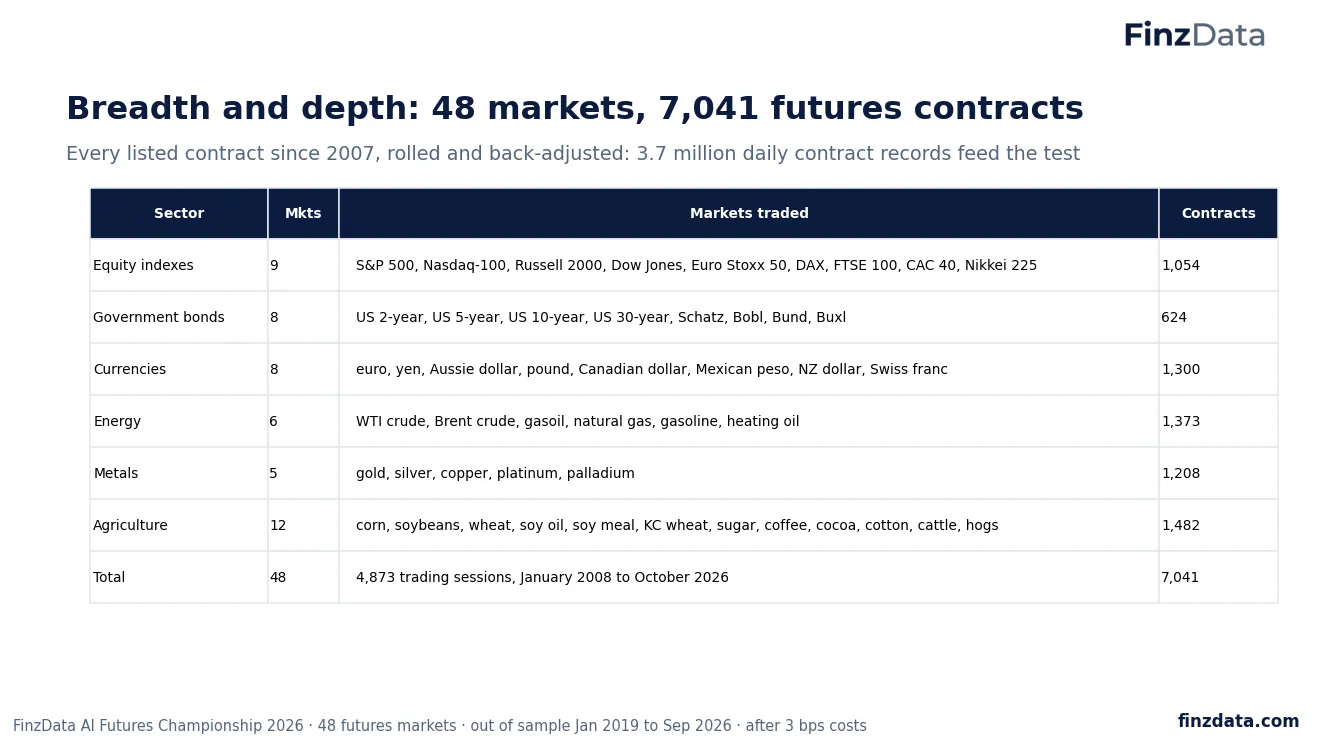
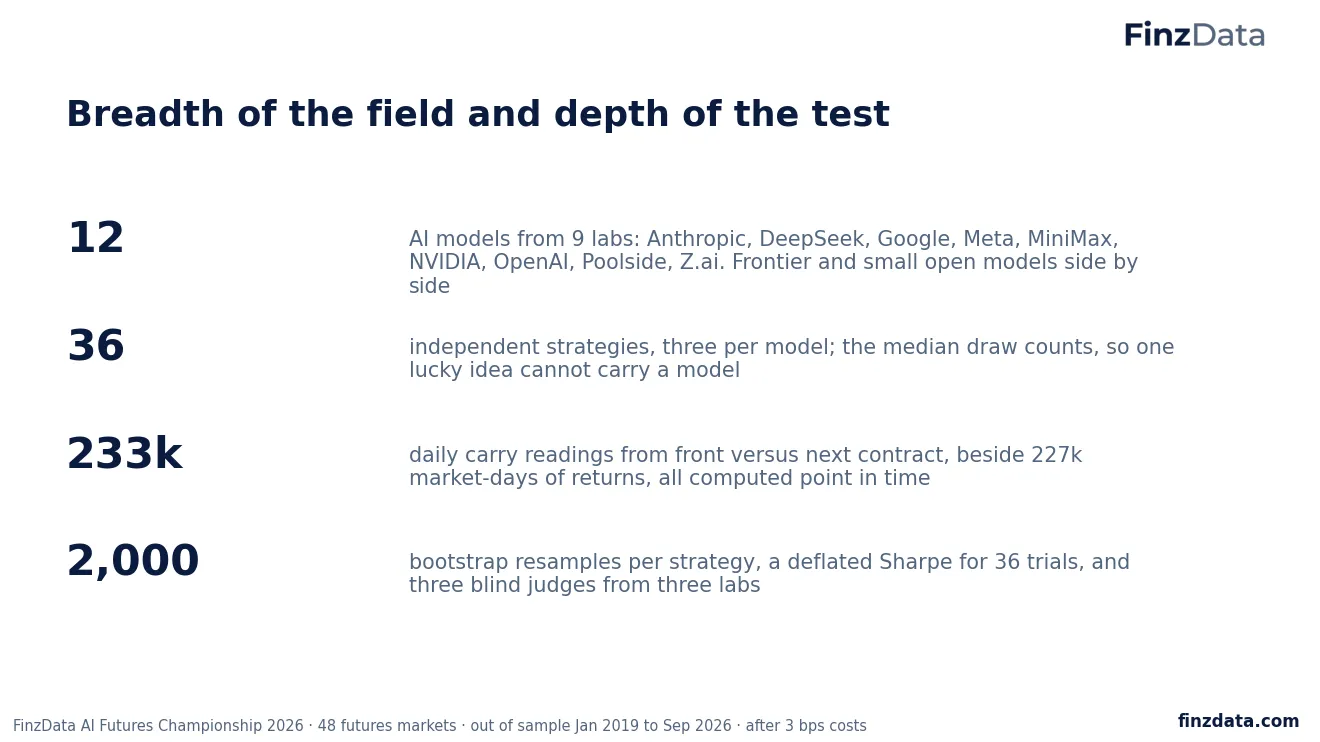
We gave twelve AI models the same brief: design one systematic strategy for 48 liquid futures markets, write down why it should work and how it could fail, and express it in a fixed formula language. Every model drew three independent strategies, 36 in all. We ran them all through one engine on 2009 to 2018 data, then scored them once on January 2019 to September 2026, a period no model had seen.
Claude Haiku won with an out-of-sample Sharpe ratio of 0.75. It was the only entry to beat the simplest serious benchmark in futures, a 12-month trend-following rule, which made 0.65 over the same period.
2. How the championship worked
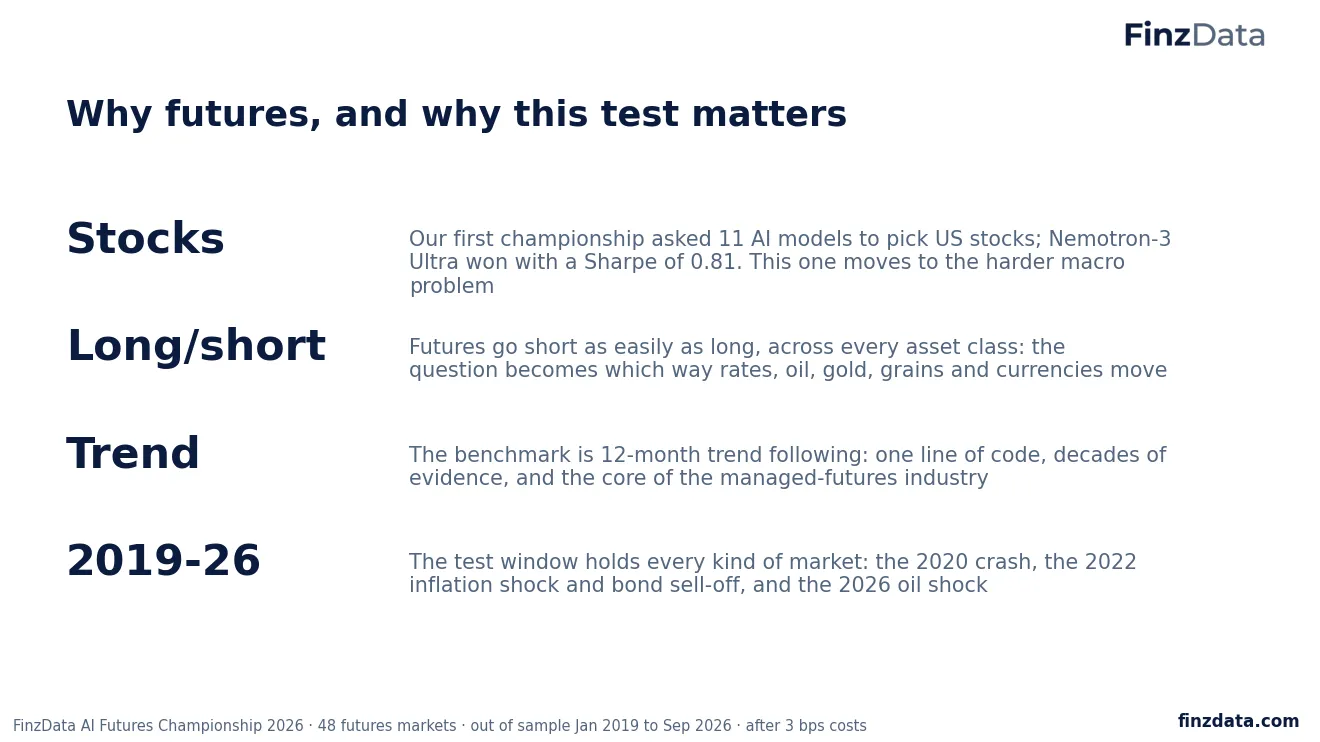
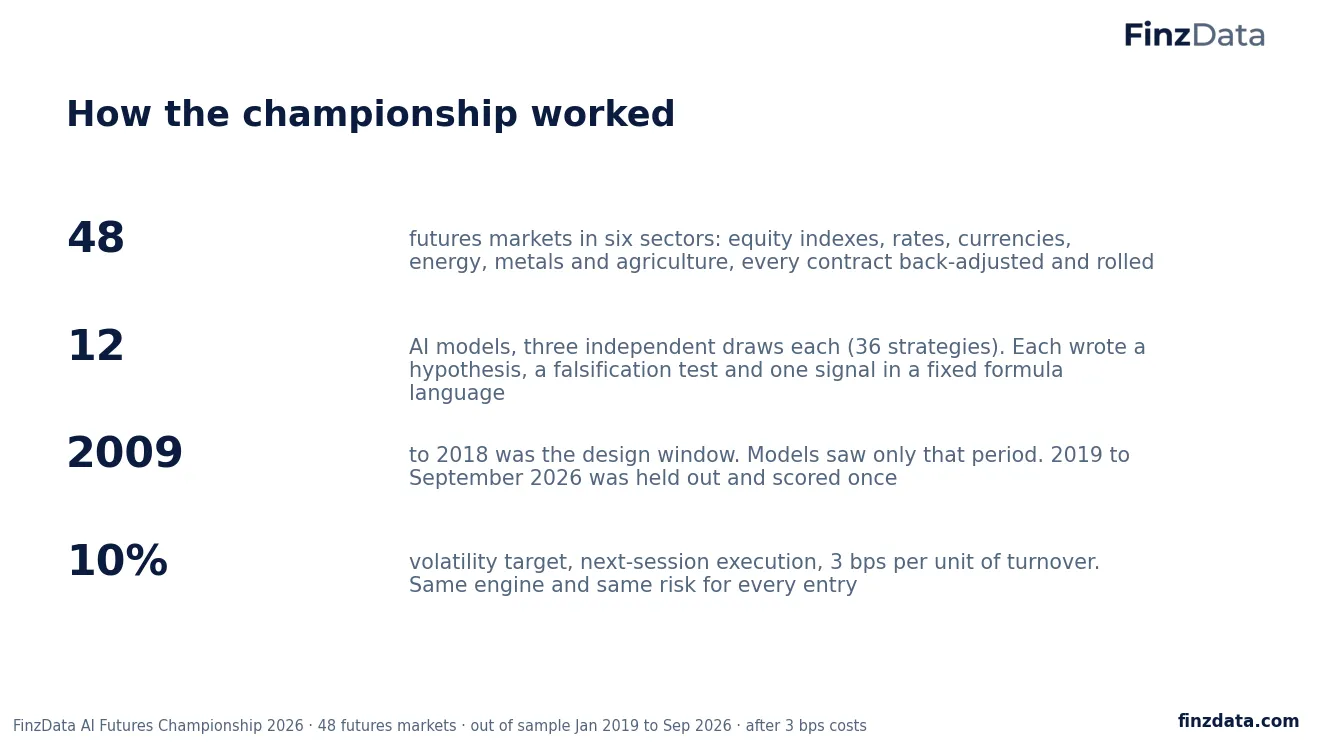
The universe is 48 futures markets: nine equity indexes, eight government bond futures, eight currencies, six energy contracts, five metals and twelve agricultural markets. Returns come from back-adjusted continuous contracts, and carry comes from the price gap between the front and next contract, annualised.
Each entry is a signal formula built from a short list of functions: returns, volatility, moving averages, breakouts, carry, time-series and cross-sectional ranks and z-scores. The engine turns the signal into positions, scales the whole book to 10% expected volatility, trades at the next session and charges 3 basis points per unit of turnover. Because the engine is the same for every model, the only thing that differs is the idea.
Each model's three draws are scored and the median out-of-sample draw counts, so a lucky draw cannot carry a model. The final score is 70% performance rank and 30% the mean of three blind judges, who saw the hypothesis, test and signal but no results.
3. Final standings
| # | Model | Access | OOS Sharpe | IS Sharpe | Judges | Final | Signal |
|---|---|---|---|---|---|---|---|
| 1 | Claude Haiku | Anthropic | 0.75 | 0.36 | 7.3 | 0.92 | zscore(ret(252)/vol(252)) + 0.5*zscore(carry()) |
| 2 | MiniMax M3.1 Flash | MiniMax via NIM | 0.64 | 0.68 | 8.0 | 0.88 | rank(breakout(252)) + 0.5*rank(ts_mean(carry(),126)) |
| 3 | Claude Sonnet | Anthropic | 0.48 | 0.69 | 8.0 | 0.75 | 0.5*sign(ret(252)) + 0.25*sign(ret(63)) + 0.25*clip(zscore(carry()),-1,1) |
| 4 | Nemotron-3 Ultra | NVIDIA NIM | 0.48 | 0.05 | 5.3 | 0.73 | ts_z(ret(252), 252) + 0.5 * ts_z(carry(), 252) |
| 5 | Muse Glimmer 30B | Meta via NIM | 0.36 | 0.47 | 7.3 | 0.67 | rank(ret(126)) + 0.4*rank(carry()) |
| 6 | Claude Fable | Anthropic | 0.35 | 0.93 | 7.7 | 0.61 | sign(ret(252)) + sign(carry()) |
| 7 | Gemma 4 31B | Google via NIM | 0.30 | 0.68 | 6.3 | 0.51 | rank(ret(126)) + rank(carry()) |
| 8 | GLM-5.3 Flash | Z.ai via NIM | 0.06 | 0.57 | 8.3 | 0.44 | sign(ret(63)) + sign(ret(126)) + sign(ret(252)) + 0.5 * rank(carry()) |
| 9 | Laguna XS 2.1 | Poolside via NIM | 0.06 | 0.07 | 5.3 | 0.41 | 0.6*rank(ts_z(ret(60),60)) + 0.4*rank(carry()) |
| 10 | GPT-OSS-20B | OpenAI via NIM | 0.05 | -0.42 | 4.3 | 0.26 | rank(ret(252)) + 0.5*rank(carry()) + 0.5*ts_z(breakout(30),20) |
| 11 | Nemotron-3.5 Lightning | NVIDIA NIM | -0.04 | -0.17 | 3.3 | 0.16 | carry() - ts_mean(carry(), 63) |
| 12 | DeepSeek V4.1 Flash | DeepSeek via NIM | -0.31 | 0.44 | 5.3 | 0.16 | rank(carry()) - 0.5*rank(ret(5)) |
Benchmarks over the same test window: 12-month trend 0.65, long every market 0.39. Only one model beat trend; four of twelve beat buying everything.
4. Growth of $1 out of sample
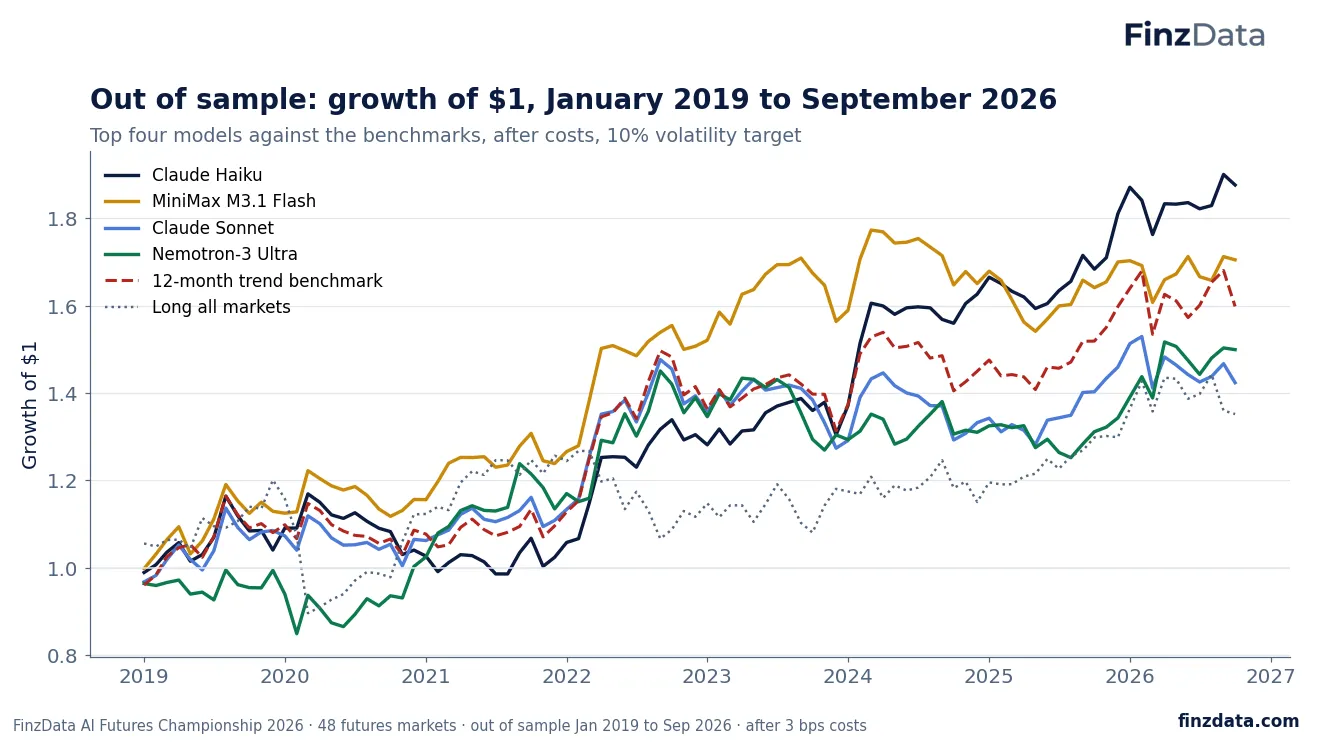
From January 2019 a dollar in the winning strategy grew to 1.88, against 1.60 for the trend benchmark and 1.35 for holding every market long. 2022, the inflation shock, was the best year for every leader, up 22% to 27% as trends in energy, rates and grains ran long. The winner's lead over trend came later: it was flat in 2023 while trend lost 7%, and made 25% in 2024 against 10%.
5. Sharpe ratios with confidence intervals
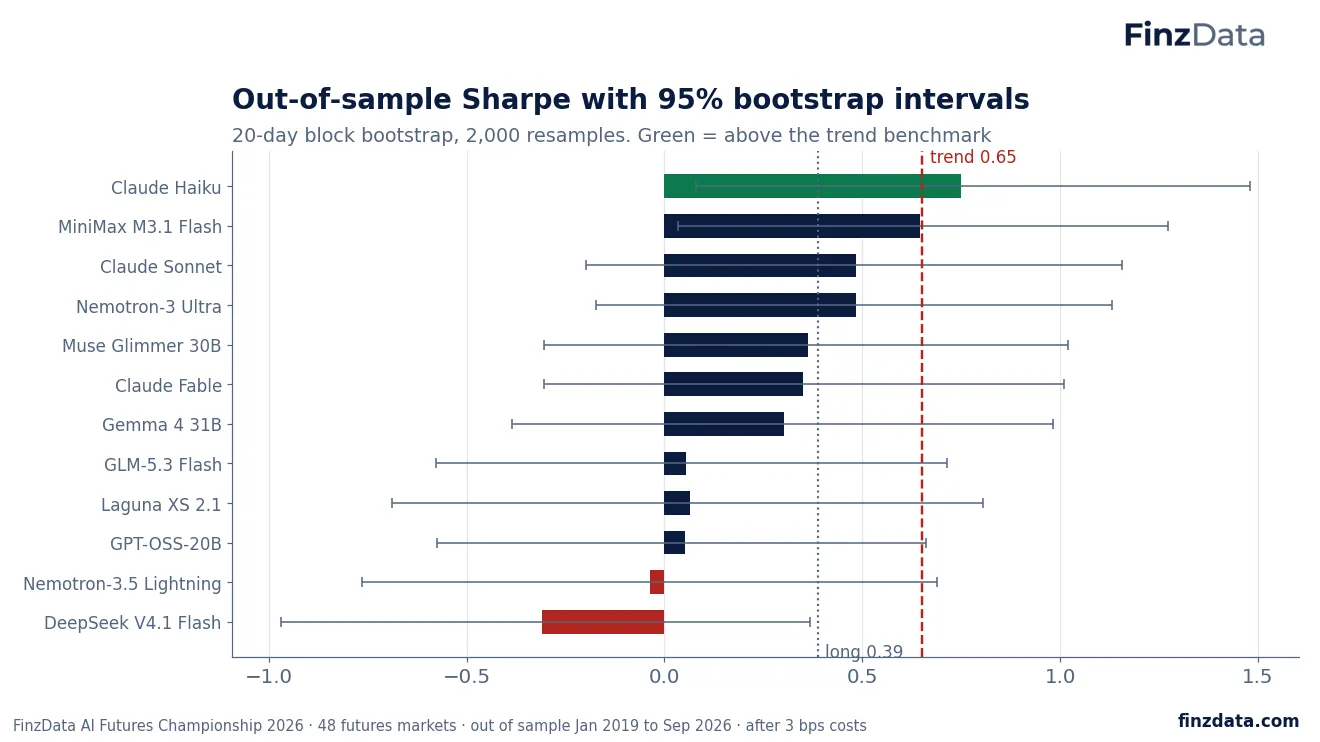
Seven to eight years of out-of-sample data is not a lot for strategies with Sharpe ratios below one. The 95% bootstrap interval for the winner runs from 0.08 to 1.48; the runner-up's from 0.03 to 1.27. Every interval overlaps the trend benchmark. The ranking is real as a record, but the gaps between neighbours are within noise.
6. In sample versus out of sample
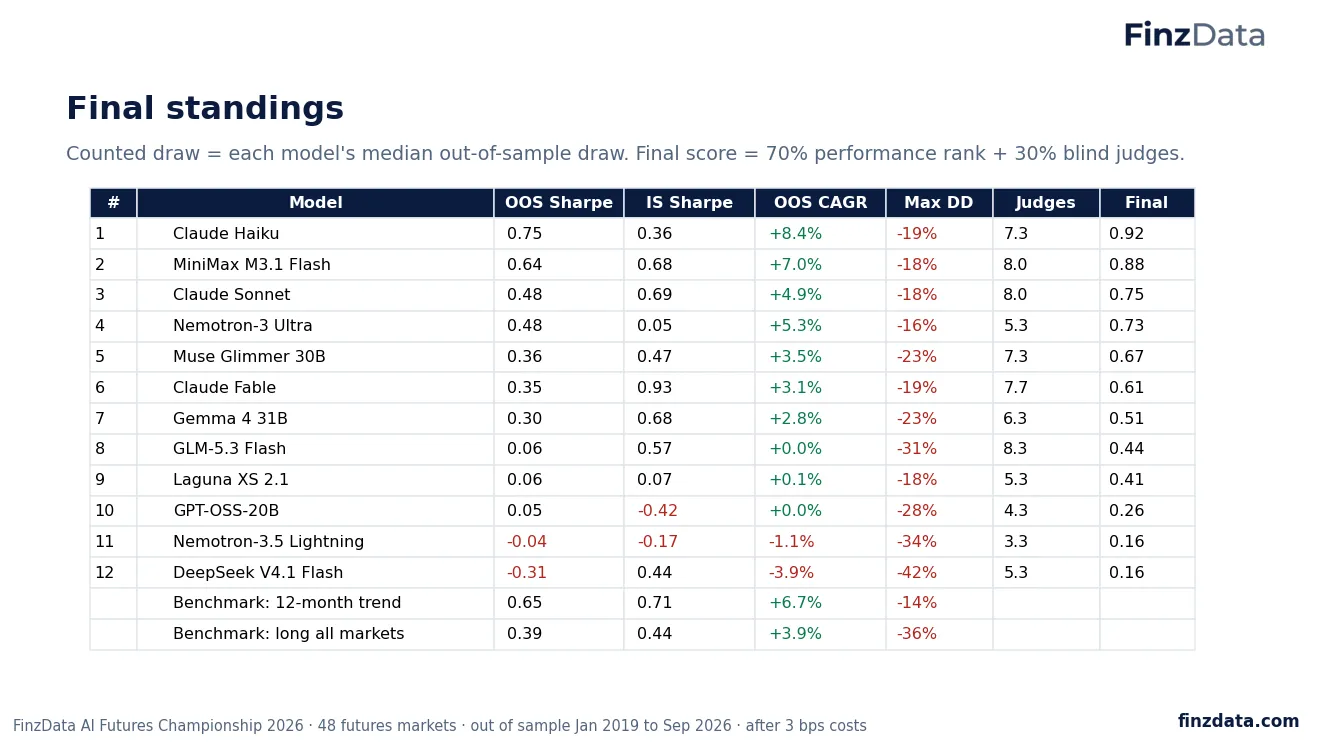
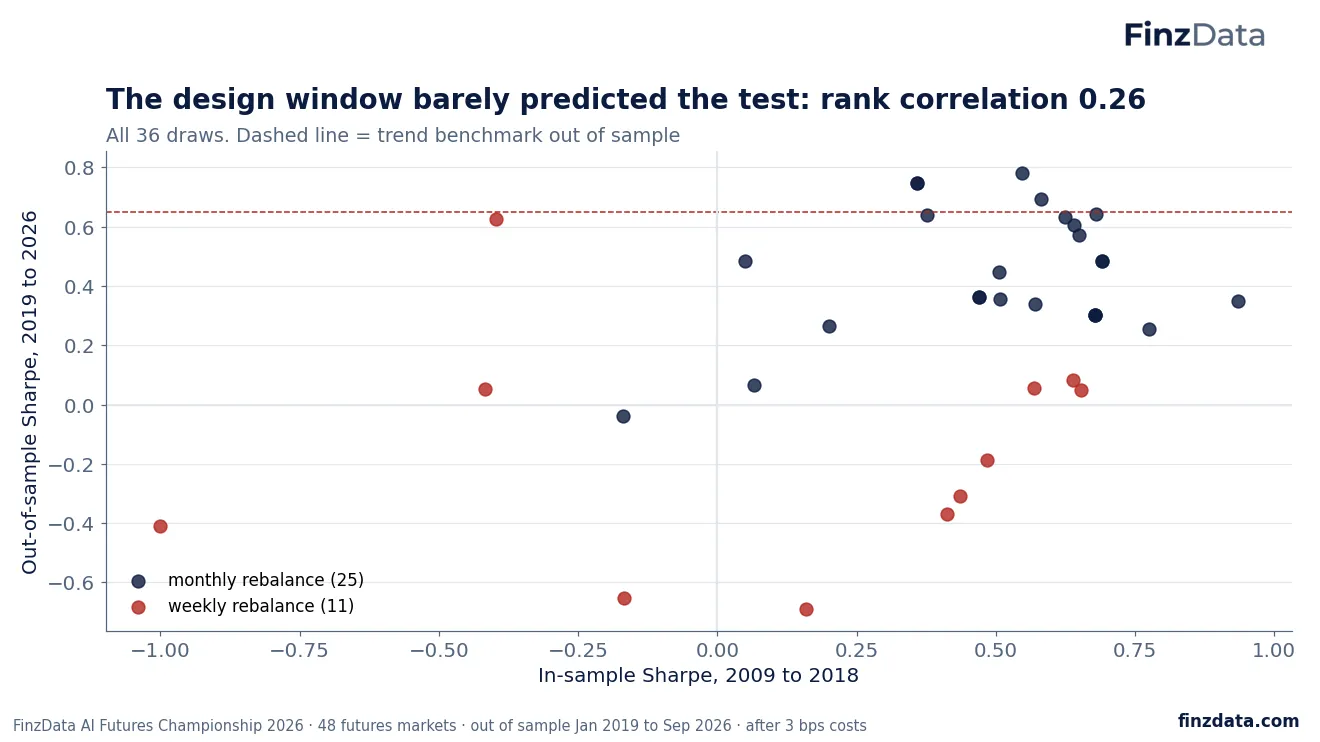
The rank correlation between in-sample and out-of-sample Sharpe across all 36 draws was 0.26. Claude Fable's counted draw had the best design-window record of the twelve, 0.93, and fell to 0.35; Nemotron-3 Ultra did the reverse, 0.05 to 0.48. A good backtest on ten years of futures data told us little about the next eight.
7. Turnover and costs
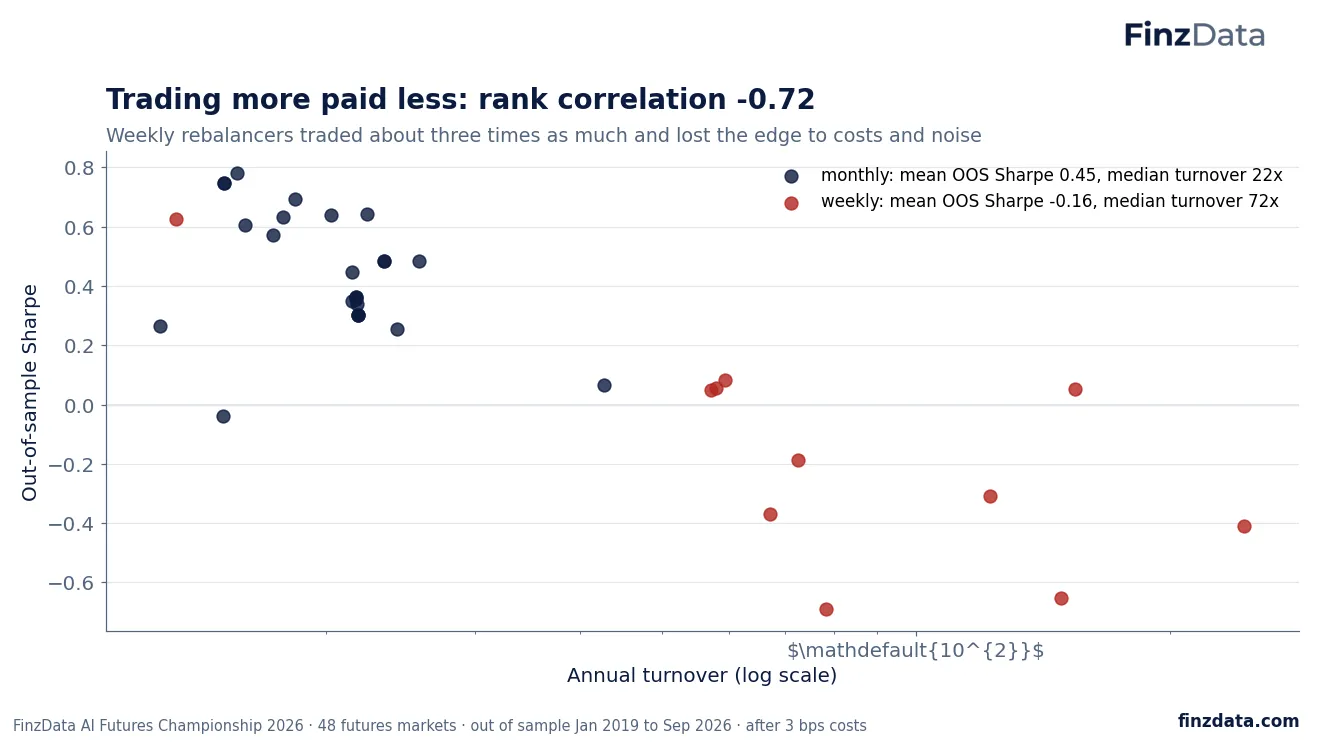
The 11 weekly-rebalancing draws averaged an out-of-sample Sharpe of -0.16 with median turnover of 72 times a year. The 25 monthly draws averaged 0.45 at 22 times. Across all draws the rank correlation between turnover and out-of-sample Sharpe was -0.72, the strongest single pattern in the championship. Costs were modest at 3 basis points, so most of the drag was faster signals catching noise, not fees.
8. Herding into carry and trend
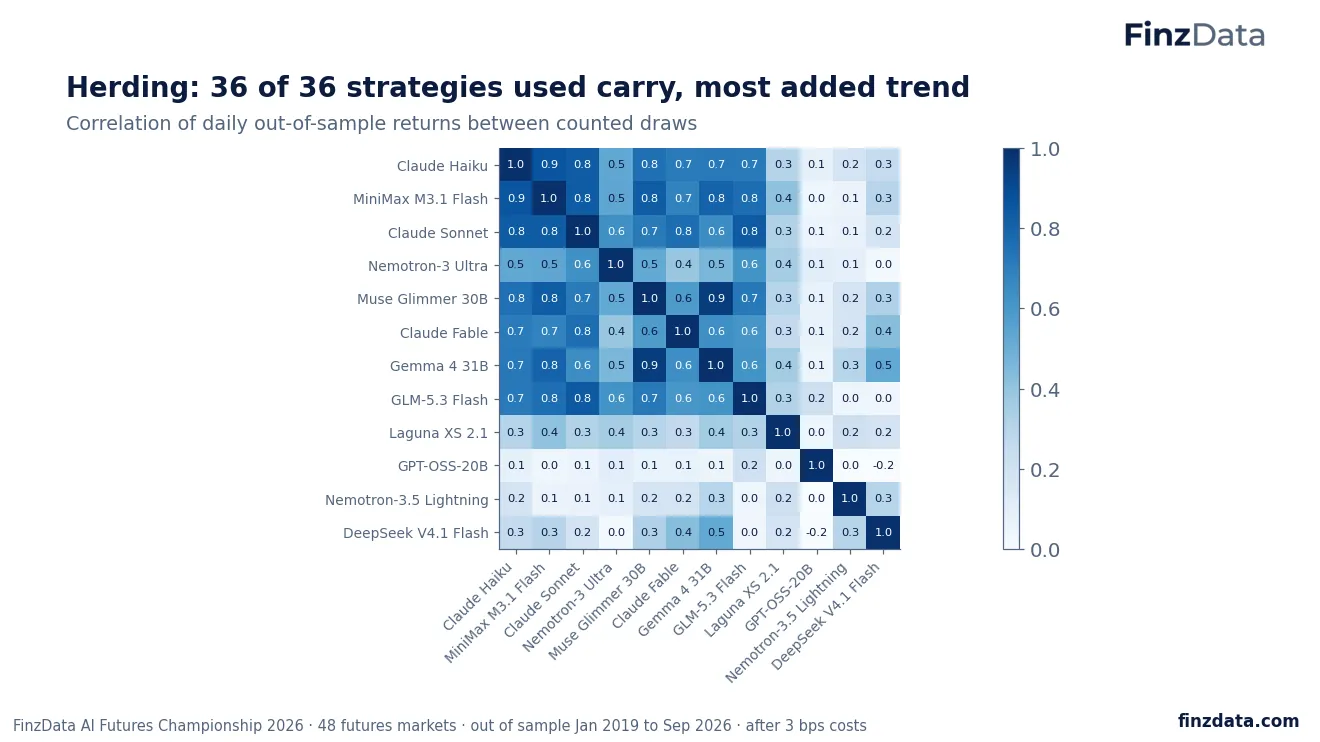
All 36 draws used carry, and most paired it with a 6 to 12-month trend term. That is a sensible prior, since both are among the best-documented premia in futures, but it made the field crowded: the top three counted strategies had return correlations of 0.83 to 0.86 with each other. GPT-OSS-20B was the outlier, with an average correlation of 0.04 to the rest, from a breakout and carry mix rebalanced weekly.
9. What the blind judges rewarded
Three judges, Claude Opus, Mistral Large 4 and StepFun Step-5, scored each strategy from 0 to 10 without seeing any results. They agreed with each other closely (pairwise correlations 0.89 to 0.93). Their scores ranked with the out-of-sample record at 0.40 but with the in-sample record at 0.75: a well-argued idea looked like a good backtest more than a good forecast.
Claude entries scored 1.7 points higher on average than others with every judge. Part of that follows performance, and part may be clearer falsification tests, but some of it may be a family preference, which is why Round 2 changes the panel. Monthly designs scored 6.7 against 5.4 for weekly ones, so the judges did reward the lower-turnover choice.
10. The winner: Claude Haiku
The winning signal is zscore(ret(252)/vol(252)) + 0.5*zscore(carry()): twelve-month return divided by twelve-month volatility, standardised across markets, plus half-weight carry, rebalanced monthly. It is close to the trend benchmark (correlation 0.81) but added an information ratio of +0.23 on top of it. Its stated test was that the blend must clearly beat the trend benchmark out of sample; it did, narrowly.
After 36 trials, its deflated Sharpe probability is 0.41, well short of the 0.95 that would mark it as skill rather than selection. We report that plainly: this is a championship result, not a proven strategy.
11. Lessons and Round 2 changes
Four things shaped the results more than model size. The example signal in the brief pulled seven draws toward it. Weekly trading cost more than any idea gained. Judges rewarded clear writing that matched in-sample results. 3 signals were submitted twice by the same or different models. Kimi K2.6 could not be reached and was left out, and StepFun Step-5 replaced Gemini on the panel after two timeouts.
Round 2 will run with no example signal, turnover reported in the brief, a judge panel with no model from the same family as any entrant, and redraws for duplicates.
Frequently asked questions
Which AI model is best at trading futures?
In this championship Claude Haiku won with an out-of-sample Sharpe of 0.75 from 2019 to September 2026, the only one of 12 models above the 12-month trend benchmark (0.65). MiniMax M3.1 Flash was second at 0.64.
Did any AI model beat trend following?
One did, narrowly: Claude Haiku added an information ratio of +0.23 over the trend benchmark. The difference is within statistical noise over this sample.
What signals did the AI models use?
All 36 strategies used futures carry (roll yield), and most combined it with 6 to 12-month trend. Monthly rebalancing did far better than weekly.
How was the test kept fair?
Every strategy ran on the same engine, markets, 10% volatility target, next-session execution and costs. Models designed on 2009 to 2018 and were scored once on 2019 to September 2026. Judges saw no results.
Can I test my own futures strategy on this data?
Yes. FinzData covers 139 futures markets with every contract since 2007, roll calendars and back-adjusted series, by Python, REST or the MCP server for AI agents.
Download the deck (PDF, 11 slides) More research
Download the full paper (PDF, 11 slides) Open the live results dashboard
Related
- AI Trading Tournament: US stocks
- AI Trading Championship 2026 paper (stocks)
- Continuous futures data
- Why most backtests lie
Run it yourself: pip install finzdata · 139 futures markets with every contract since 2007, roll calendars and back-adjusted series; 16,000+ US stocks since 2000; 18,000+ macro series with every vintage. See plans.
Built for AI, quants, data scientists and financial analysts who backtest. Clean data. Real insights. Real alpha. finzdata.com. This material is for information only and is not investment advice. Data sources: FinzData futures (139 markets, every contract since 2007); FinzData AI Futures Championship engine.
Get FinzData research free, every morning
The daily brief: what moved, the macro releases that matter, positioning and liquidity, with charts. One email a day, free, unsubscribe anytime.