
FinzData Research · Published 9 November 2026
The Deleveraging Week: why the stock market is down
The S&P 500 fell 2.68% for a fourth straight weekly loss and the Nasdaq-100 4.91%, yet the average stock lost only 1.0%. Is the AI bubble bursting, or is this a positioning flush? ES and NQ futures levels, gamma exposure, hedge-fund de-grossing, oil and the Strait of Hormuz, the CPI report and Fed hike odds, with J.P. Morgan, Goldman Sachs and Bloomberg Intelligence research. 48 slides.
Get FinzData research free, every morning
The daily brief: what moved, the macro releases that matter, positioning and liquidity, with charts. One email a day, free, unsubscribe anytime.
Contents
- Contents
- Key takeaways
- The week at a glance
- Section 1: Markets
- The week across assets
- Fourteen weeks of the S&P 500, Nasdaq-100 and Russell 2000
- Sectors: energy and chips led the losses
- Cap weight vs equal weight: a concentration unwind
- Factors and style
- International markets
- Europe
- Section 2: ES & NQ futures
- ES and NQ futures
- ES and NQ key levels
- Section 3: The AI trade
- Inside the AI complex
- AI valuations: the de-rating
- Biggest movers
- AI capex math and the backlash
- SpaceX and the indexes
- AI power and the election
- Section 4: Positioning & flows
- Hedge-fund positioning
- Systematic selling and fund flows
- Positioning thermometer
- Dealer gamma (GEX): short gamma
- Volatility curve in backwardation
- Section 5: Energy & geopolitics
- Oil and the Strait of Hormuz
- Middle East scenarios for oil
- Energy equities
- Goldman Sachs: election read-through for energy and power
- Section 6: Rates, macro & earnings
- The 10-year Treasury yield
- Rates and credit desk views
- Inflation and labor
- The FinzData Quantitative Model
- Earnings season and EPS
- Street targets
- Section 7: Policy & outlook
- Midterm history
- Washington and market structure
- Street views vs the data
- Our read
- Scenarios
- What to watch this week
- The data behind this briefing
- Frequently asked questions
1. Weekly Briefing: The Deleveraging Week
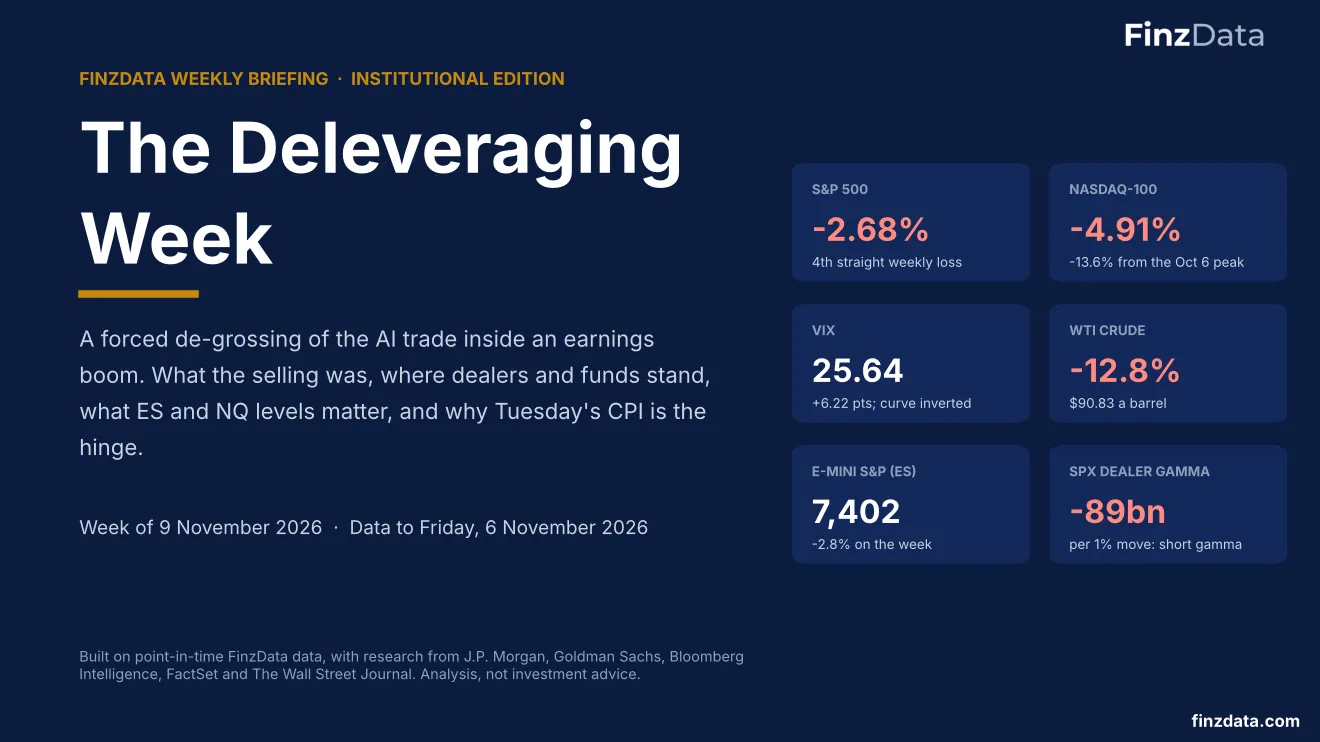
FinzData Weekly Briefing, week of November 9, 2026.
2. Contents
Contents.
3. Key takeaways
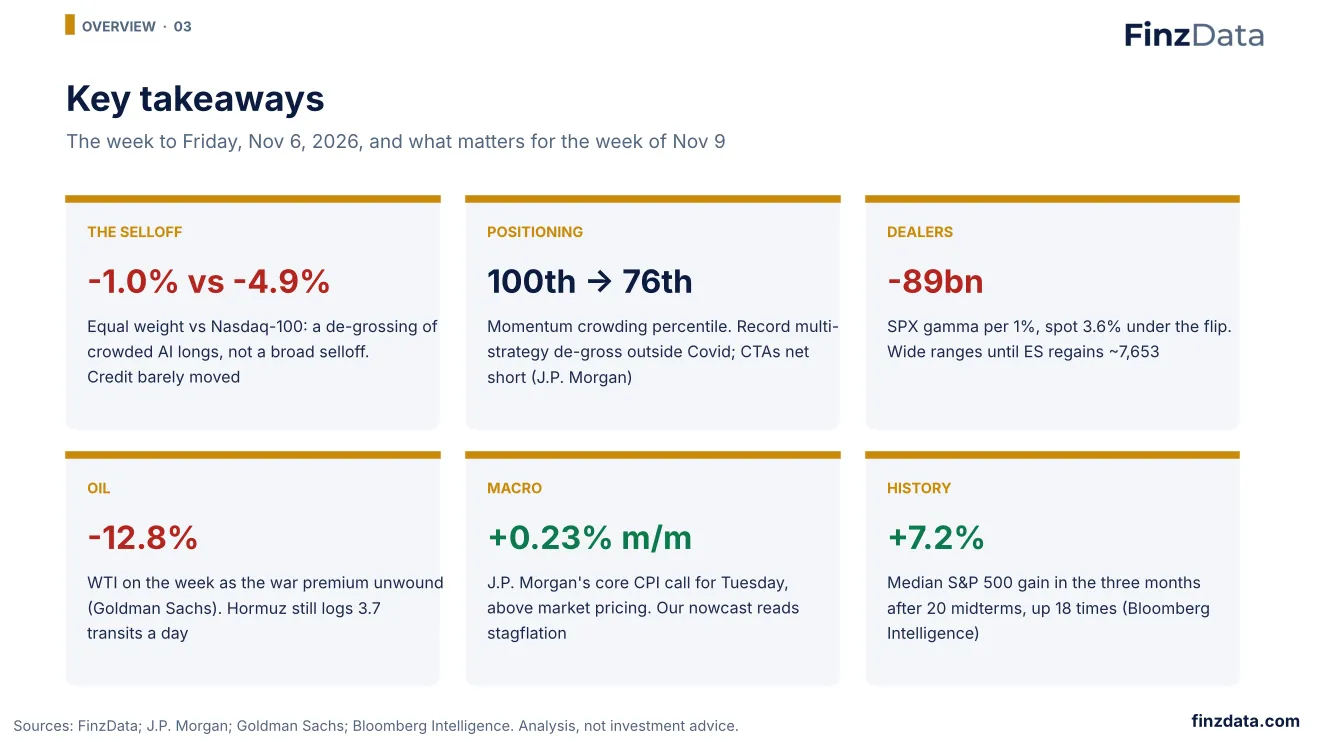
Key takeaways.
Last week was a de-grossing of crowded AI positions rather than a broad equity liquidation. Hedge funds cut gross exposure at the fastest 20-day pace outside Covid, momentum crowding reset, systematic funds turned net short and dealers are short gamma. Oil fell as the Middle East risk premium unwound, although tanker traffic through Hormuz has not recovered. Tuesday's CPI decides whether the bond rally and a stabilization in equities can continue; the Street's year-end targets sit near 8,000, and midterm history favours the three months after an election.
4. The week at a glance
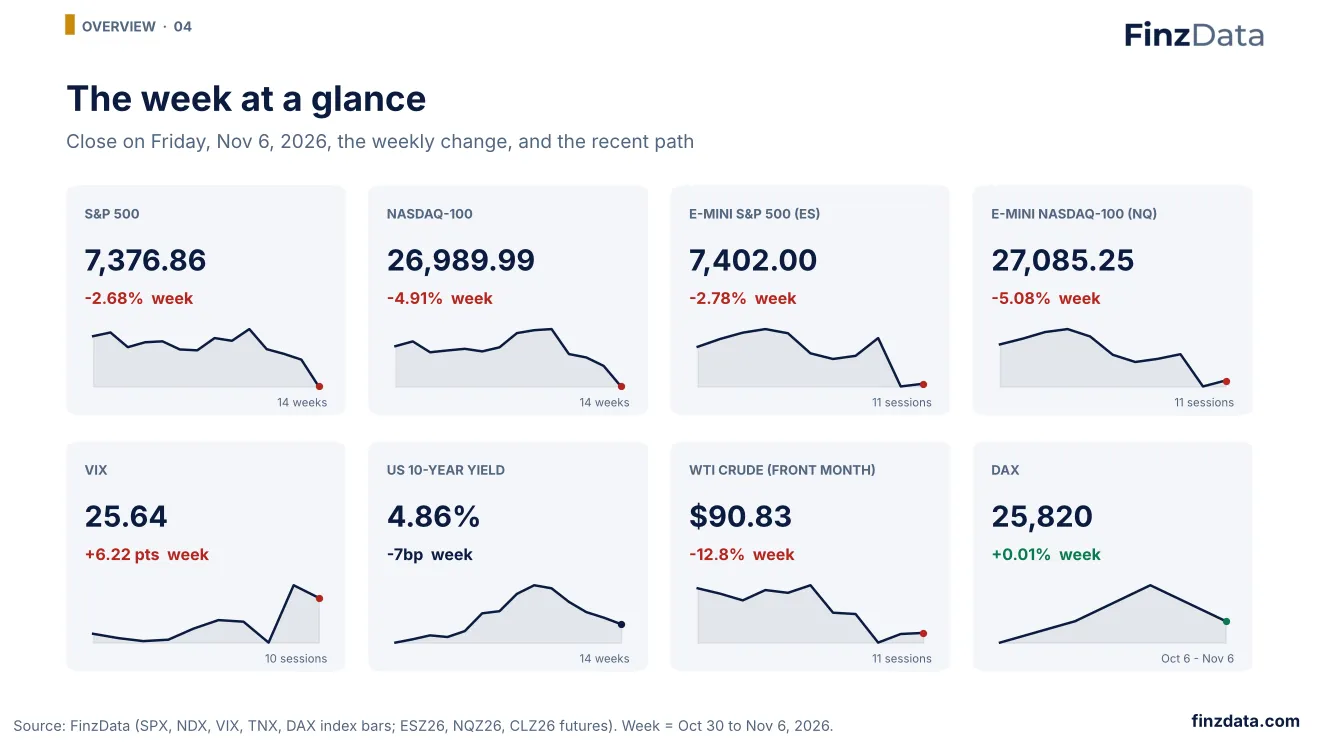
The week at a glance.
The S&P 500 lost -2.68% in the week to November 6, its fourth weekly decline in a row and -5.6% since October 9. It closed -5.7% below the October 6 record. The Nasdaq-100 fell -4.91% and is -13.6% from its high, while the equal-weight S&P 500 (RSP) lost only -1.0%: the selling was concentrated in the largest AI-linked names. The VIX ended at 25.64, WTI crude fell -12.8% to $90.83 and the 10-year Treasury yield slipped to 4.86%.
5. Section 1: Markets
Section 1: Markets.
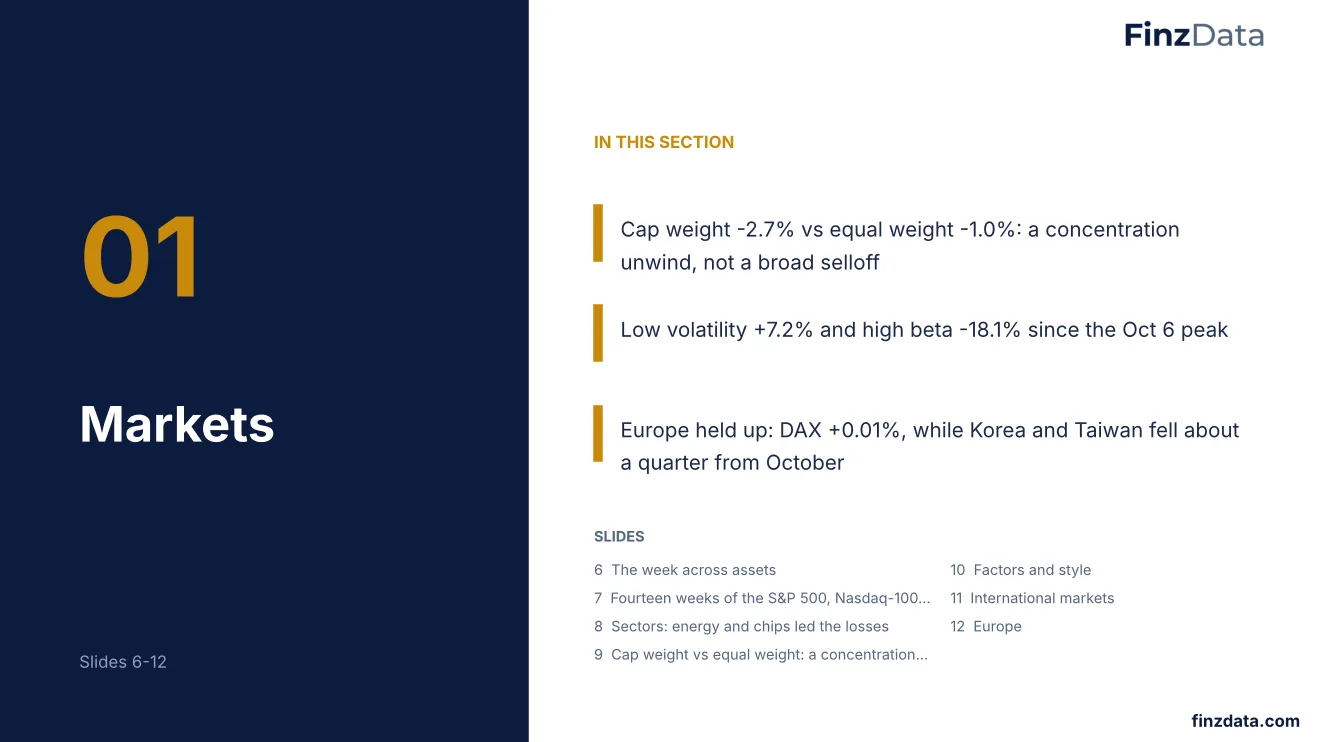
Cap weight -2.7% vs equal weight -1.0%: a concentration unwind, not a broad selloff. Low volatility +7.2% and high beta -18.1% since the Oct 6 peak. Europe held up: DAX +0.01%, while Korea and Taiwan fell about a quarter from October.
6. The week across assets
The week across assets.
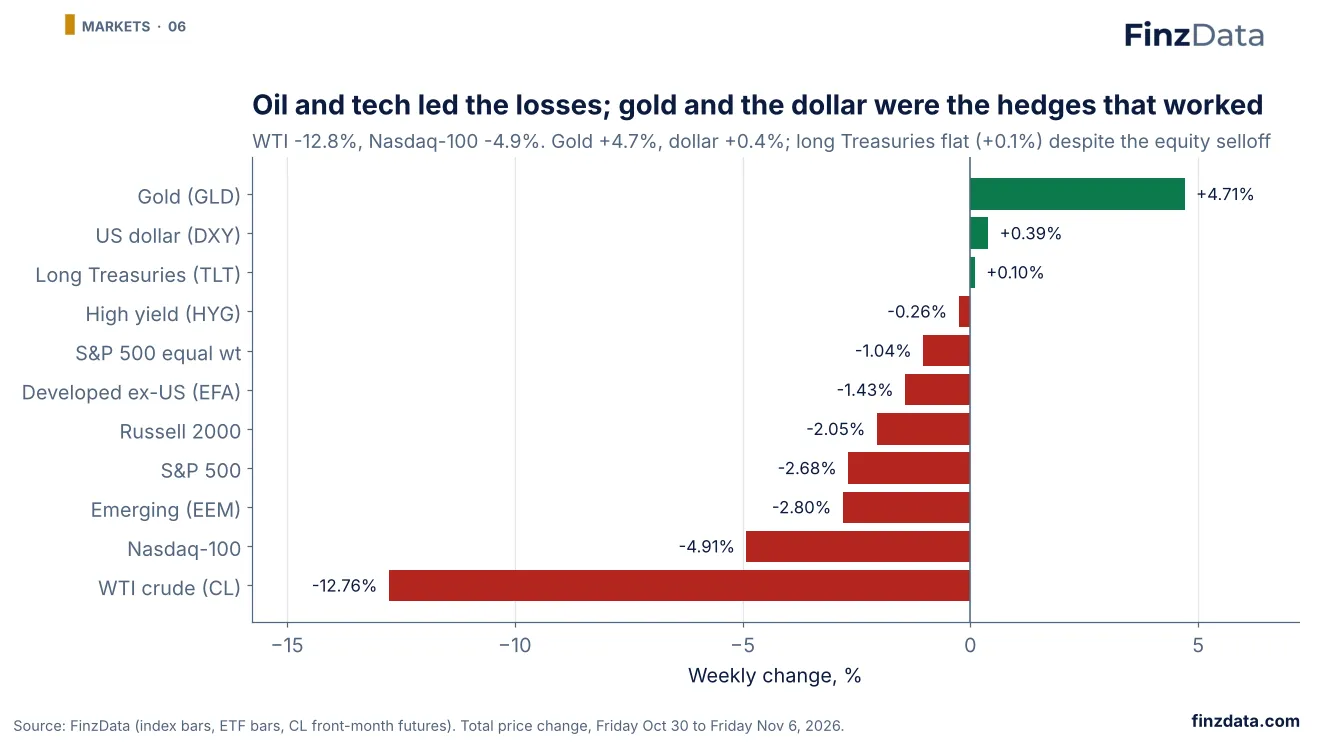
Across assets, WTI crude (-12.8%) and the Nasdaq-100 (-4.9%) took the heaviest losses. Gold rose +4.7% and the dollar index +0.4%. Long Treasuries barely moved (+0.1%) even with equities under pressure, and high-yield credit (HYG) slipped only -0.3%: credit and rates did not confirm an economic scare, which points to a positioning event in equities.
7. Fourteen weeks of the S&P 500, Nasdaq-100 and Russell 2000
Fourteen weeks of the S&P 500, Nasdaq-100 and Russell 2000.
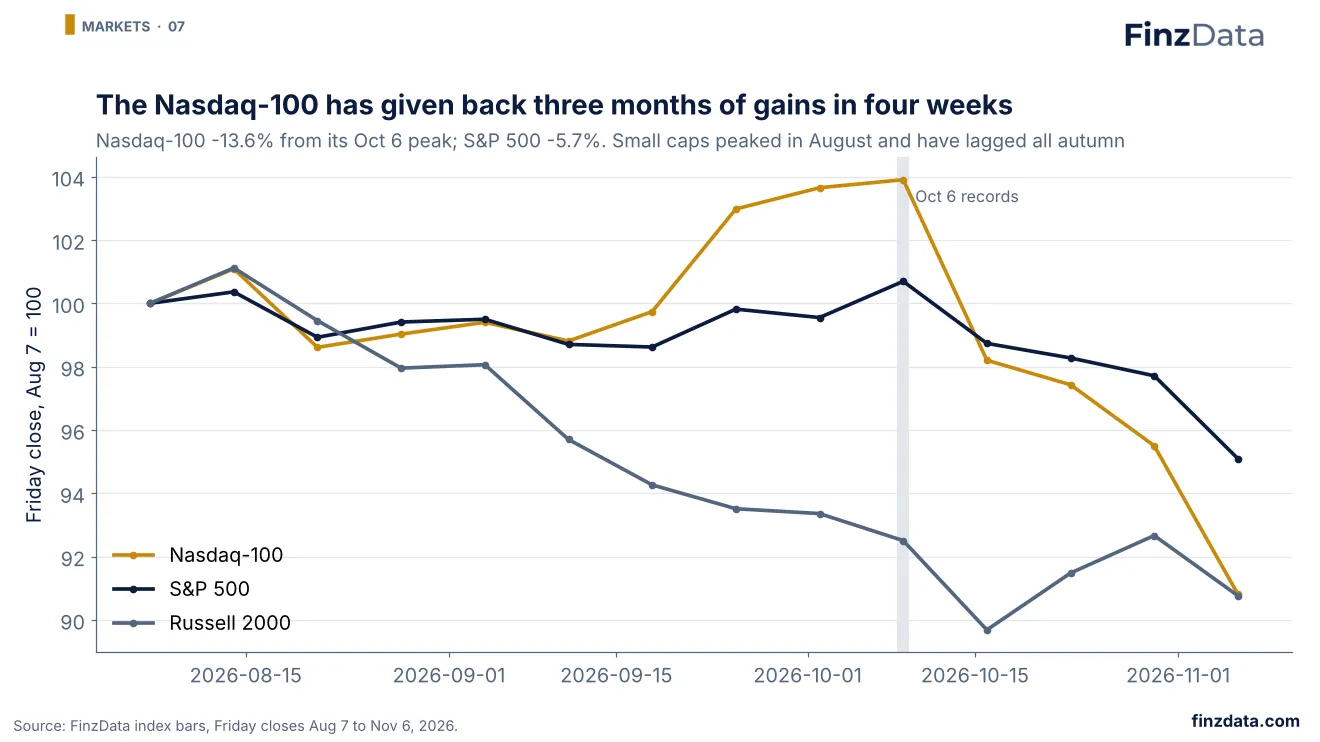
Rebased to August 7, the Nasdaq-100 is now below where it started the period, after setting records on October 6. It is -13.6% from that peak, against -5.7% for the S&P 500. The Russell 2000 peaked in mid-August and has trended lower since, so the autumn weakness in small caps predates the AI unwind.
8. Sectors: energy and chips led the losses
Sectors: energy and chips led the losses.
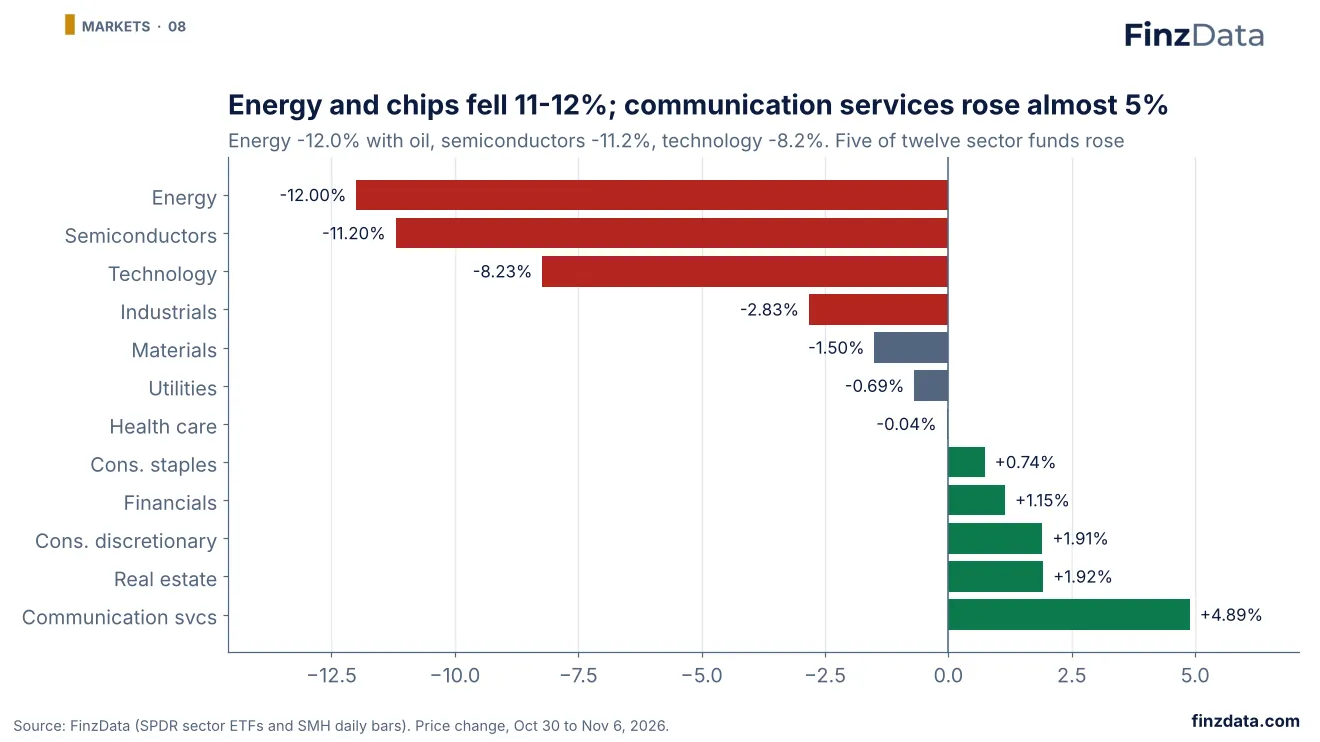
Energy (-12.0%) and semiconductors (-11.2%) fell hardest, followed by technology (-8.2%). Communication services rose +4.9%, and real estate, consumer discretionary, financials and staples also gained. Five of twelve sector funds finished higher in a week the S&P 500 lost 2.7%: a rotation inside the market, not a liquidation of all of it.
9. Cap weight vs equal weight: a concentration unwind
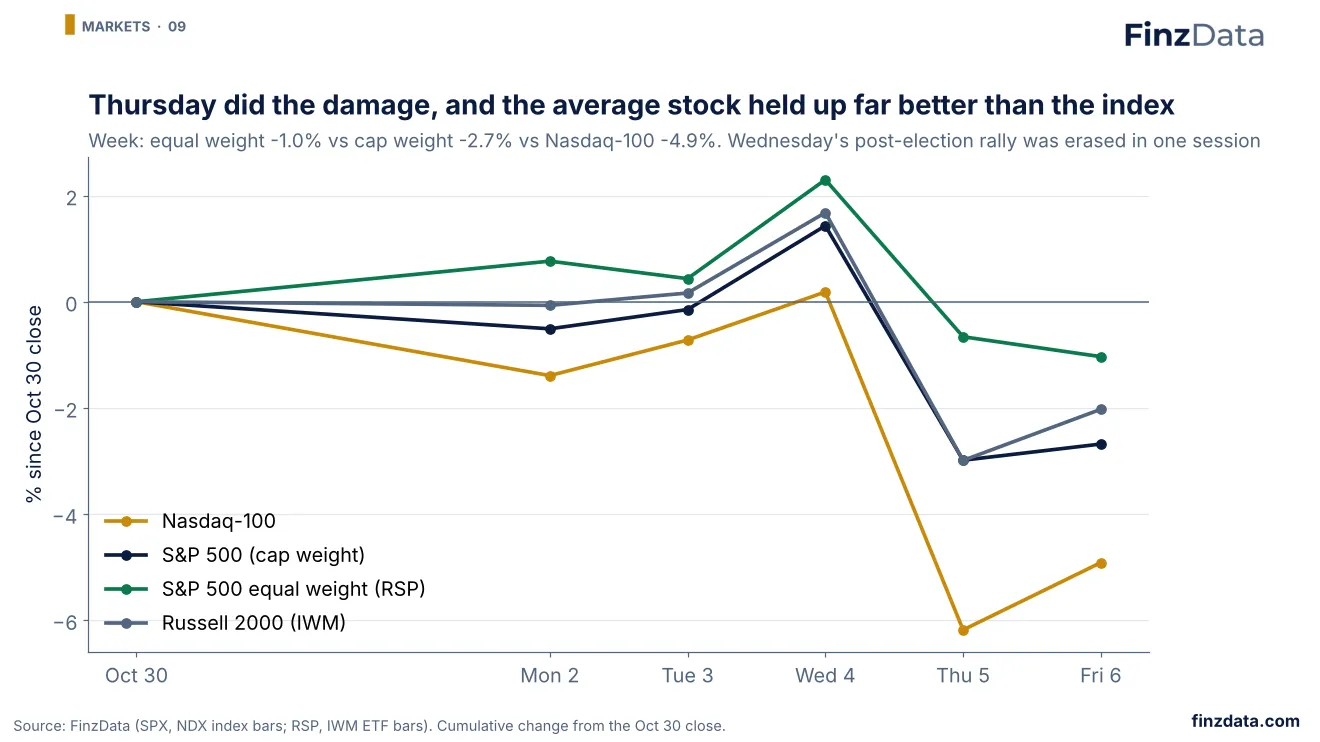
Cap weight vs equal weight: a concentration unwind.
Wednesday's post-election rally lifted every gauge, then Thursday erased it. Over the week the equal-weight S&P 500 lost -1.0%, the cap-weighted index -2.7% and the Nasdaq-100 -4.9%. The 1.6-point gap between equal and cap weight is the signature of de-grossing in crowded mega-cap longs rather than a broad sell-everything move.
10. Factors and style
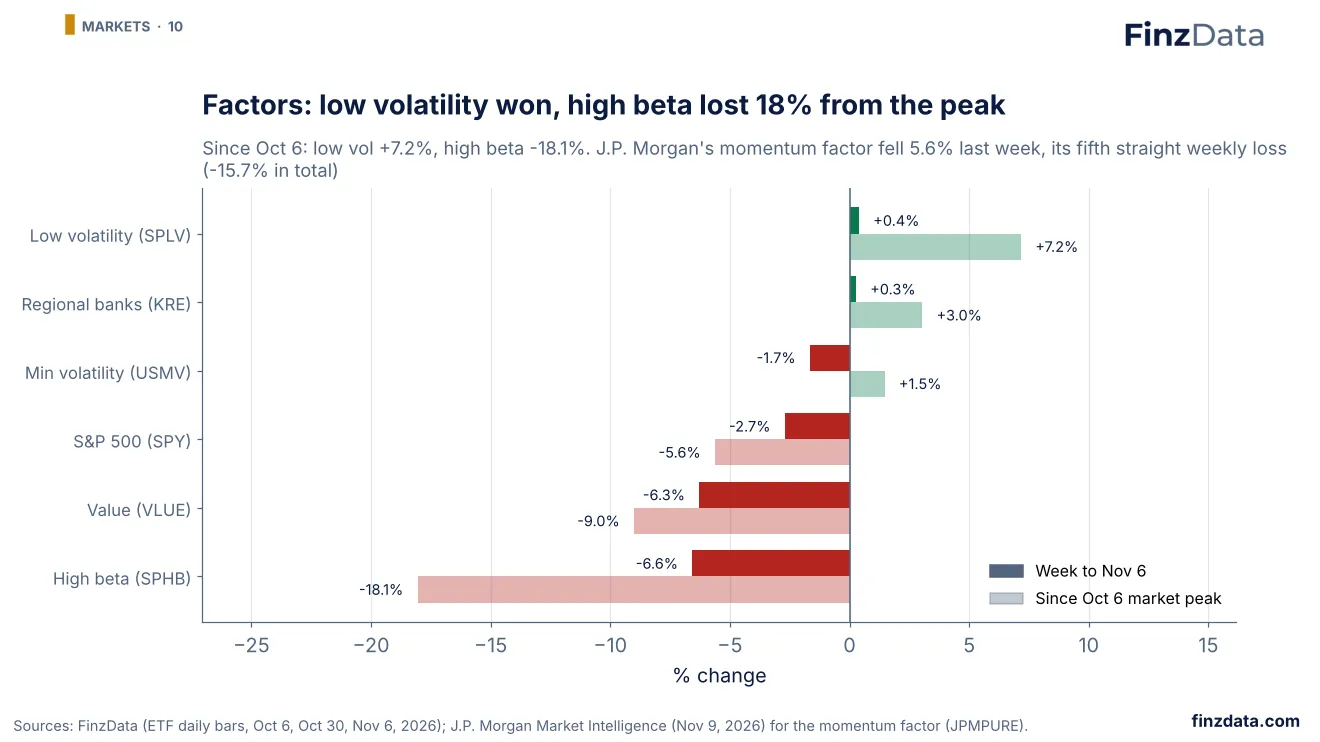
Factors and style.
Factor returns tell the same story as sectors. Since the October 6 peak, the S&P 500 low-volatility ETF is up +7.2% while high beta is down 18.1%. J.P. Morgan reports its momentum factor fell 5.6% last week, its fifth straight weekly decline and 15.7% in total; October was the largest monthly unwind for long momentum, about 11%, roughly a six-standard-deviation move, taking momentum long/short about 40% off its peak. J.P. Morgan's strategists argue low vol is now less compelling after its move from the 0th to the 25th percentile.
11. International markets
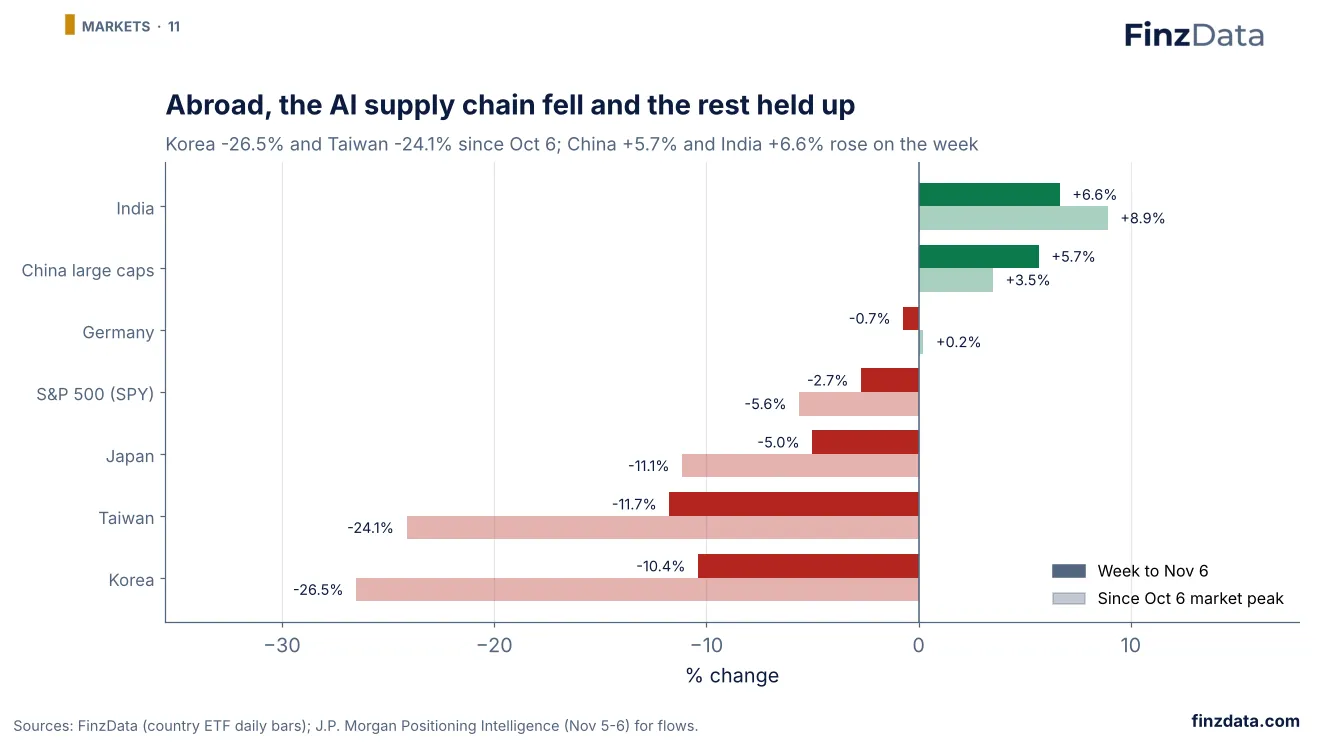
International markets.
Outside the US the damage was concentrated in the AI hardware supply chain: Korea -10.4% and Taiwan -11.7% on the week, about a quarter below their October 6 levels. China large caps rose +5.7% and India +6.6%. J.P. Morgan's flow data show hedge funds net buying EMEA and China/Hong Kong while selling North America and Japan; short covering in Europe reached a 3-sigma extreme last seen in late 2022.
12. Europe
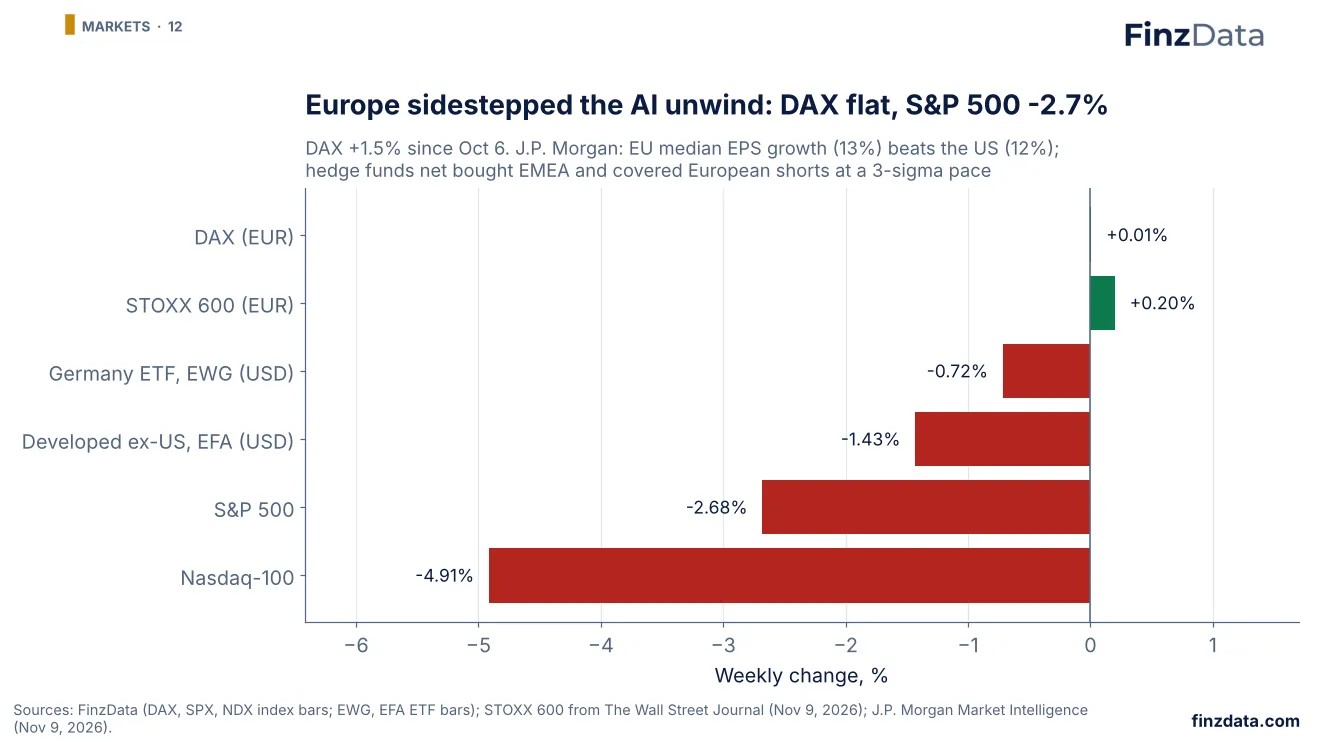
Europe.
European equities sat out most of the AI unwind. The DAX was flat on the week (+0.01%) and is +1.5% above its October 6 level after reaching 26,438 on November 4; the STOXX 600 rose 0.2% (WSJ). J.P. Morgan's flow data show hedge funds net buying EMEA while selling North America, with European short covering at a 3-sigma pace last seen in late 2022. J.P. Morgan notes EU median earnings growth of 13% now exceeds the US at 12% for the first time since late 2024, and recalls the first quarter of 2025, when the STOXX 600 beat the S&P 500 by more than 14 percentage points. In rates, German Bund shorts were covered, the OAT-Bund spread reached its widest in years and short-dated Italian BTPs saw the strongest buying in Europe. Monday morning, J.P. Morgan reported European indexes higher, led by Italy and Spain, with defense and 'ceasefire' baskets outperforming.
13. Section 2: ES & NQ futures
Section 2: ES & NQ futures.
ES -2.8% and NQ -5.1%; Thursday traded 3.5M ES and 1.3M NQ contracts. Open interest rose into the drop (ES +3.4%, NQ +5.9%): new hedges and shorts. Gamma flip near ES 7,653; put wall near ES 7,025.
14. ES and NQ futures
ES and NQ futures.
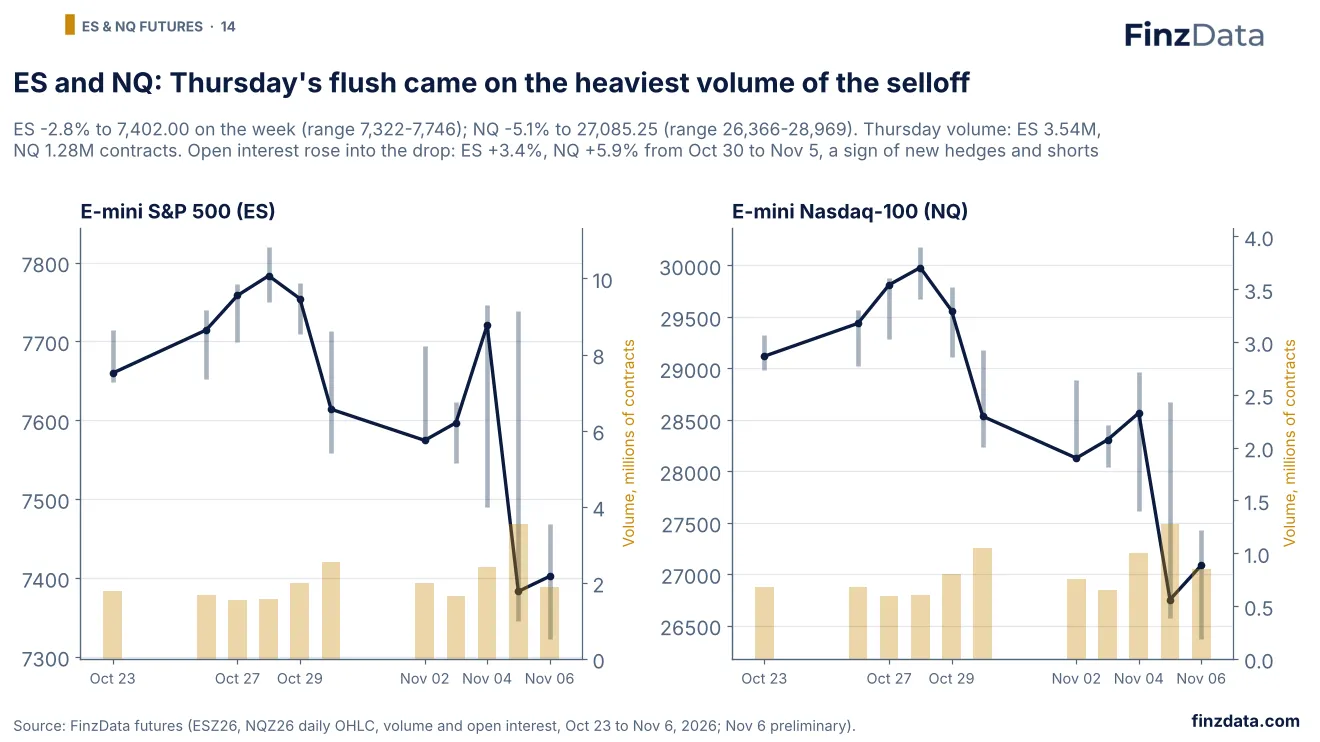
The front-month E-mini S&P 500 (ES) fell 2.8% on the week to 7,402.00, trading a 424-point range; the E-mini Nasdaq-100 (NQ) lost 5.1% to 27,085.25 over a 2,602-point range. Thursday was the heaviest session of the month: 3.54 million ES and 1.28 million NQ contracts. Open interest rose +3.4% in ES and +5.9% in NQ between October 30 and November 5 while prices fell, which points to new hedges and short positions rather than long liquidation alone. Every ES and NQ contract since 2007, with 1-minute bars, is in FinzData.
15. ES and NQ key levels
ES and NQ key levels.
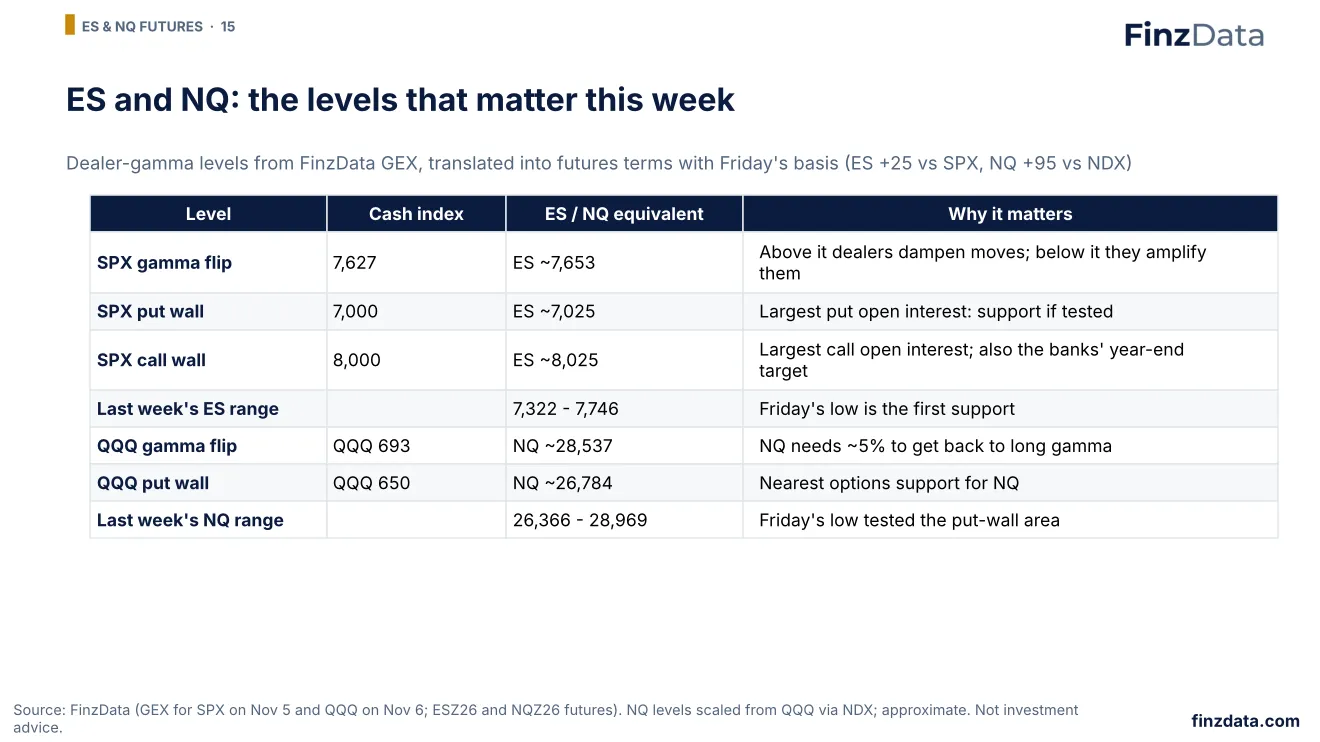
For futures traders, FinzData's dealer-gamma levels translate into ES and NQ terms using Friday's basis. The SPX gamma flip at 7,627 is about 7,653 in ES; the 7,000 put wall is about 7,025 and the 8,000 call wall about 8,025. For NQ, the QQQ gamma flip maps to roughly 28,537 and the QQQ put wall to roughly 26,784. These levels move daily with open interest; FinzData publishes point-in-time GEX every evening.
16. Section 3: The AI trade
Section 3: The AI trade.
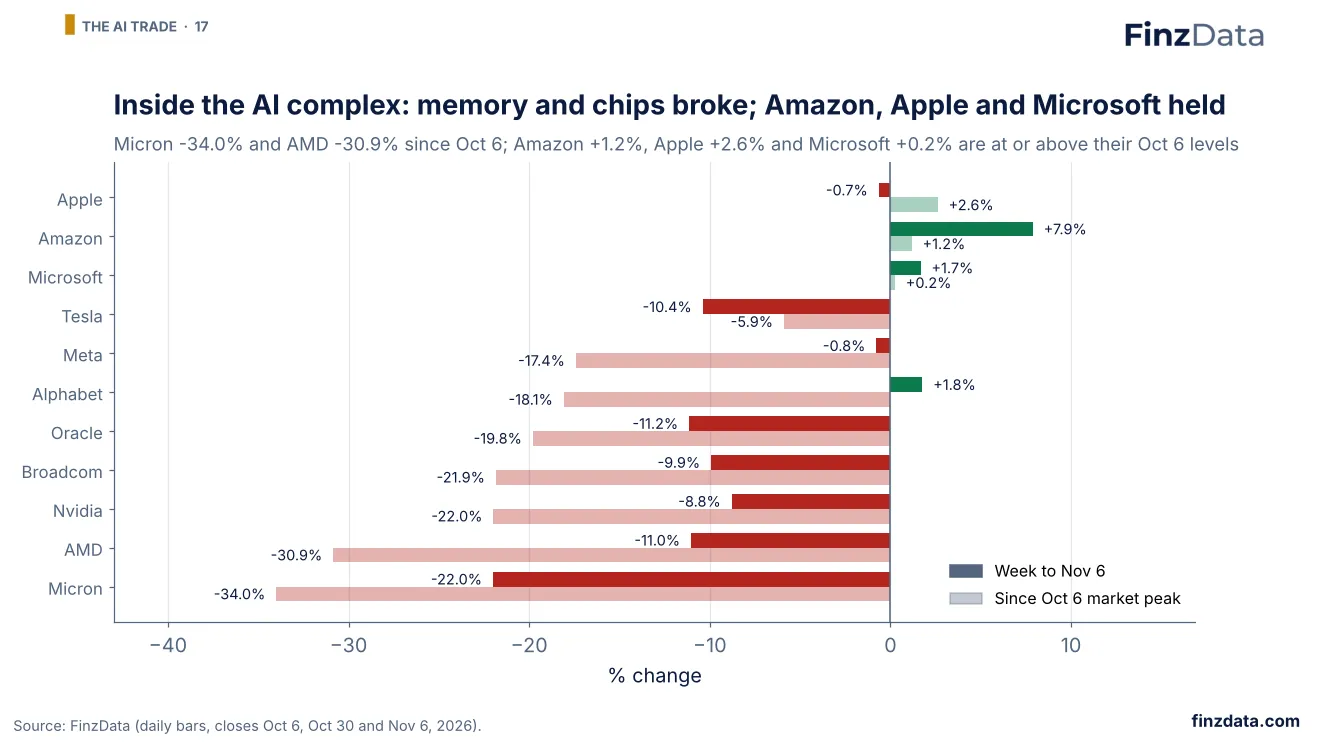
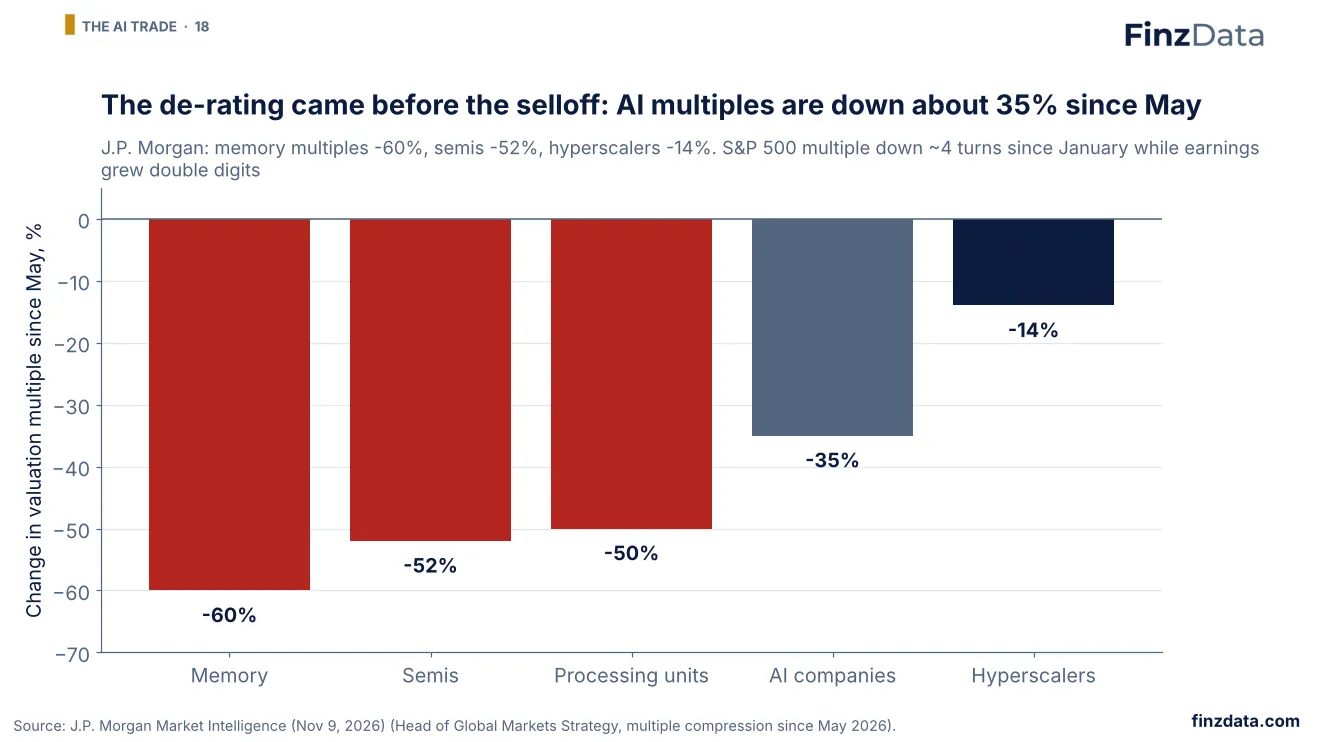
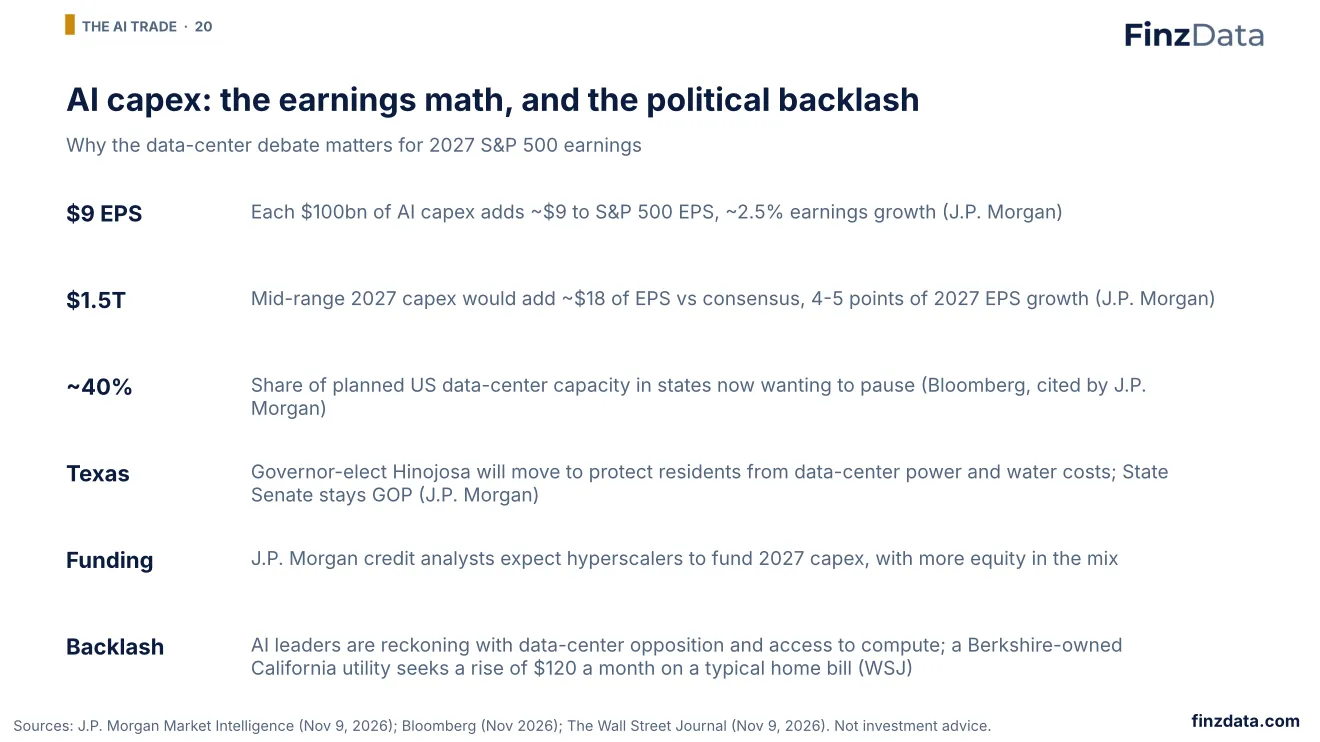
Micron -34.0% and AMD -30.9% since Oct 6; Amazon, Apple, Microsoft held. AI multiples down ~35% since May; memory -60%, semis -52% (J.P. Morgan). Each $100bn of AI capex is worth ~$9 of S&P 500 EPS (J.P. Morgan).
17. Inside the AI complex
Inside the AI complex.
The unwind was selective. Micron lost 22.0% last week and is 34.0% below its October 6 close; AMD, Broadcom, Nvidia and Oracle are 20-31% lower. Amazon rose +7.9% on the week and is above its October 6 level, as are Apple and Microsoft. J.P. Morgan estimates AI multiples have compressed about 35% since May, including semis 52%, memory 60% and hyperscalers 14%, and sees the positioning flush as an attractive entry point for AI upstream names.
18. AI valuations: the de-rating
AI valuations: the de-rating.
J.P. Morgan's strategists calculate that AI-linked multiples have compressed about 35% since May: memory 60%, semiconductors 52%, processing units 50% and hyperscalers 14%. The S&P 500 multiple has fallen roughly four turns since January, one of the sharpest de-ratings outside a recession, while earnings grew at double-digit rates. Prices are falling faster than earnings, which is how a valuation reset differs from an earnings recession.
19. Biggest movers
Biggest movers.
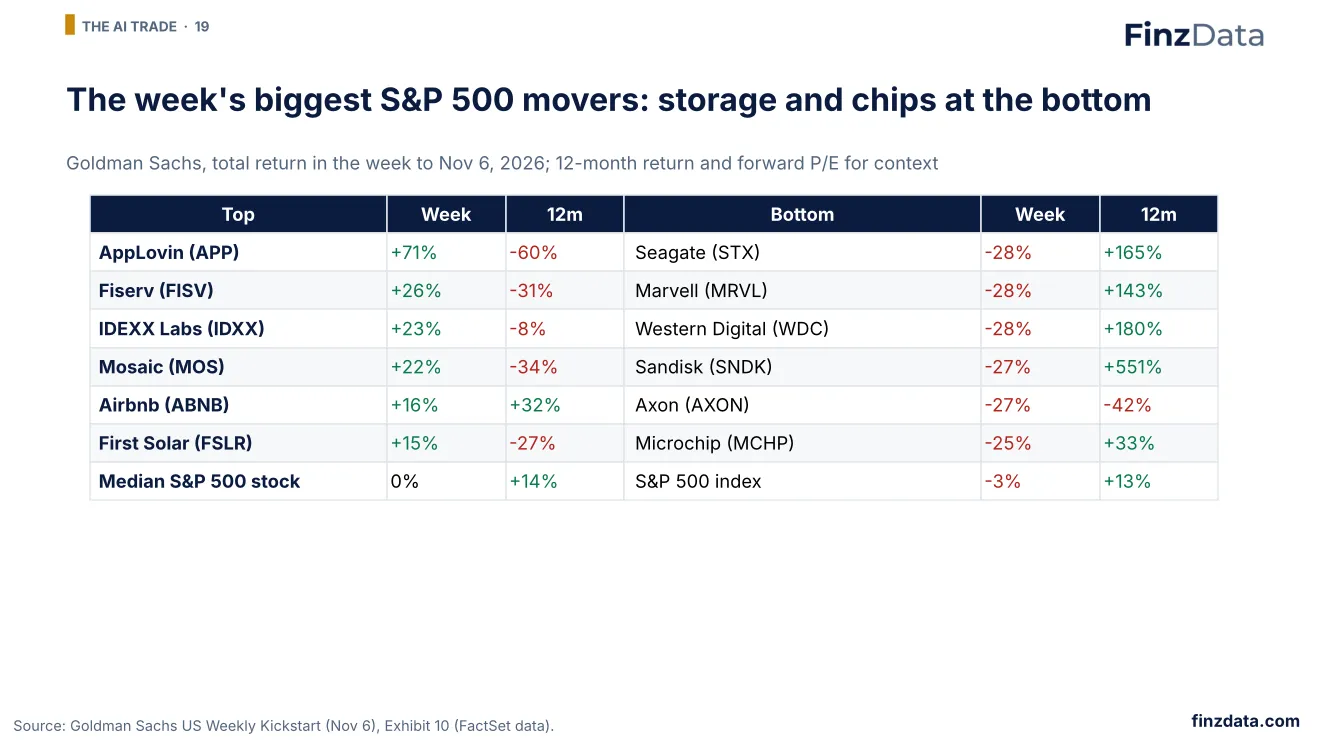
Goldman Sachs' mover tables show the pattern: the worst performers were the year's biggest winners in storage and semiconductors, Seagate, Western Digital, Sandisk and Marvell, each down 27-28% on the week after 12-month gains of 143-551%. The best performers were mostly last year's laggards. The median S&P 500 stock was flat on the week while the index fell 3%.
20. AI capex math and the backlash
AI capex math and the backlash.
J.P. Morgan estimates every $100 billion of AI capex adds about $9 to S&P 500 earnings per share, so a mid-range $1.5 trillion of 2027 spending would add about $18 against consensus. The risk is political: about 40% of planned US data-center capacity sits in states that want to pause, and Texas' governor-elect has promised protections on power and water costs. J.P. Morgan sees the midterms as a clearing event and expects data-center headwinds to be less onerous than priced; The Wall Street Journal reports AI leaders are reckoning with what the backlash means for compute.
21. SpaceX and the indexes
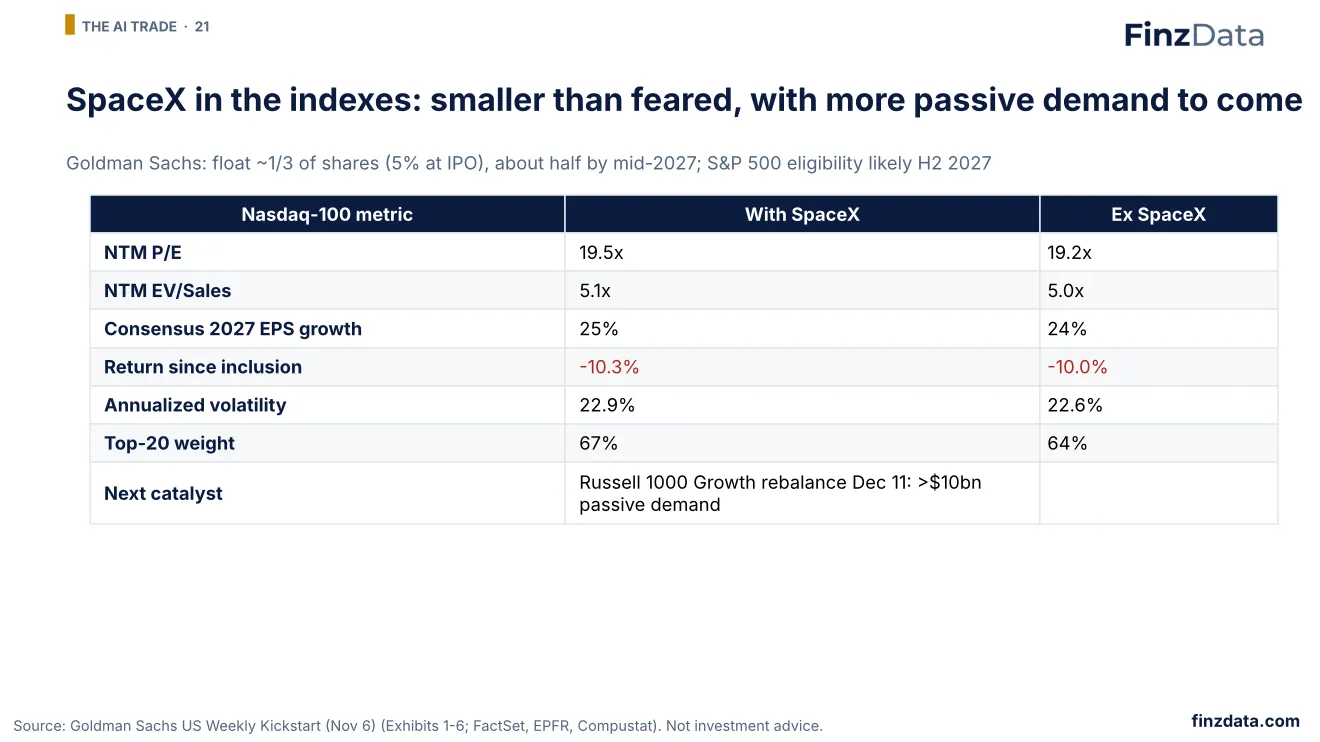
SpaceX and the indexes.
Goldman Sachs finds SpaceX's index impact much smaller than feared. Its float has risen to about a third of shares from 5% at the IPO, and ETFs owned about $30 billion of the stock at the end of October. Excluding SpaceX would lower the Nasdaq-100's P/E by less than half a turn, and index return and volatility are almost identical with or without it. The next flow event is the Russell 1000 Growth rebalance on December 11, which Goldman estimates would drive more than $10 billion of passive buying; S&P 500 eligibility is likely in the second half of 2027.
22. AI power and the election
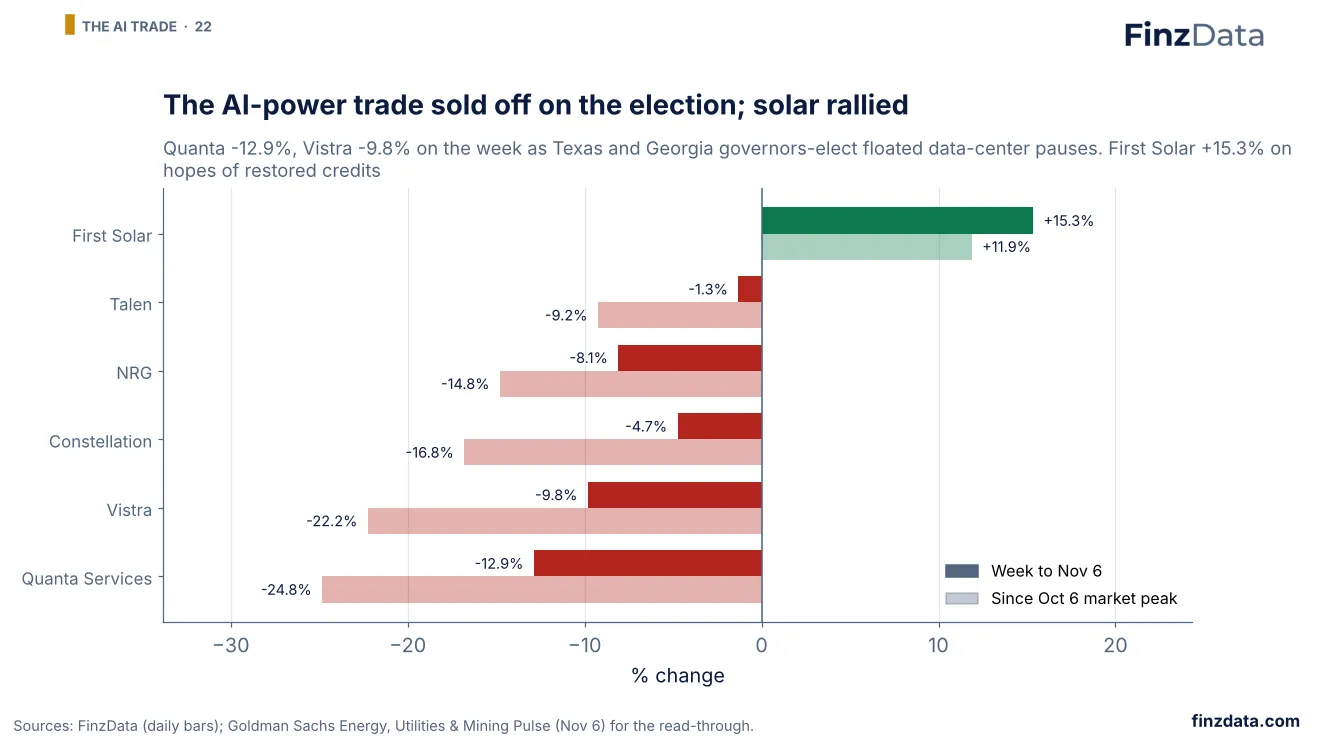
AI power and the election.
Power and grid names with data-center exposure fell after Tuesday's elections: Quanta Services -12.9%, Vistra -9.8%, NRG -8.1%. Goldman Sachs' utilities team sees the data-center risk in Texas and Georgia as mainly a timing issue rather than a demand issue, and calls the 20%+ drop in specialty contractors such as PWR and MTZ overdone. First Solar rose +15.3%: Goldman notes a Democratic House lowers the risk of further credit cuts, and after the 2018 midterms the TAN solar ETF rose about 40% over the following year.
23. Section 4: Positioning & flows
Section 4: Positioning & flows.
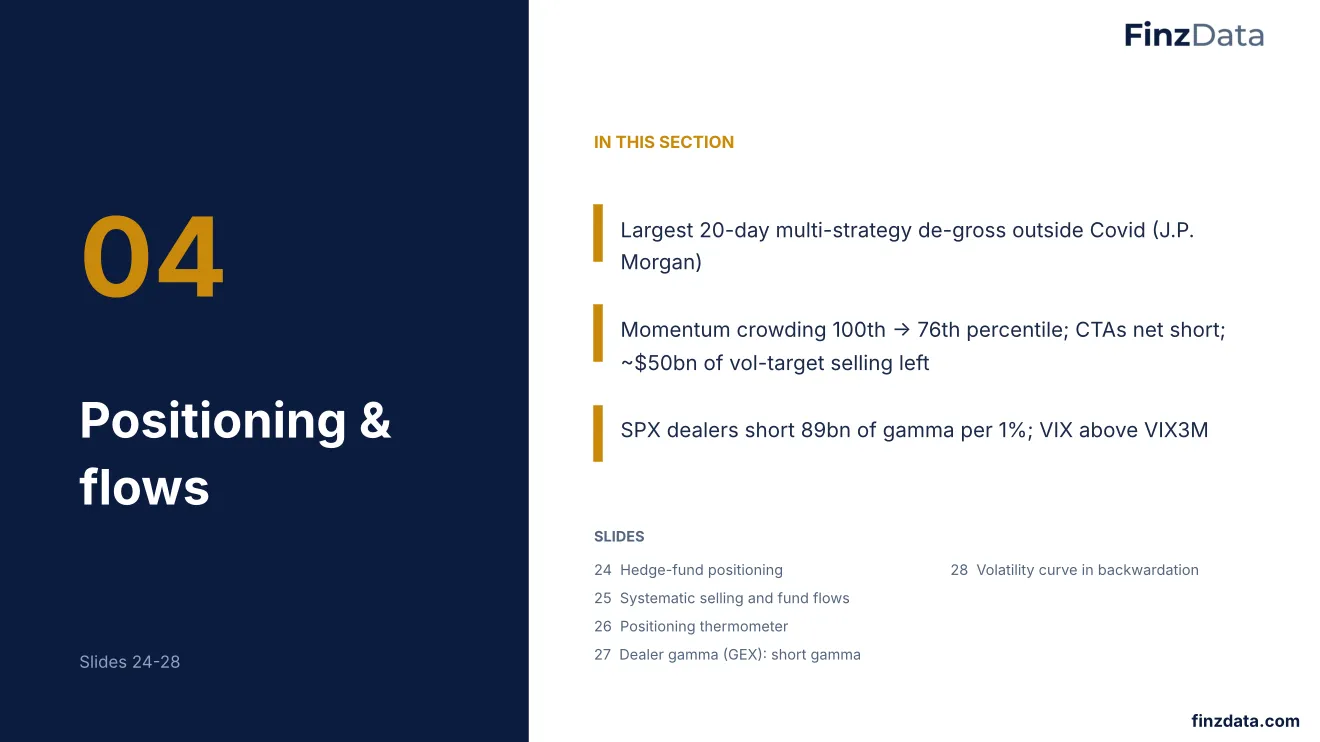
Largest 20-day multi-strategy de-gross outside Covid (J.P. Morgan). Momentum crowding 100th -> 76th percentile; CTAs net short; ~$50bn of vol-target selling left. SPX dealers short 89bn of gamma per 1%; VIX above VIX3M.
24. Hedge-fund positioning
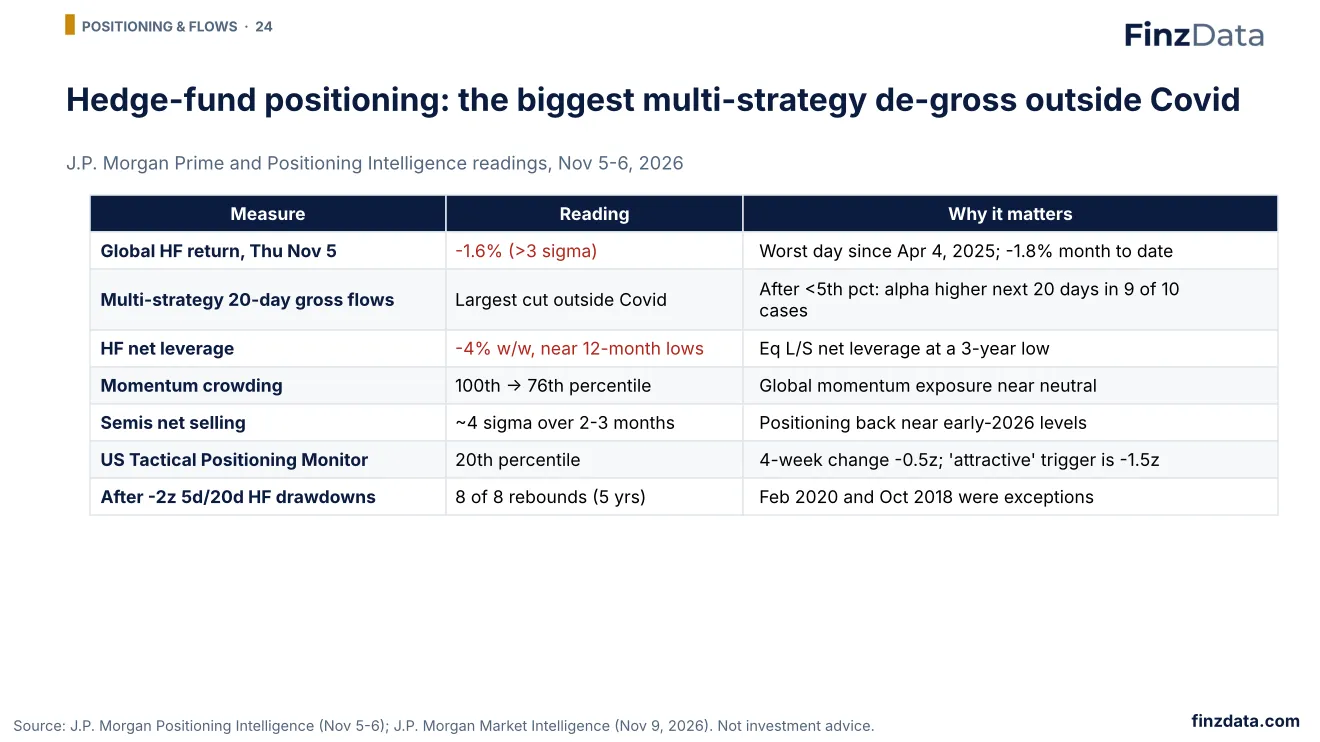
Hedge-fund positioning.
J.P. Morgan's prime and positioning data show hedge funds lost 1.6% globally on Thursday, more than three standard deviations and the worst day since April 4, 2025. Multi-strategy funds cut gross exposure by the most over 20 days outside Covid; in the past, once that measure fell below the 5th percentile, alpha was higher over the next 20 days in 9 of 10 cases. Net leverage is near 12-month lows and momentum crowding has dropped from the 100th to the 76th percentile. J.P. Morgan's US Tactical Positioning Monitor is at the 20th percentile but its four-week change has not reached the -1.5z level it treats as an attractive entry.
25. Systematic selling and fund flows
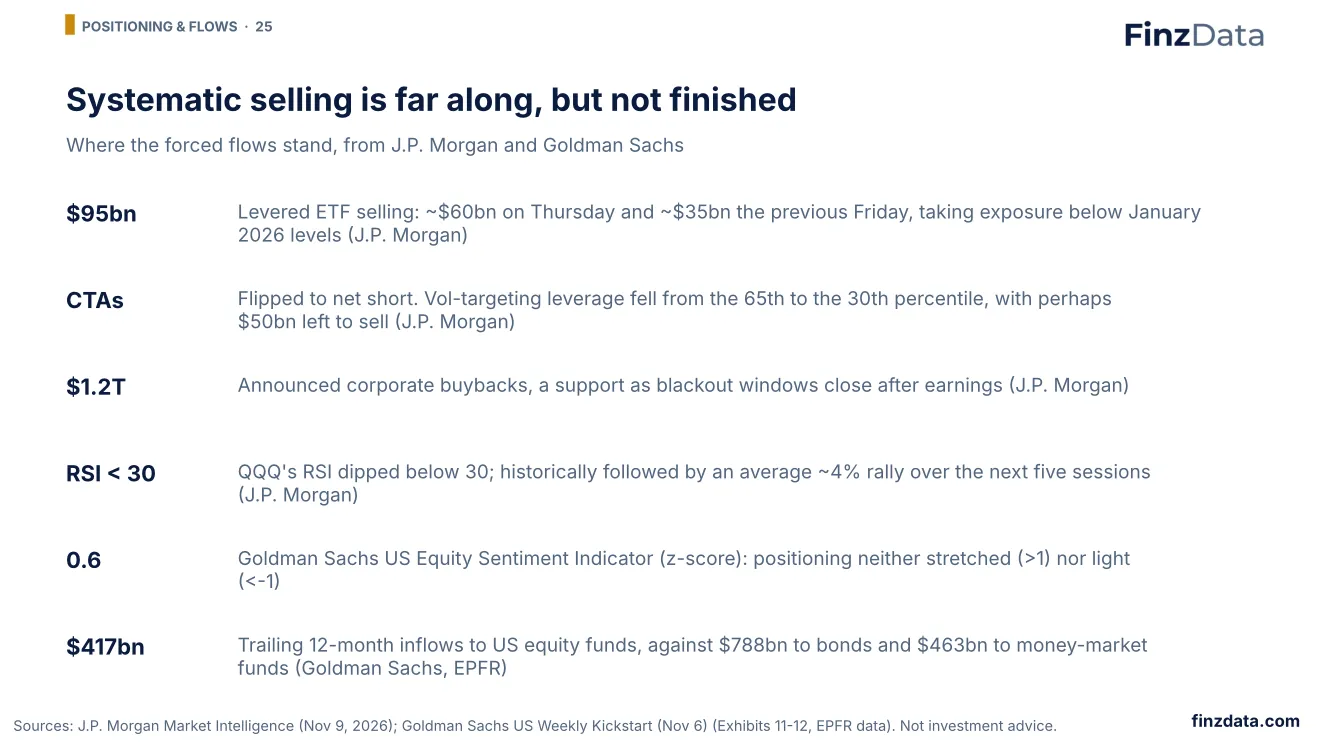
Systematic selling and fund flows.
J.P. Morgan's strategists argue the de-leveraging is far along: leveraged ETFs sold about $60bn on Thursday and $35bn the Friday before, CTAs have flipped net short and volatility-targeting funds have cut leverage from the 65th to the 30th percentile, with perhaps $50bn left to sell. Announced buybacks of $1.2 trillion add support. Goldman Sachs' sentiment indicator is a modest 0.6 standard deviations, so positioning is no longer stretched but not washed out either.
26. Positioning thermometer
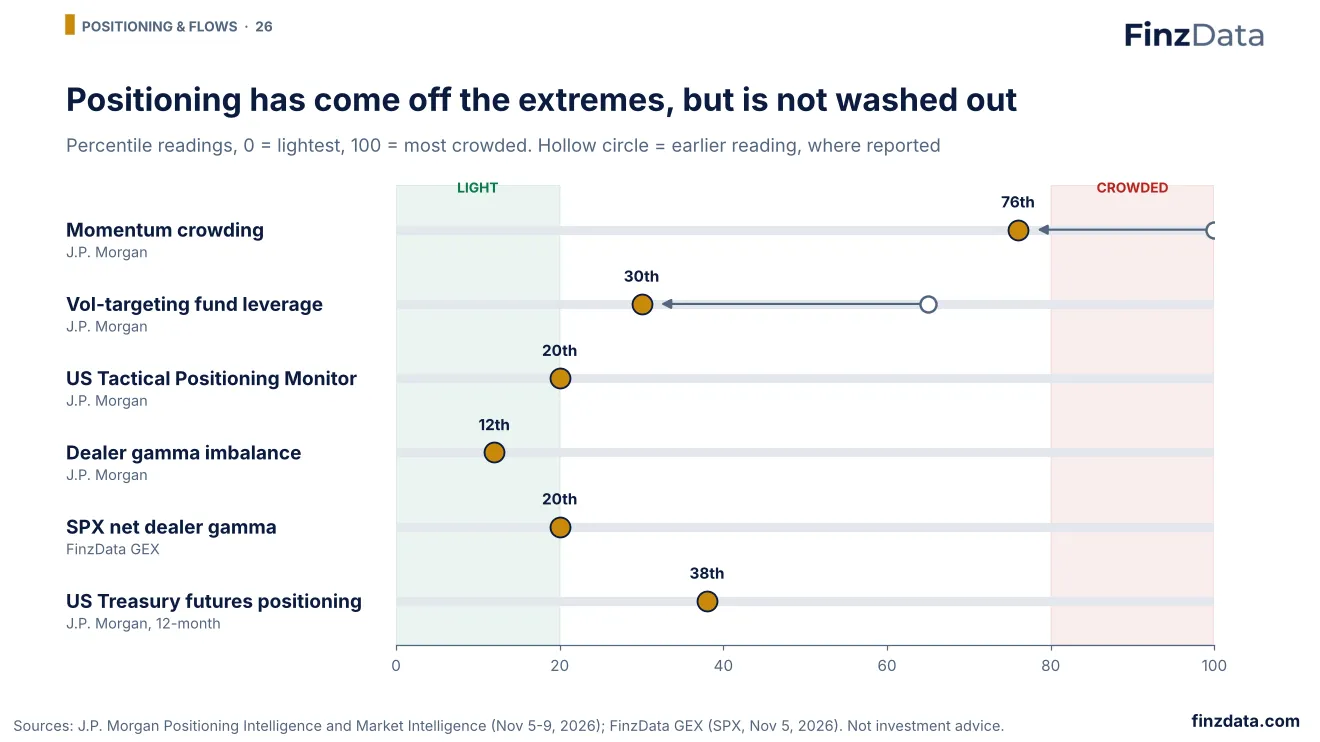
Positioning thermometer.
Gathering the positioning readings on one scale shows the reset: J.P. Morgan's momentum crowding has fallen from the 100th to the 76th percentile and vol-targeting leverage from the 65th to the 30th, while its Tactical Positioning Monitor sits at the 20th percentile and its dealer gamma imbalance at the 12th. FinzData's SPX net dealer gamma is at the 20th percentile. Positioning is no longer crowded, but J.P. Morgan notes the four-week change has not yet reached the level it treats as a capitulation signal.
27. Dealer gamma (GEX): short gamma
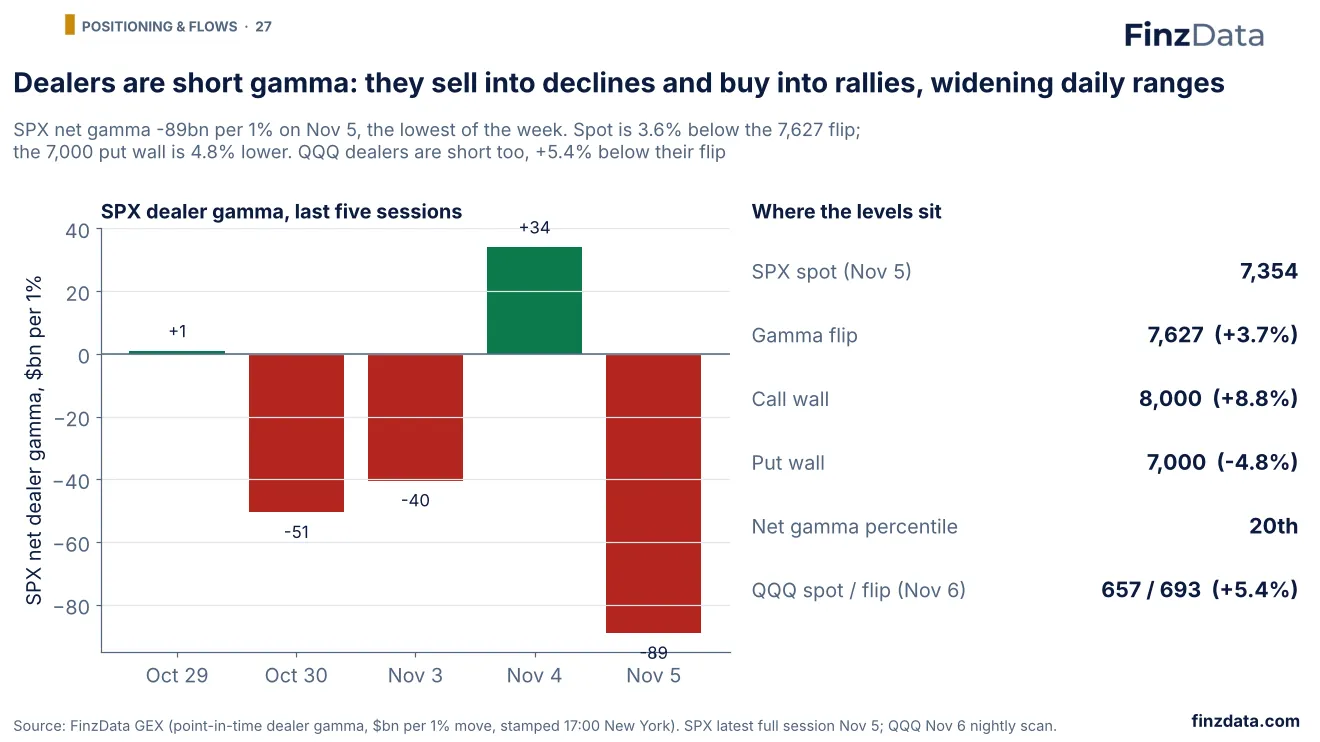
Dealer gamma (GEX): short gamma.
FinzData's point-in-time GEX shows SPX dealers net short 89bn of gamma per 1% move after Thursday's close, in the 20th percentile of readings. Spot (7,354) is 3.6% below the gamma flip at 7,627, with the largest put open interest at 7,000 and calls at 8,000. In short gamma, dealer hedging adds to moves in both directions. In FinzData's SPY gamma-regime study (4,223 sessions since 2010), next-day moves averaged 0.90% after short-gamma closes versus 0.46% after long-gamma closes. QQQ is also short gamma, with spot 657 about +5.4% below its 693 flip.
28. Volatility curve in backwardation
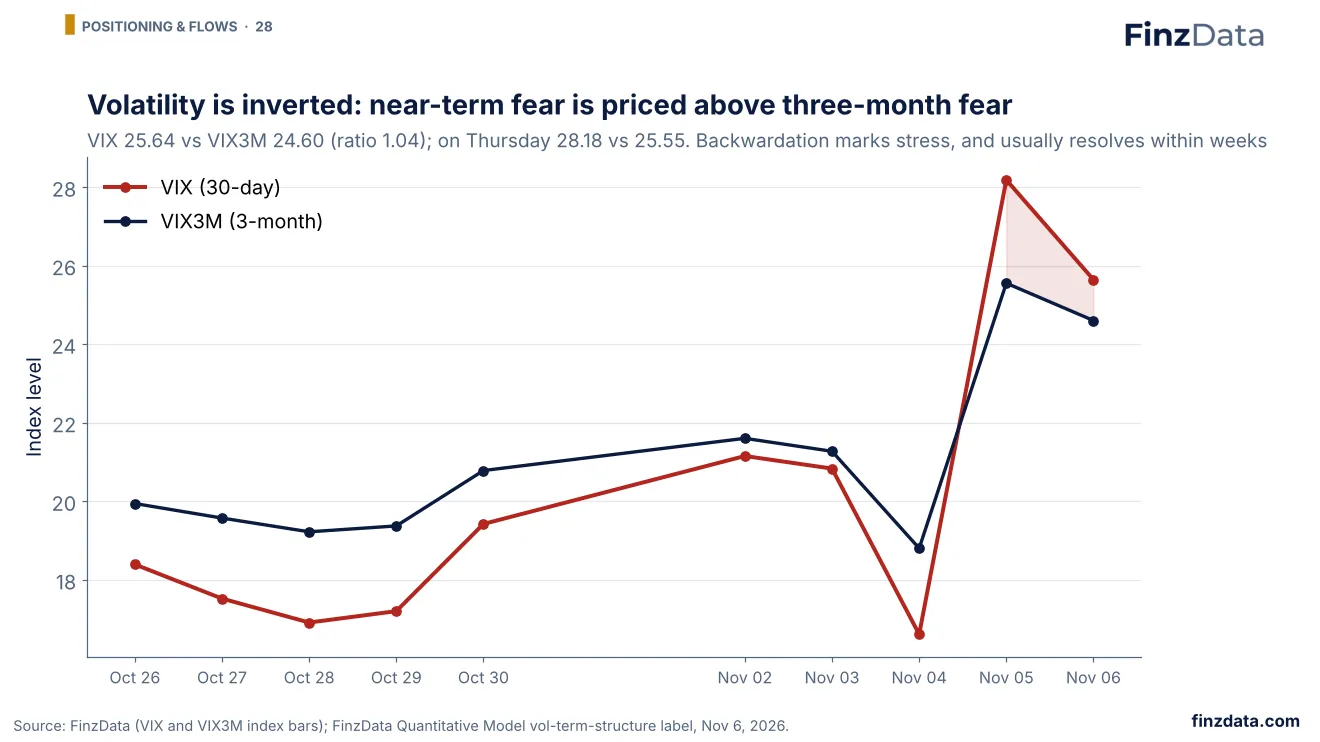
Volatility curve in backwardation.
The VIX jumped from 16.61 on Wednesday to 28.18 on Thursday and closed the week at 25.64. It sits above the three-month VIX3M (24.60), so the volatility curve is in backwardation, the FinzData Quantitative Model label as of November 6. Inversions mark acute stress and have tended to be short-lived; a return of VIX below VIX3M is the first sign the de-risking is done.
29. Section 5: Energy & geopolitics
Section 5: Energy & geopolitics.
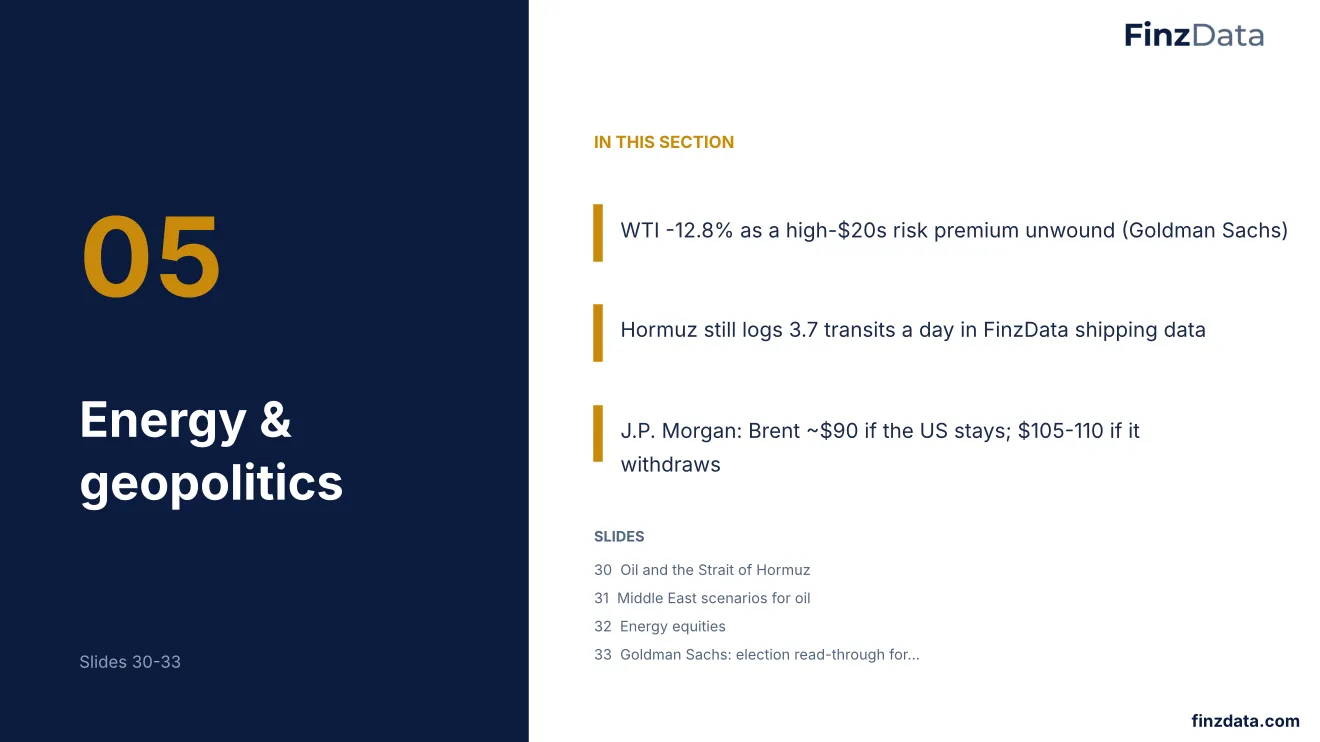
WTI -12.8% as a high-$20s risk premium unwound (Goldman Sachs). Hormuz still logs 3.7 transits a day in FinzData shipping data. J.P. Morgan: Brent ~$90 if the US stays; $105-110 if it withdraws.
30. Oil and the Strait of Hormuz
Oil and the Strait of Hormuz.
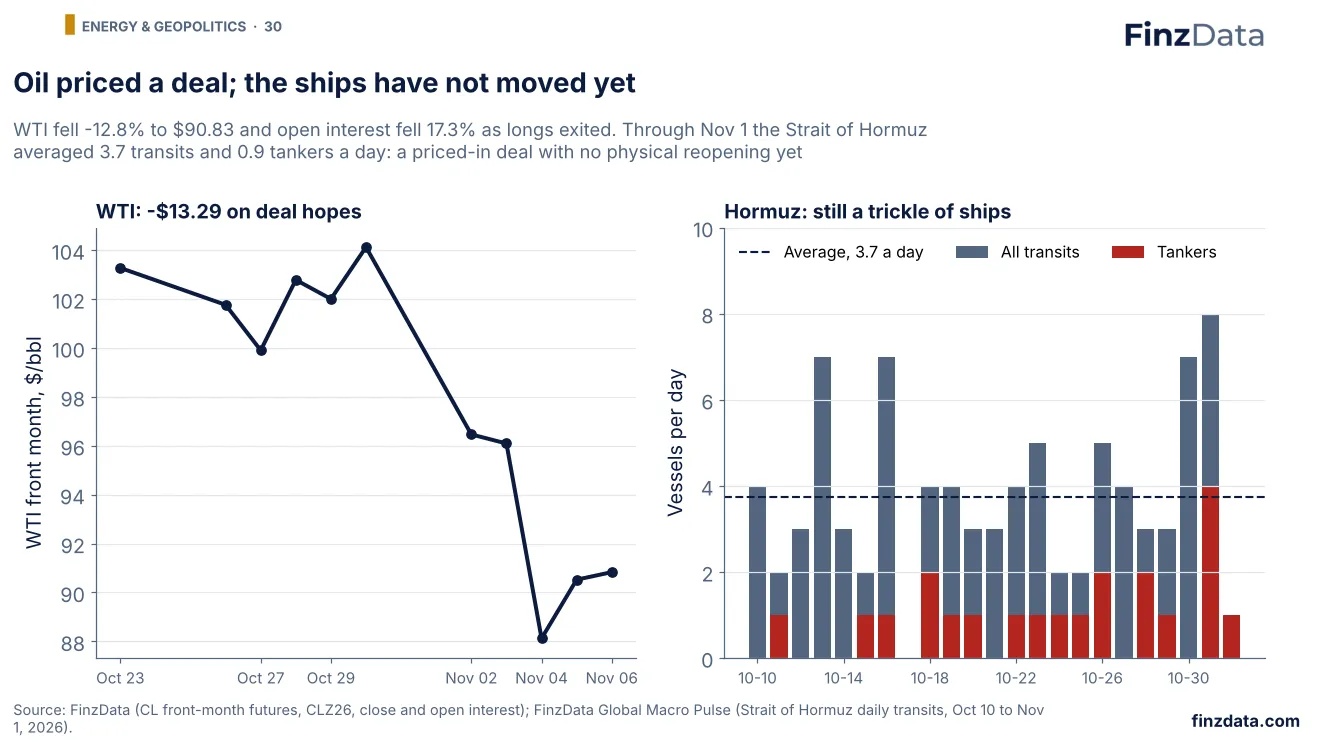
WTI front-month futures fell $13.29 (-12.8%) to $90.83 as US-Iran deal hopes rose after the election. Open interest fell -17.3% between Oct 30 and Nov 5, consistent with long liquidation rather than new shorts. FinzData Global Macro Pulse shows the Strait of Hormuz still nearly closed: 3.7 vessel transits and 0.9 tankers a day on average from October 10 to November 1. Prices have moved ahead of physical flows; if talks stall, that gap is the risk.
31. Middle East scenarios for oil
Middle East scenarios for oil.
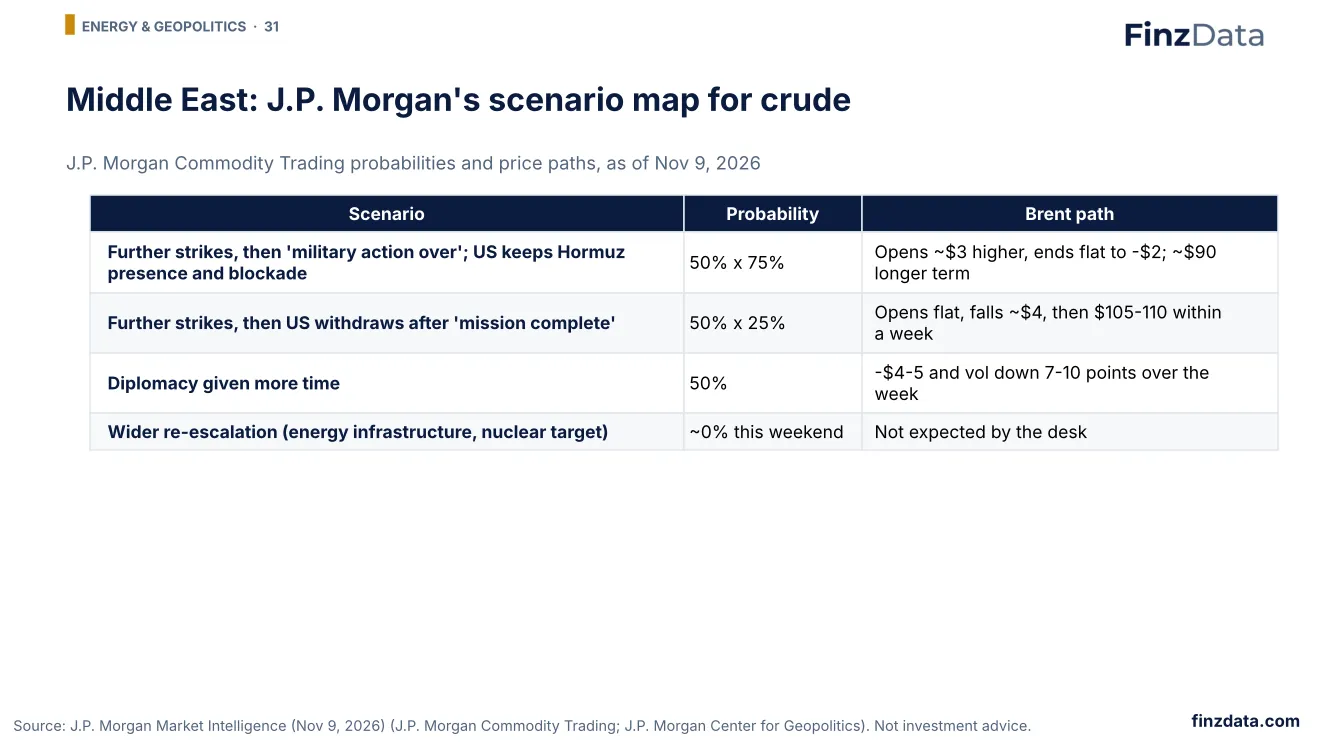
J.P. Morgan's commodity desk puts even odds on further strikes followed by a declaration that military action is over, and on diplomacy being given more time. In the strike case, a continued US presence securing Hormuz would leave Brent near $90 longer term, while a withdrawal could take it to $105-110 within a week; the diplomacy case means $4-5 lower and a 7-10 point drop in oil volatility. Goldman Sachs notes Middle East physical crude flows are back near pre-war levels, while FinzData's chokepoint data still counts only 3.7 transits a day through Hormuz itself, so much of the oil is taking other routes.
32. Energy equities
Energy equities.
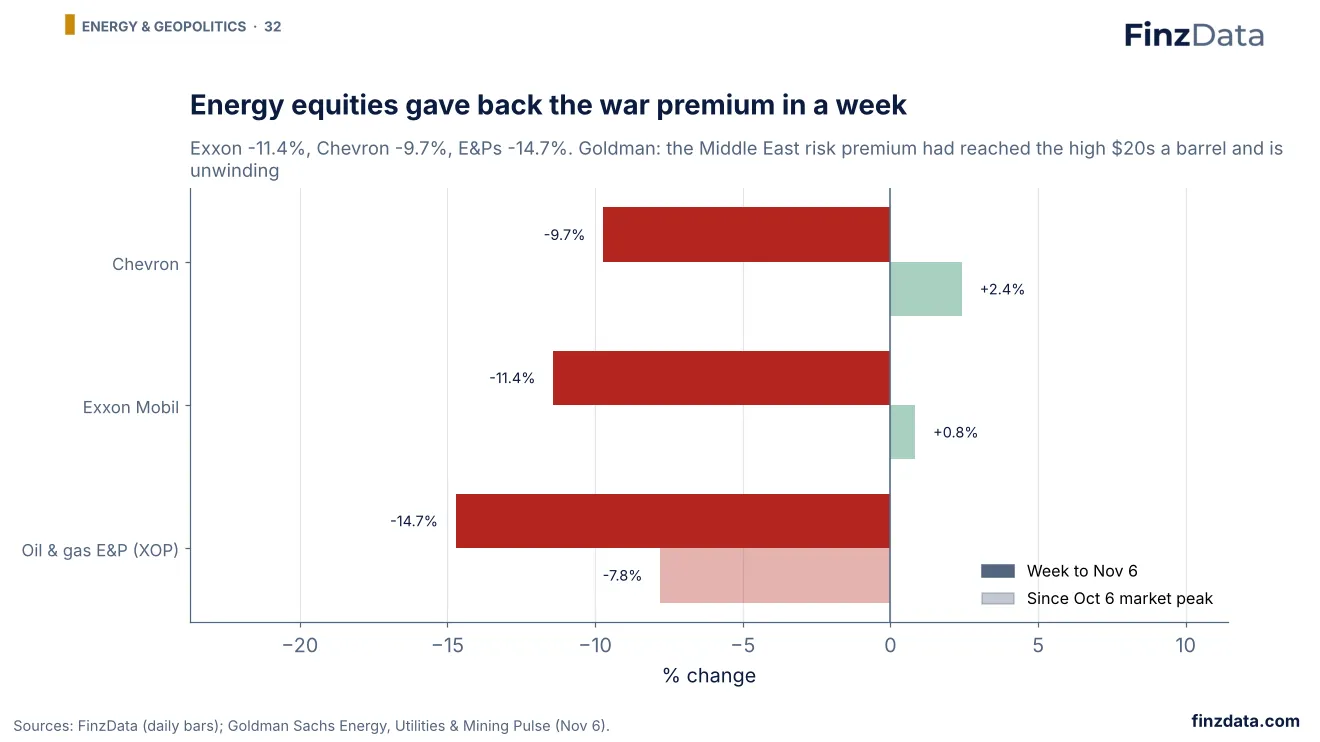
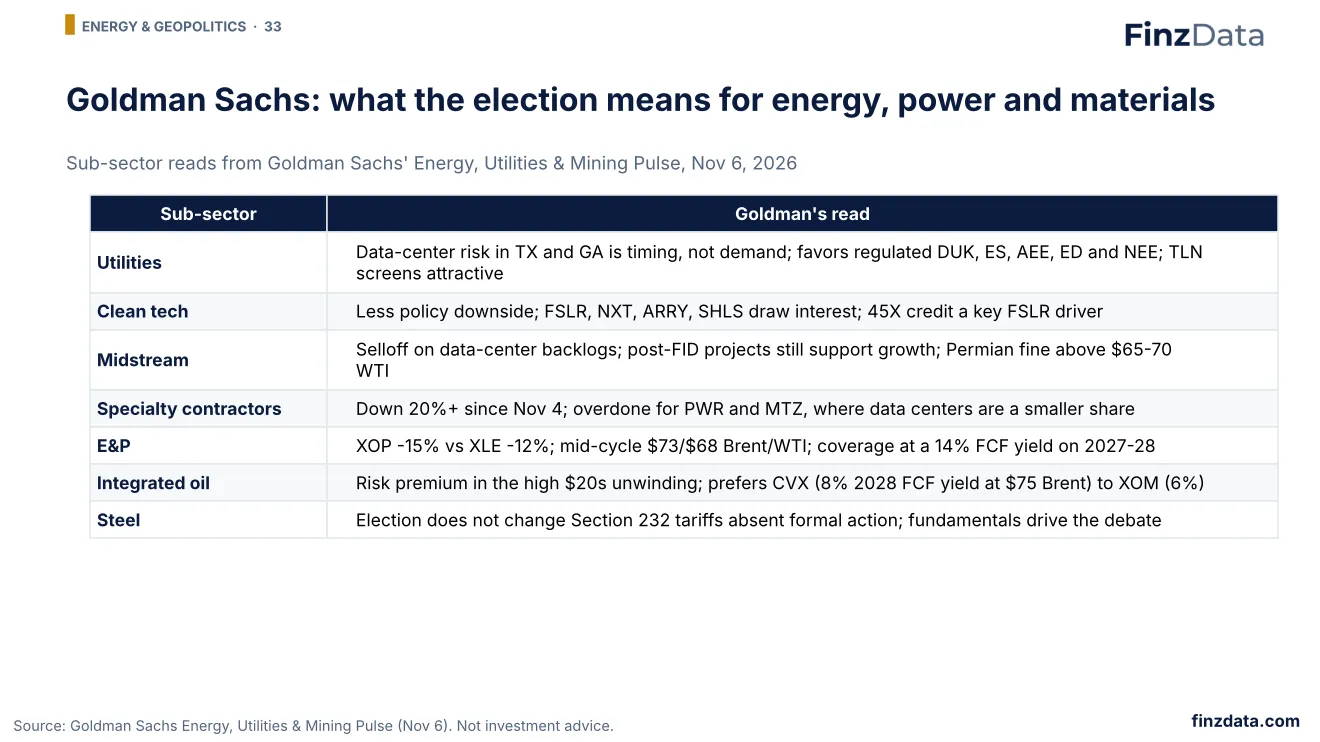
Oil equities tracked crude lower: Exxon -11.4%, Chevron -9.7% and the E&P ETF -14.7%. Goldman Sachs estimates the geopolitical risk premium had built to the high $20s a barrel and accounted for most of October's rally; its E&P coverage still trades at about a 14% free-cash-flow yield on a conservative $73/$68 Brent/WTI mid-cycle deck, and it prefers Chevron to Exxon.
33. Goldman Sachs: election read-through for energy and power
Goldman Sachs: election read-through for energy and power.
Goldman Sachs' energy, utilities and mining analysts went sub-sector by sub-sector after the election. In brief: data-center uncertainty is a timing issue for utilities, clean tech faces less policy downside, midstream growth is supported by projects already sanctioned, the specialty-contractor selloff looks overdone, and oil equities are pricing a falling geopolitical premium against conservative mid-cycle valuations.
34. Section 6: Rates, macro & earnings
Section 6: Rates, macro & earnings.
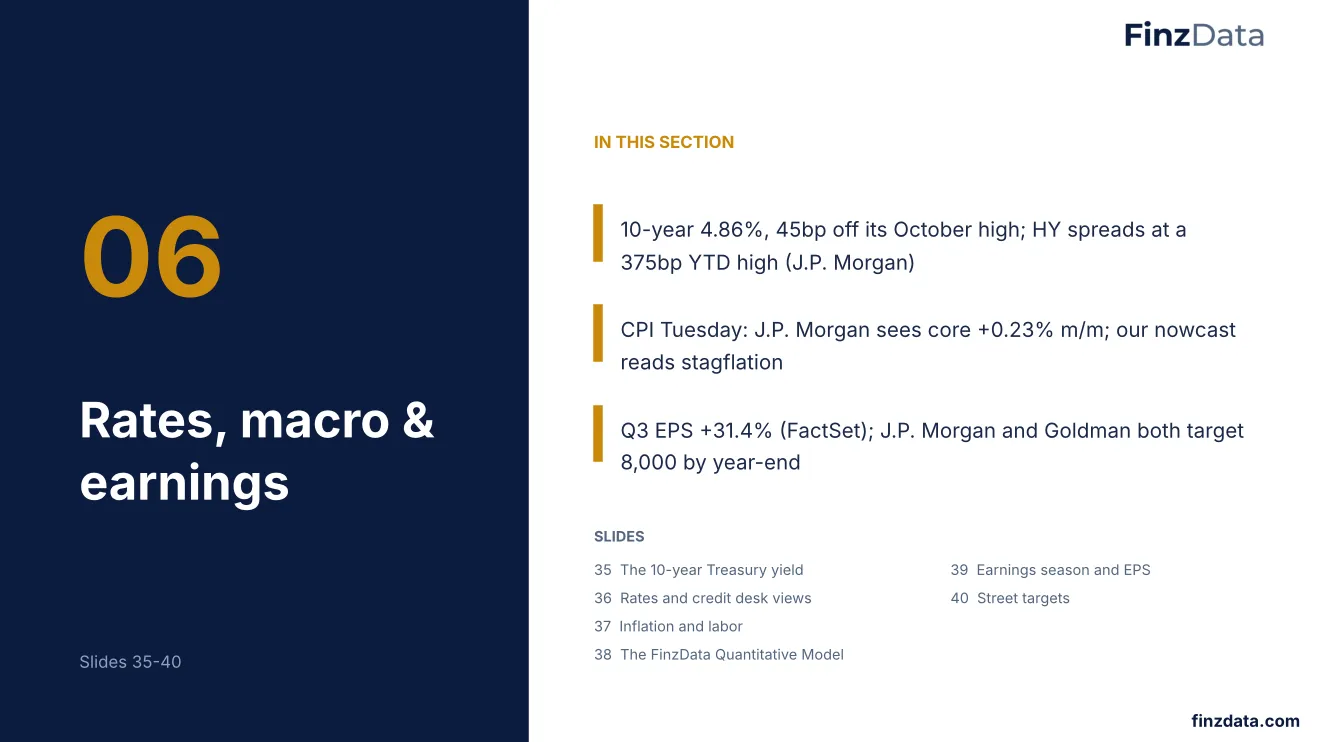
10-year 4.86%, 45bp off its October high; HY spreads at a 375bp YTD high (J.P. Morgan). CPI Tuesday: J.P. Morgan sees core +0.23% m/m; our nowcast reads stagflation. Q3 EPS +31.4% (FactSet); J.P. Morgan and Goldman both target 8,000 by year-end.
35. The 10-year Treasury yield
The 10-year Treasury yield.
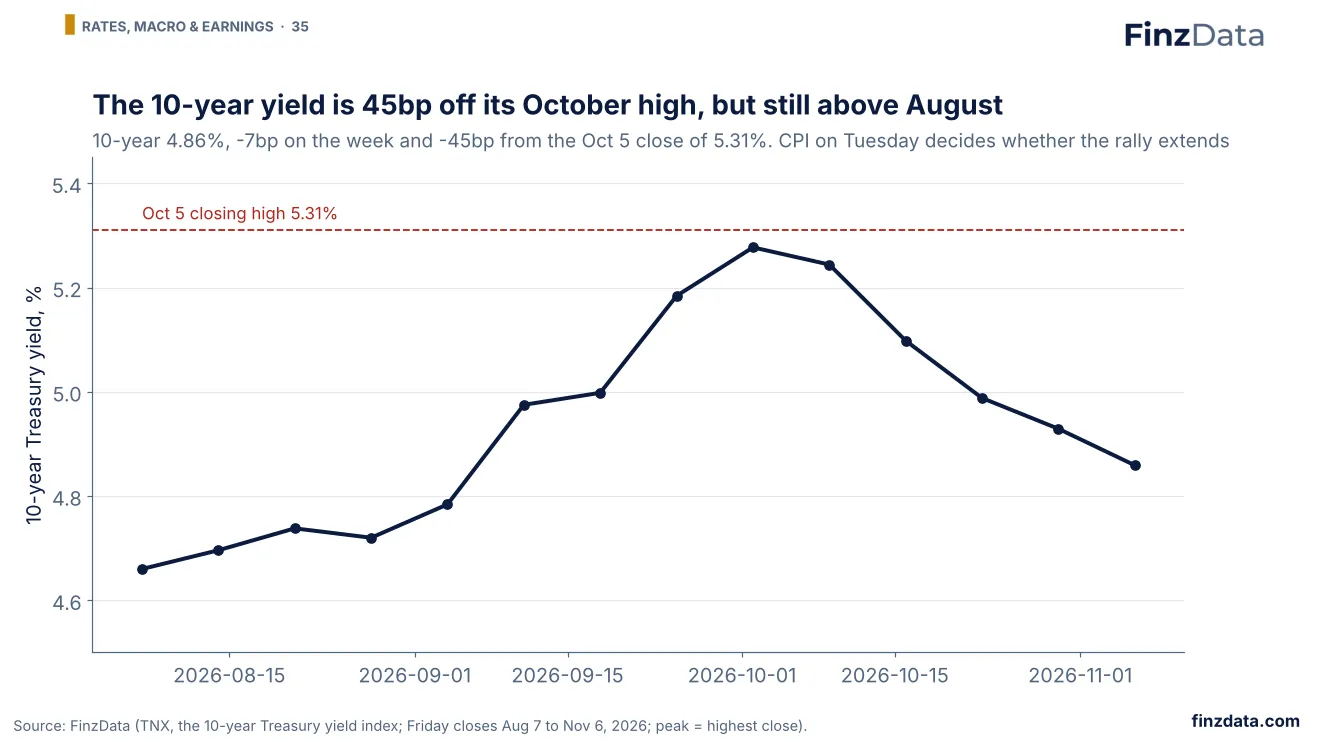
The 10-year Treasury yield ended at 4.86%, down 7bp on the week and 45bp below its October 5 closing high of 5.31%, as lower oil eased inflation fears. It remains above the 4.66% of early August. With a December Fed hike still debated, Tuesday's October CPI is the next test for the bond rally.
36. Rates and credit desk views
Rates and credit desk views.
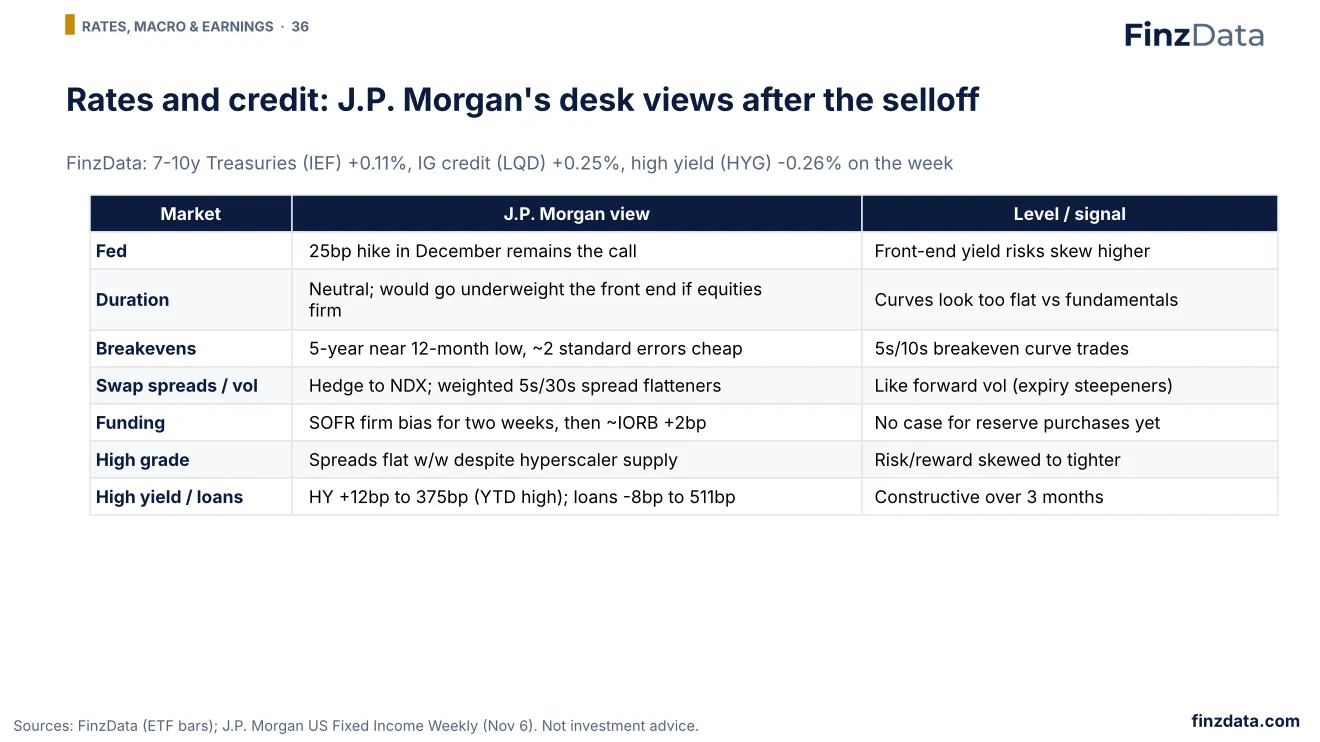
J.P. Morgan's fixed-income strategists still expect a 25bp Fed hike in December and see risks of front-end yields reversing higher, but stay neutral duration for now. They see five-year breakevens near 12-month lows and cheap to fair value, and recommend hedging swap-spread and volatility trades against Nasdaq-100 moves. High-grade spreads were unchanged on the week despite heavy hyperscaler supply, while high-yield spreads widened 12bp to a year-to-date high of 375bp; leveraged loans tightened to 511bp.
37. Inflation and labor
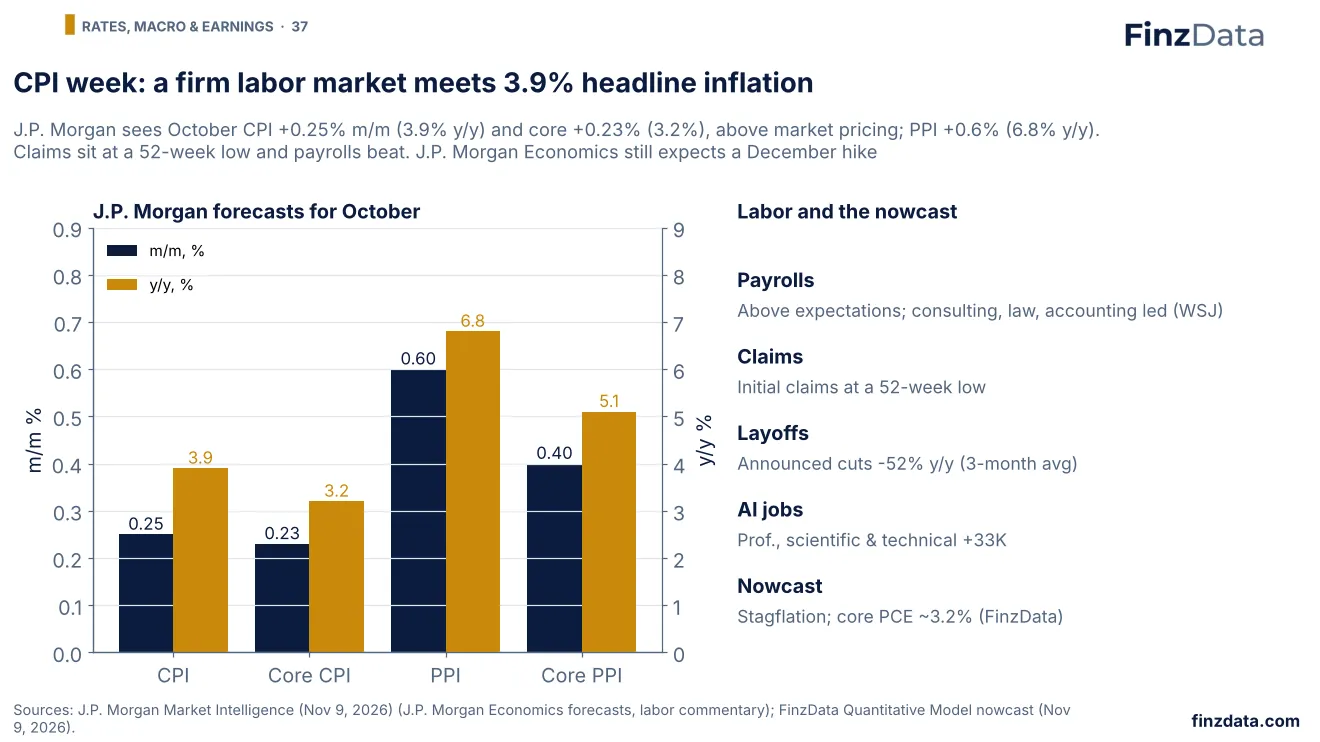
Inflation and labor.
J.P. Morgan Economics expects October CPI to rise 0.25% month on month (3.9% year on year) and core 0.23% (3.2%), with PPI up 0.6% (6.8% year on year) and core PPI 0.4% (5.1%). Its rates team notes the CPI forecast is above market pricing. The labor market remains firm: payrolls beat expectations, initial claims are at a 52-week low and announced job cuts are down 52% from a year ago. Chief US Economist Mike Feroli points to a 33,000 rise in professional, scientific and technical jobs, the area most exposed to AI job-loss fears. FinzData's nowcast puts October in the stagflation quadrant, with core PCE tracking about 3.2%.
38. The FinzData Quantitative Model
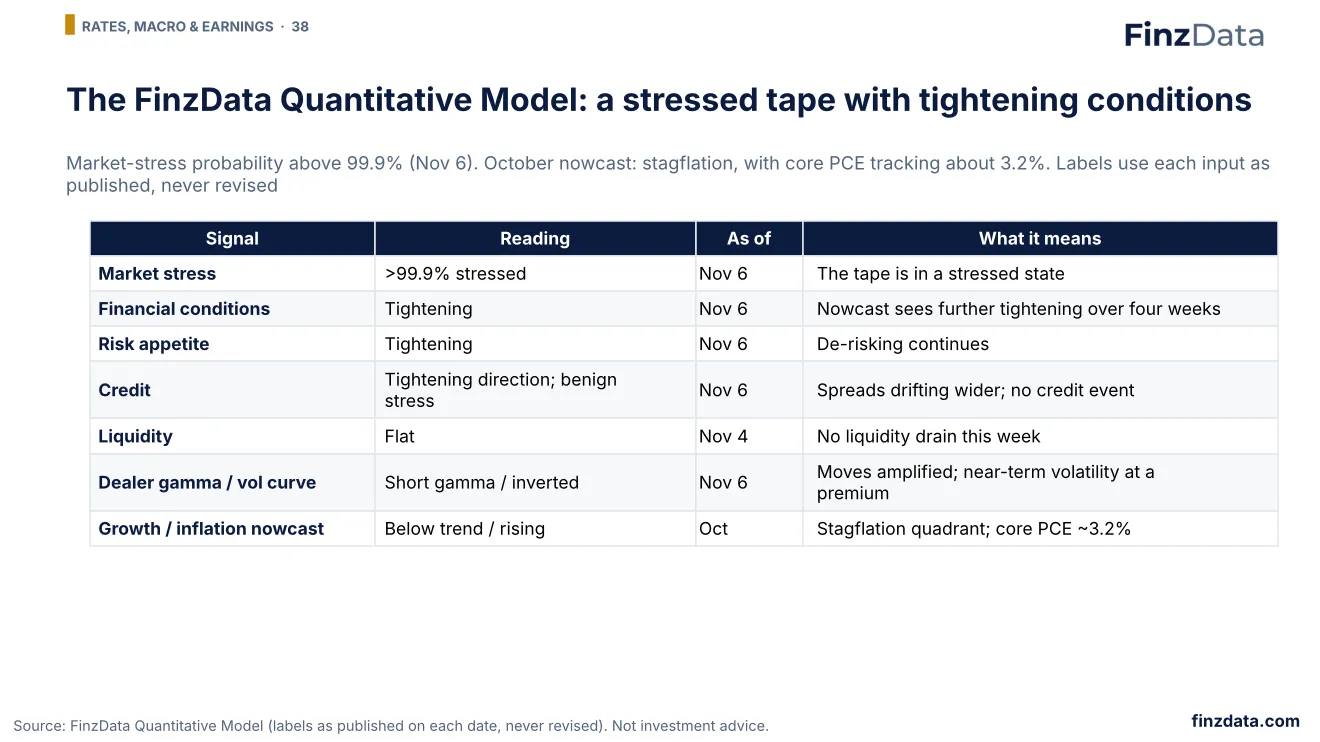
The FinzData Quantitative Model.
Every risk label in the FinzData Quantitative Model points the same way: market-stress probability above 99.9%, financial conditions, risk appetite and credit direction all tightening, dealers short gamma and the volatility curve in backwardation. Credit stress is still benign and liquidity is flat, so this is a risk-appetite shock rather than a funding one. The October nowcast has moved to stagflation, growth below trend with inflation rising and core PCE tracking about 3.2%, which is why Tuesday's CPI matters.
39. Earnings season and EPS
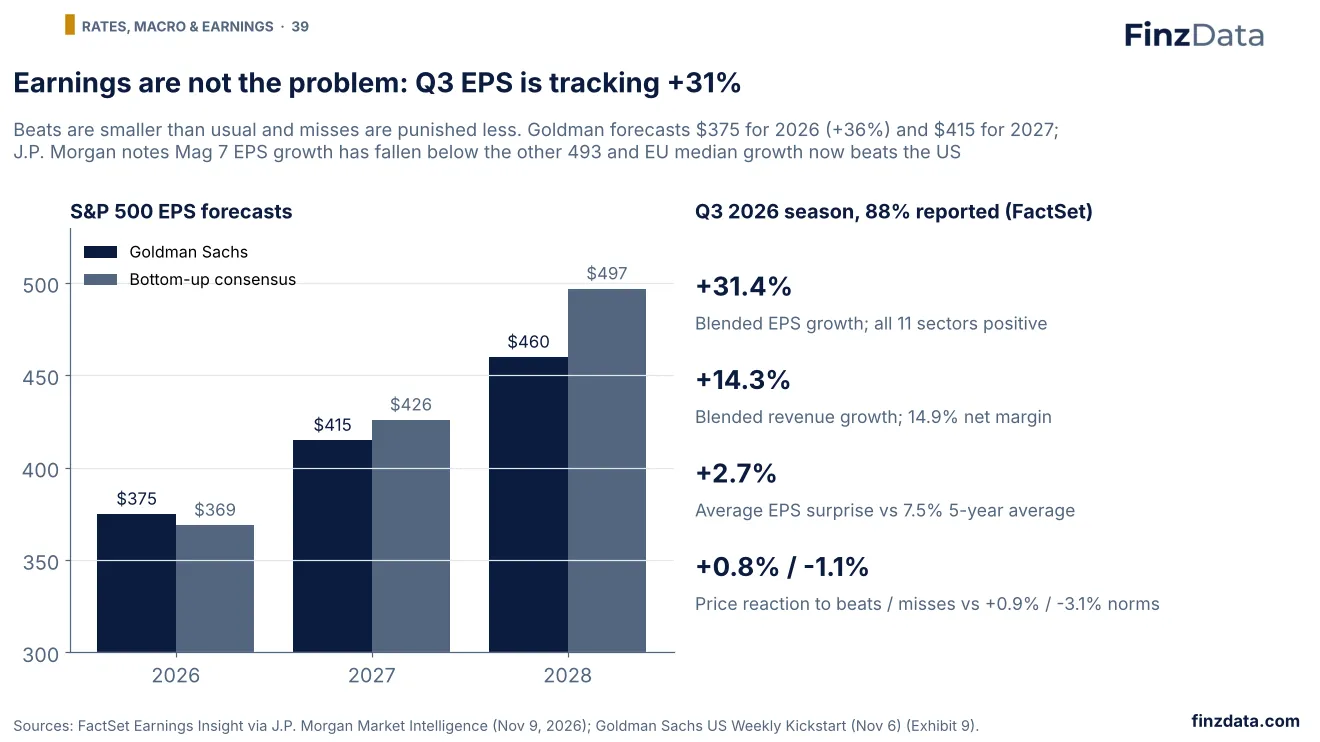
Earnings season and EPS.
With 88% of the S&P 500 reported, FactSet's blended third-quarter earnings growth is 31.4% on revenue growth of 14.3%, and all 11 sectors are growing. Surprises are smaller than usual (2.7% vs a 7.5% five-year average) and the market is neither rewarding beats nor punishing misses as much as normal. Goldman Sachs forecasts S&P 500 EPS of $375 for 2026, $415 for 2027 and $460 for 2028. J.P. Morgan notes Magnificent 7 earnings growth is now below that of the other 493 companies and Europe's median growth has overtaken the US for the first time since late 2024.
40. Street targets
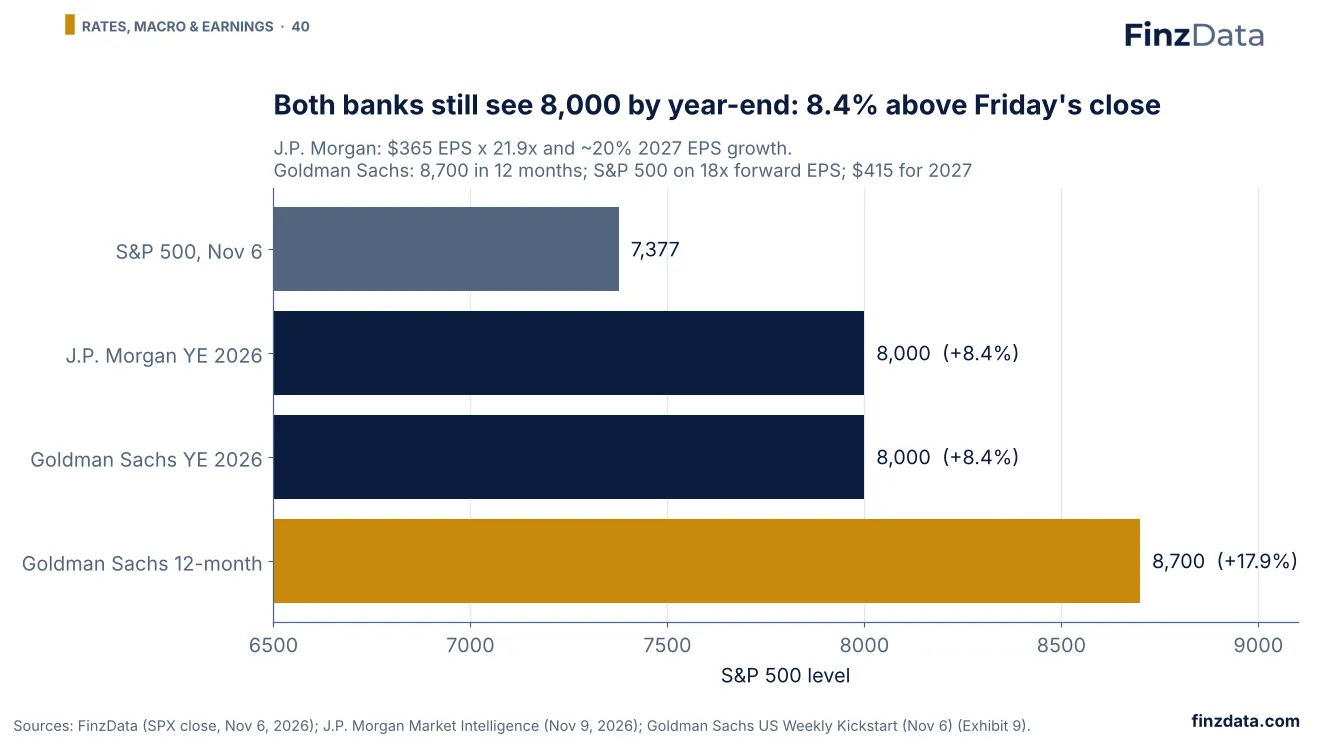
Street targets.
J.P. Morgan's Head of Global Markets Strategy, Dubravko Lakos-Bujas, reiterated a year-end S&P 500 target of 8,000 ($365 EPS at 21.9x), +8.4% above Friday's close, and expects about 20% EPS growth in 2027. Goldman Sachs also targets 8,000 for year-end 2026 and 8,700 over 12 months, with the index on 18x forward earnings. J.P. Morgan's trade ideas: long 12-month vs short 3-month momentum (effectively tech vs energy and defensives), AI upstream on the positioning flush, and caution on consumer cyclicals until mortgage rates approach 6%.
41. Section 7: Policy & outlook
Section 7: Policy & outlook.
After 20 midterms the S&P 500 rose in 18 in the next three months (Bloomberg Intelligence). Our read: a positioning flush in an earnings boom; CPI and Dec 9 decide the path. Three scenarios with the data that would confirm each.
42. Midterm history
Midterm history.
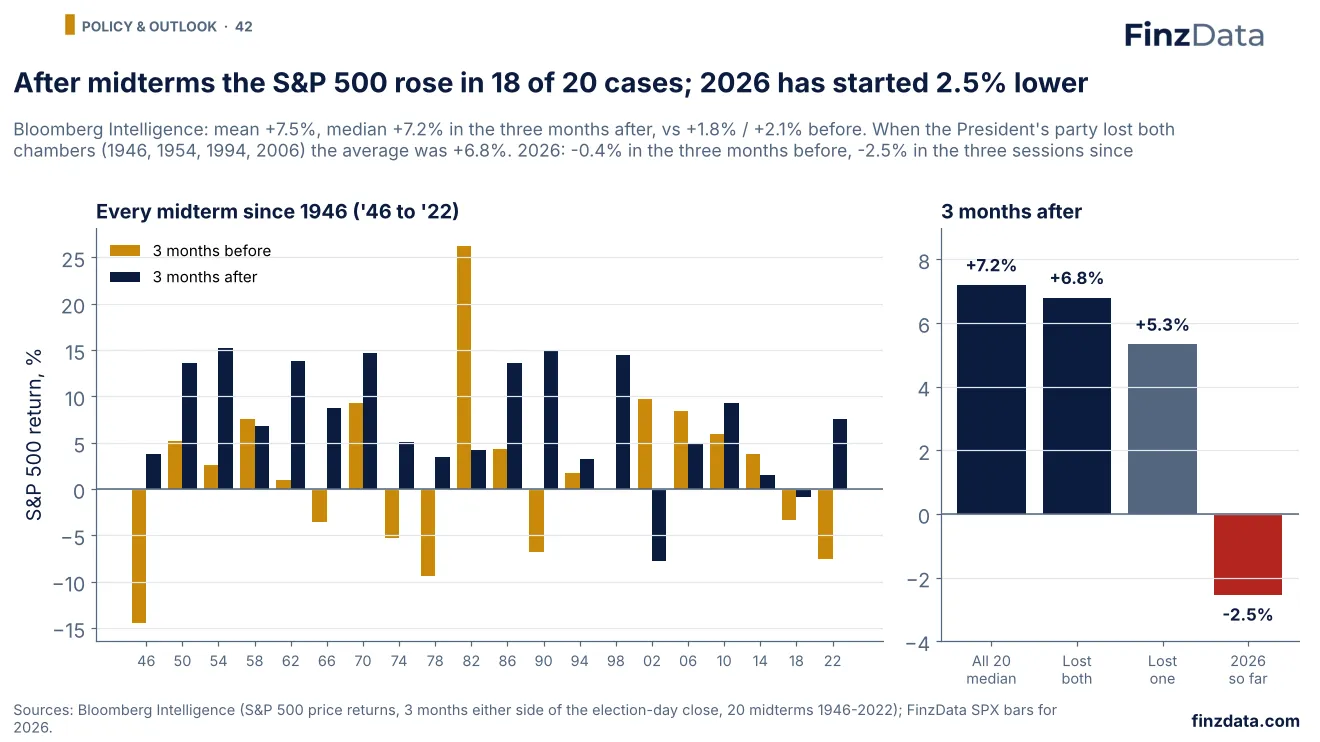
Bloomberg Intelligence's study of 20 midterms since 1946 shows the S&P 500 rose in the three months after the election in 18 cases, by a mean 7.5% and median 7.2%, against 1.8% and 2.1% in the three months before. The only declines were 2002 (-7.8%) and 2018 (-0.9%). In the four years when the President's party lost both chambers, as in 2026, the average gain was 6.8%. This cycle the index fell 0.4% in the three months before November 3 and is 2.5% lower three sessions after it, so history would need a strong finish to the window to repeat.
43. Washington and market structure
Washington and market structure.
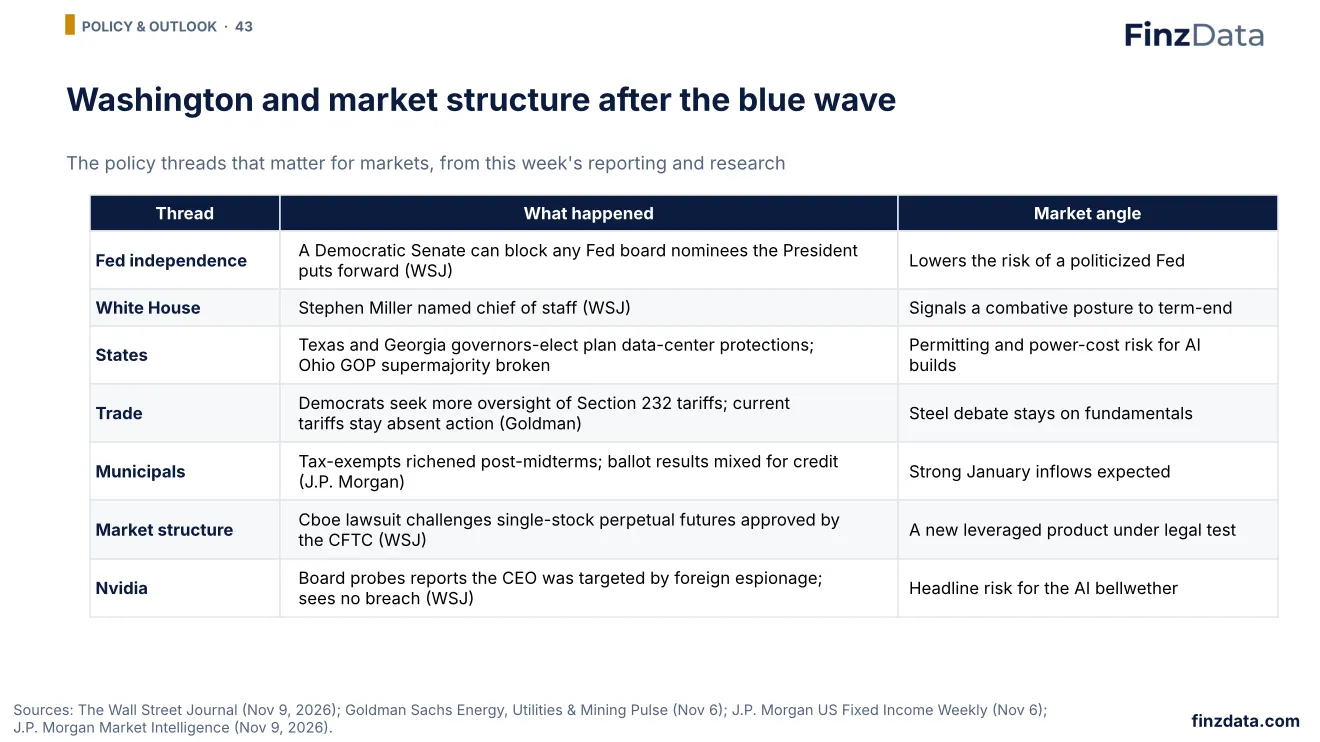
The Wall Street Journal reports that the election gives Democrats the strongest check yet on the President's influence over the Fed, since a Democratic Senate can block board nominees. State results matter for AI infrastructure, with Texas and Georgia governors-elect planning data-center protections. Goldman Sachs notes existing steel tariffs stay in place absent formal action, and J.P. Morgan sees tax-exempt municipals richening on better technicals. In market structure, Cboe is suing over the CFTC's approval of single-stock perpetual futures, and Nvidia's board is reviewing reports that its CEO was targeted by a foreign espionage effort.
44. Street views vs the data
Street views vs the data.
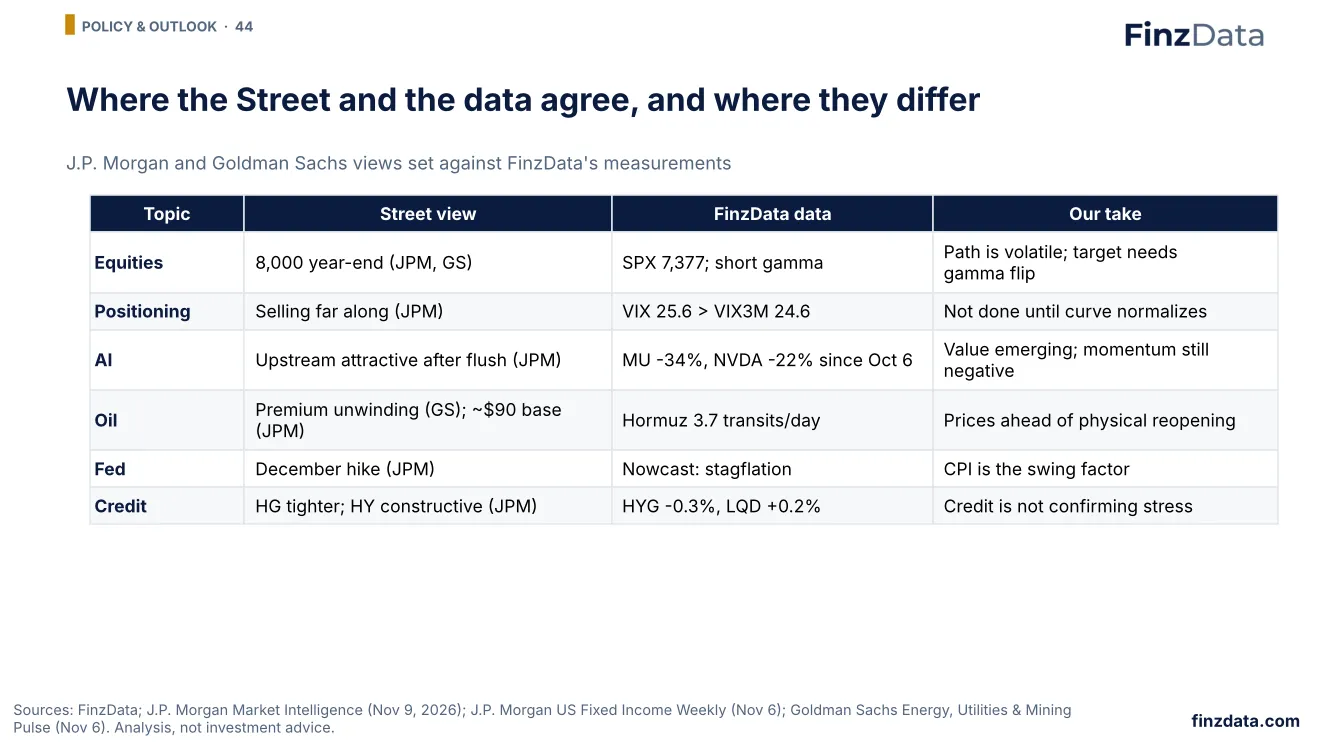
Set side by side, the Street's views and FinzData's measurements agree that the selloff is a positioning event and that credit is not signalling stress. They differ on timing: dealer gamma and the inverted VIX curve say forced flows are not yet over, and shipping data say oil has priced a reopening of Hormuz that has not happened.
45. Our read
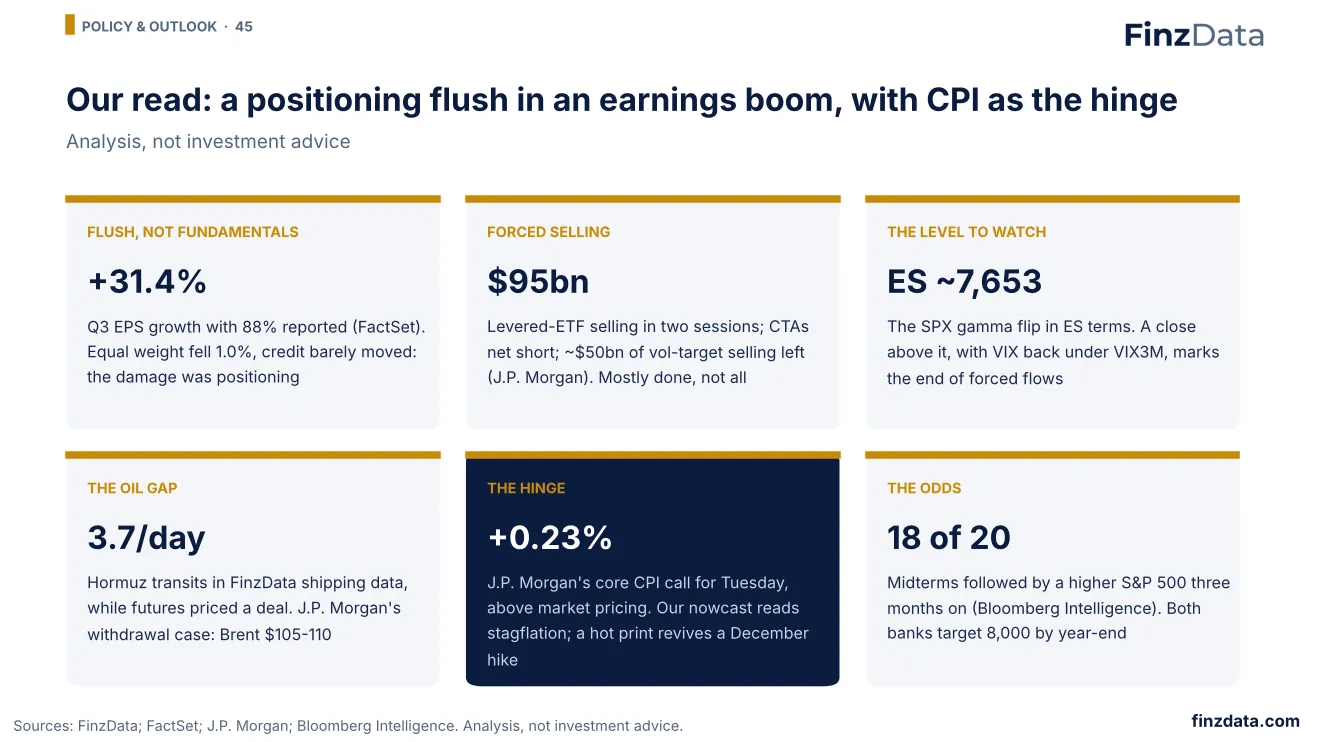
Our read.
Our read: last week was a forced de-grossing of crowded AI positions inside an earnings boom, not the start of an earnings recession. Much of the forced selling is done, but dealers are short gamma and the VIX curve is inverted, so the market remains fragile. Oil has priced a deal that shipping data do not yet show. The decisive data point is Tuesday's CPI: a soft core print supports the rebound that midterm history and Street targets point to; a hot one revives the December hike.
46. Scenarios
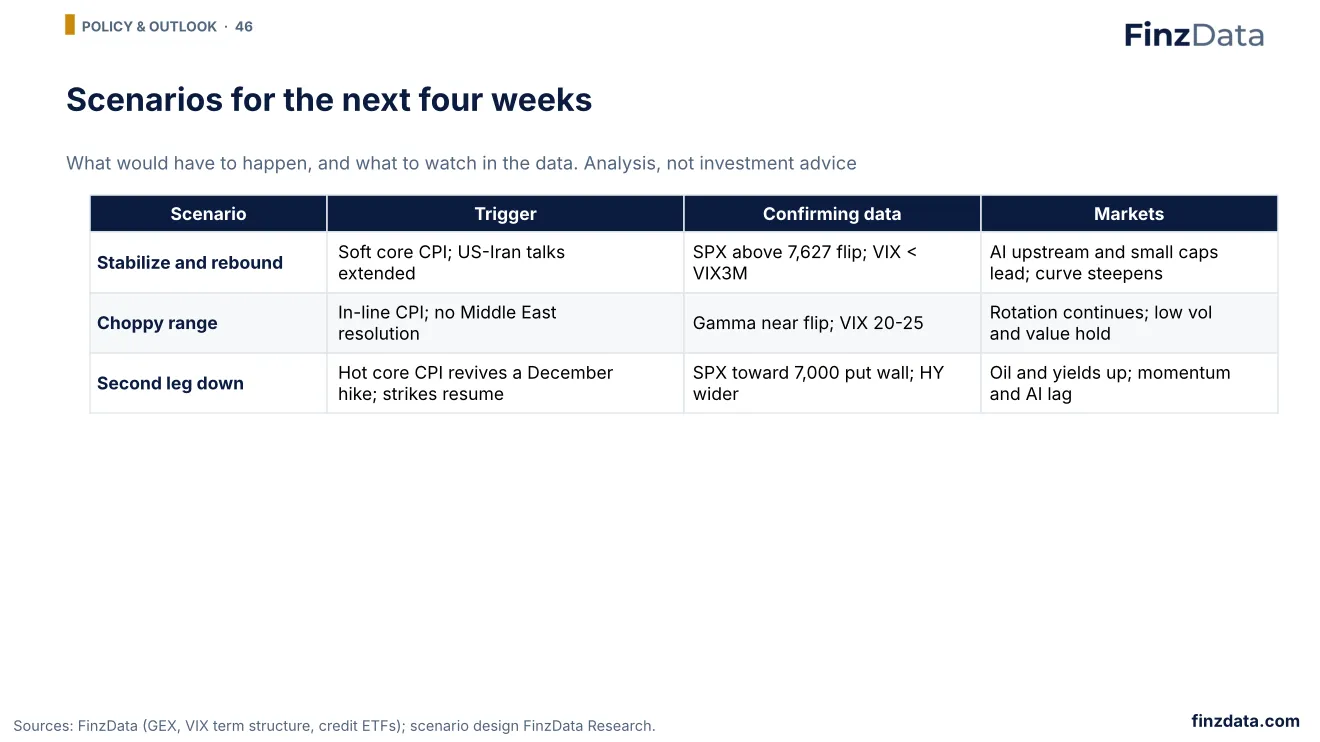
Scenarios.
We frame three paths for the next four weeks. A soft core CPI and extended US-Iran talks would let SPX reclaim its 7,627 gamma flip and the VIX curve normalize. An in-line print without a Middle East resolution keeps the market in a choppy rotation. A hot core print that revives the December hike, or renewed strikes, would push SPX toward the 7,000 put wall with oil and yields higher.
47. What to watch this week
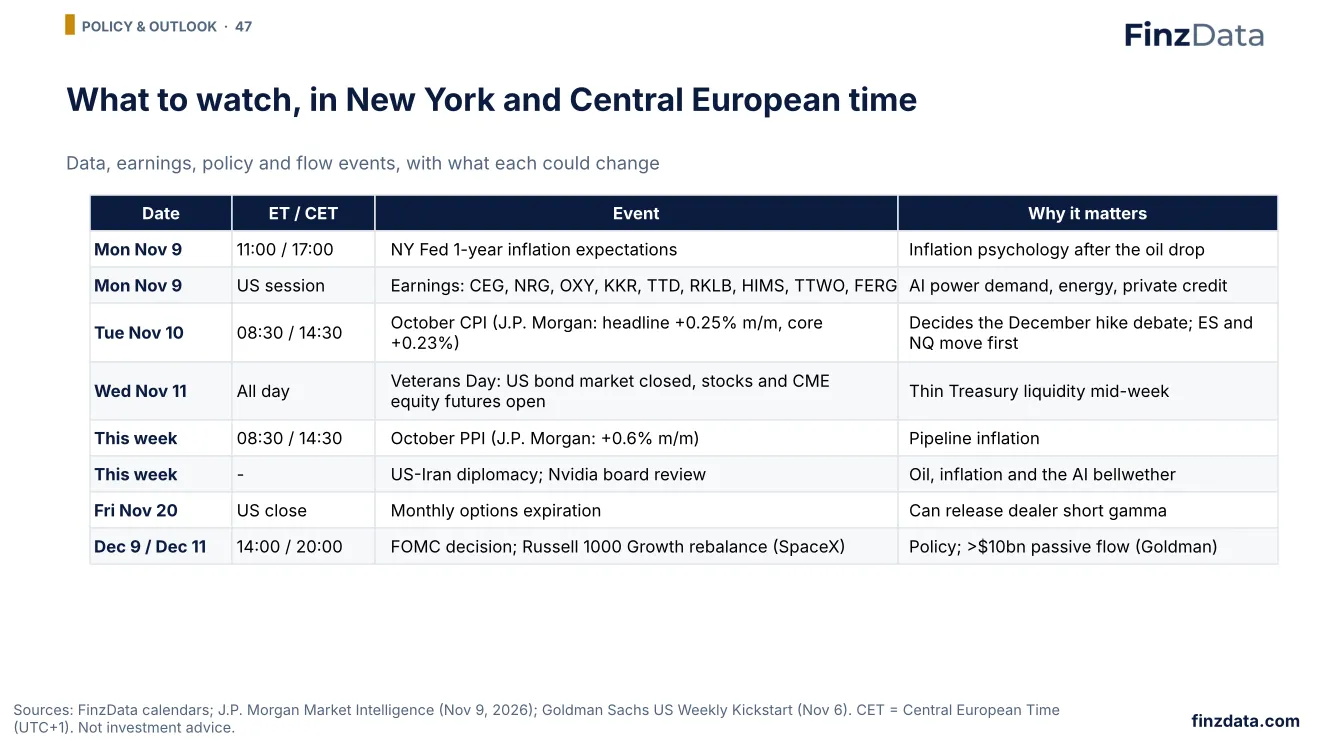
What to watch this week.
Times are given in New York and Central European time for our readers in Europe. Monday brings the New York Fed's inflation expectations and earnings from Constellation Energy, NRG, Occidental, KKR, The Trade Desk, Rocket Lab and others. October CPI on Tuesday at 08:30 New York (14:30 CET) is the week's main event, with J.P. Morgan forecasting +0.25% headline and +0.23% core. The bond market is closed Wednesday. PPI and US-Iran diplomacy follow. Further out: monthly options expiration on November 20, the FOMC on December 8-9 and the Russell 1000 Growth rebalance on December 11.
48. The data behind this briefing
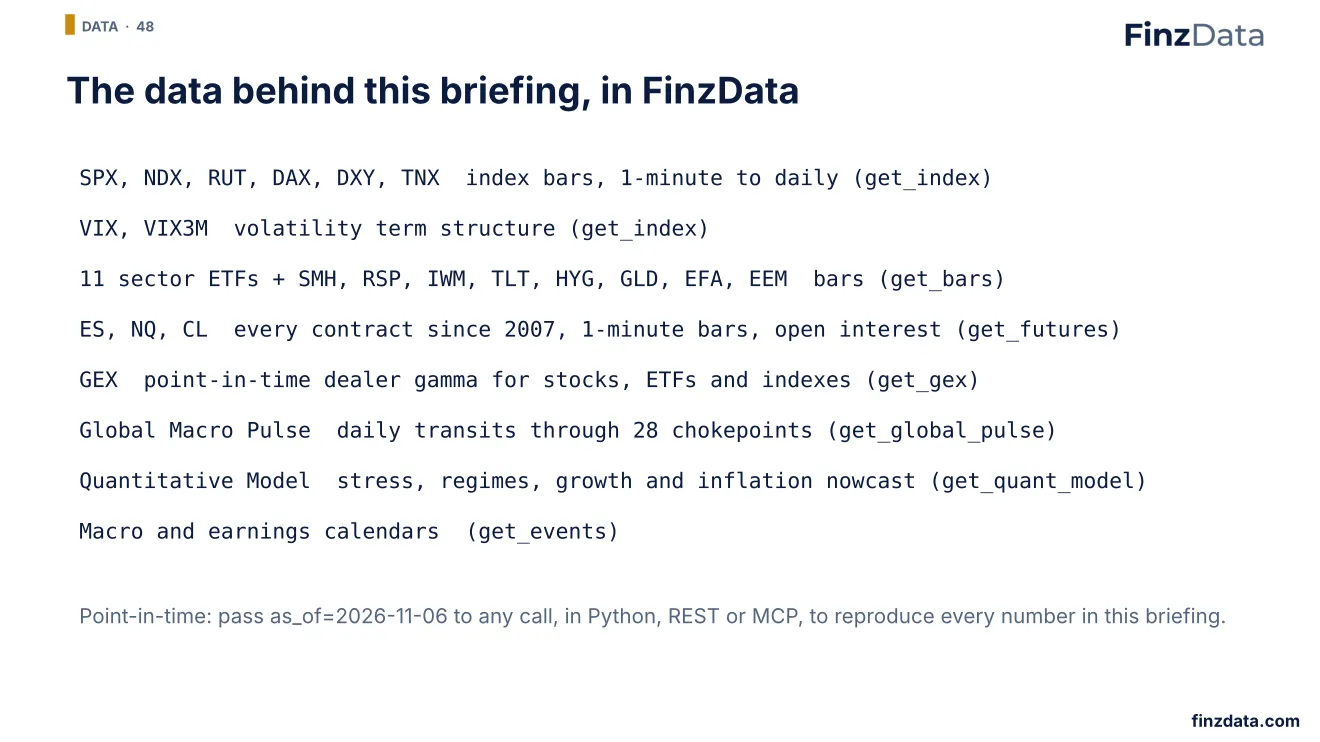
Every series in this briefing is available point-in-time in FinzData.
Frequently asked questions
Why is the stock market down this week?
The S&P 500 fell 2.68% in the week to November 6, 2026, its fourth straight weekly loss, and the Nasdaq-100 fell 4.91%. The selling was concentrated in crowded AI names: the equal-weight S&P 500 lost only 1.0% and five of twelve sector funds rose. J.P. Morgan describes the largest 20-day hedge-fund de-gross outside Covid, about $95bn of leveraged-ETF selling over two sessions and CTAs turning net short.
Is this a stock market crash in 2026?
Not by the usual definitions. The S&P 500 closed November 6 at 7,376.86, 5.7% below its October 6 record and short of the 10% that marks a correction. The Nasdaq-100 is 13.6% below its October 6 peak, which is correction territory. High-yield credit (HYG) slipped only 0.26% on the week.
Is the AI bubble bursting?
AI valuations have reset hard: Micron is 34% and AMD 31% below their October 6 closes, and J.P. Morgan estimates AI multiples are down about 35% since May (memory 60%, semiconductors 52%). Earnings have not cracked: third-quarter S&P 500 EPS growth is tracking 31.4% with 88% of companies reported (FactSet). The data point to a positioning and valuation reset rather than an earnings collapse.
What are the key levels for ES and NQ futures this week?
ES (December) closed the week at 7,402 after a 7,322-7,746 range; NQ closed at 27,085 after a 26,366-28,969 range. FinzData's dealer-gamma levels translate to about ES 7,653 for the SPX gamma flip, ES 7,025 for the 7,000 put wall and NQ 28,537 for the QQQ gamma flip.
What is gamma exposure, and are dealers long or short gamma?
Gamma exposure (GEX) estimates how much options dealers must buy or sell to stay hedged as the market moves. On November 5 FinzData GEX showed SPX dealers short about 89bn of gamma per 1% move, so their hedging tends to amplify moves; above the 7,627 gamma flip it would dampen them instead.
When is the CPI report, and what is expected?
October CPI is released on Tuesday, November 10, at 08:30 New York time (14:30 CET). J.P. Morgan expects headline CPI of +0.25% month on month (3.9% year on year) and core CPI of +0.23% (3.2%), and still expects a 25bp Fed hike in December.
Why did the oil price fall, and is the Strait of Hormuz open?
WTI crude fell 12.8% to $90.83 as the Middle East risk premium, which Goldman Sachs estimated had reached the high $20s a barrel, unwound on hopes of a US-Iran deal. FinzData shipping data show the Strait of Hormuz averaged only 3.7 vessel transits and 0.9 tankers a day from October 10 to November 1.
How does the stock market perform after midterm elections?
Bloomberg Intelligence finds the S&P 500 rose in the three months after 18 of the 20 midterms since 1946, by a median 7.2% (mean 7.5%). In 2026 the index was 2.5% lower three sessions after the November 3 election.
What time does the US stock market open in Europe?
The New York Stock Exchange and Nasdaq open at 09:30 New York time, which is 15:30 CET through the winter. CME's E-mini S&P 500 (ES) and E-mini Nasdaq-100 (NQ) futures trade nearly around the clock from Sunday evening to Friday afternoon, New York time.
Download the deck (PDF, 48 slides) More research
Auf Deutsch: Aktienmarkt heute, Nasdaq- und S&P-500-Futures
In der Woche bis zum 6. November 2026 fiel der S&P 500 um 2,68 % (der vierte Wochenverlust in Folge) und der Nasdaq-100 um 4,91 %; der DAX schloss praktisch unverändert (+0,01 %). Die S&P-500-Futures (ES) schlossen bei 7.402 (−2,8 %), die Nasdaq-100-Futures (NQ) bei 27.085 (−5,1 %). Options-Dealer sind netto short Gamma; der Gamma-Flip liegt bei etwa ES 7.653. Die US-Verbraucherpreise (CPI) erscheinen am Dienstag, 10. November, um 14:30 Uhr MEZ. Keine Anlageberatung.
En français : la Bourse aujourd'hui et les contrats à terme Nasdaq
Sur la semaine au 6 novembre 2026, le S&P 500 a reculé de 2,68 % (quatrième baisse hebdomadaire consécutive) et le Nasdaq-100 de 4,91 %, tandis que le DAX est resté stable (+0,01 %). Les contrats à terme ES ont clôturé à 7 402 (−2,8 %) et NQ à 27 085 (−5,1 %). Les teneurs de marché sur options sont en gamma négatif ; le seuil de bascule se situe vers ES 7 653. L'inflation américaine (CPI) sera publiée le mardi 10 novembre à 14 h 30 (heure de Paris). Ceci n'est pas un conseil en investissement.
Built for AI, quants, data scientists and financial analysts who backtest. Clean data. Real insights. Real alpha. finzdata.com. This material is for information only and is not investment advice. Data sources: FinzData index, ETF and futures bars (snapshot v2026-11-06); FinzData GEX; FinzData Global Macro Pulse; FinzData Quantitative Model; FactSet Earnings Insight (Nov 6, 2026); The Wall Street Journal (Nov 9, 2026).
Get FinzData research free, every morning
The daily brief: what moved, the macro releases that matter, positioning and liquidity, with charts. One email a day, free, unsubscribe anytime.